

Key Insights
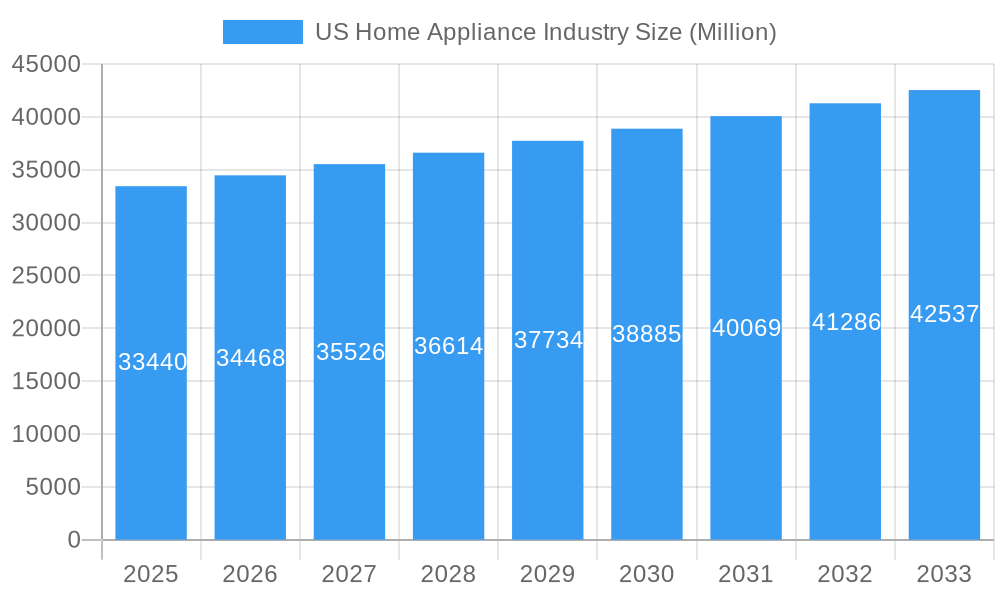
The US home appliance market, valued at $33.44 billion in 2025, is projected to experience steady growth, driven by several key factors. Rising disposable incomes, particularly among millennials and Gen Z who prioritize convenience and smart home technology, fuel demand for high-end appliances with advanced features like smart connectivity and energy efficiency. Furthermore, the increasing prevalence of renovations and new home constructions contributes significantly to market expansion. While supply chain disruptions and inflationary pressures presented challenges in recent years, these factors are anticipated to moderate as the market stabilizes. The segment experiencing the most robust growth is likely smart appliances, integrating seamlessly with smart home ecosystems. Competition among major players like Whirlpool, Samsung, LG, and Bosch remains intense, necessitating continuous innovation and strategic marketing to capture market share. The online distribution channel continues its rapid expansion, presenting both opportunities and challenges for established brands. Differentiation through premium features, superior customer service, and strategic partnerships are key to success in this dynamic landscape.
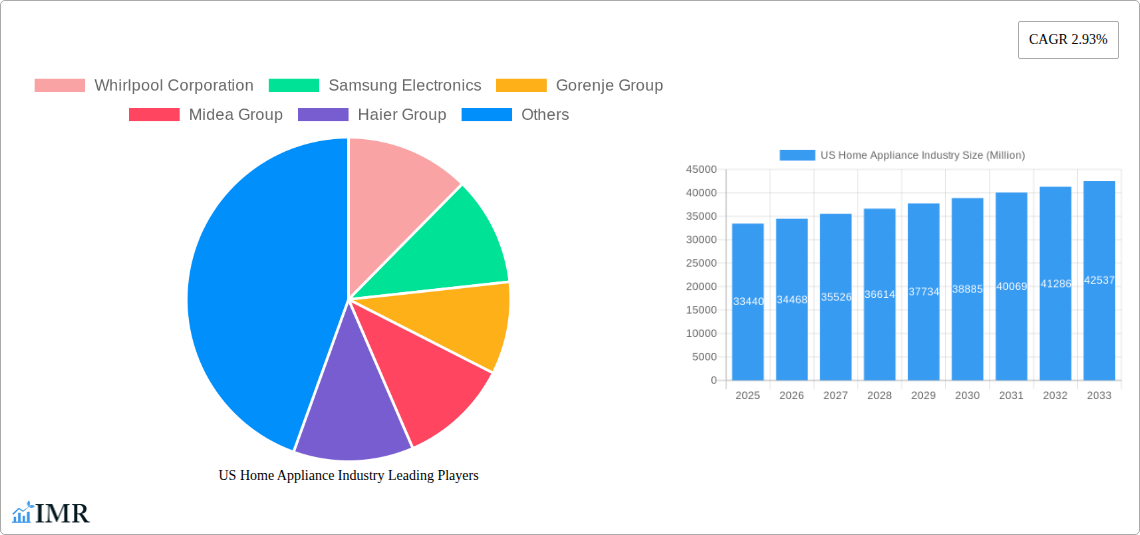
US Home Appliance Industry Market Size (In Billion)
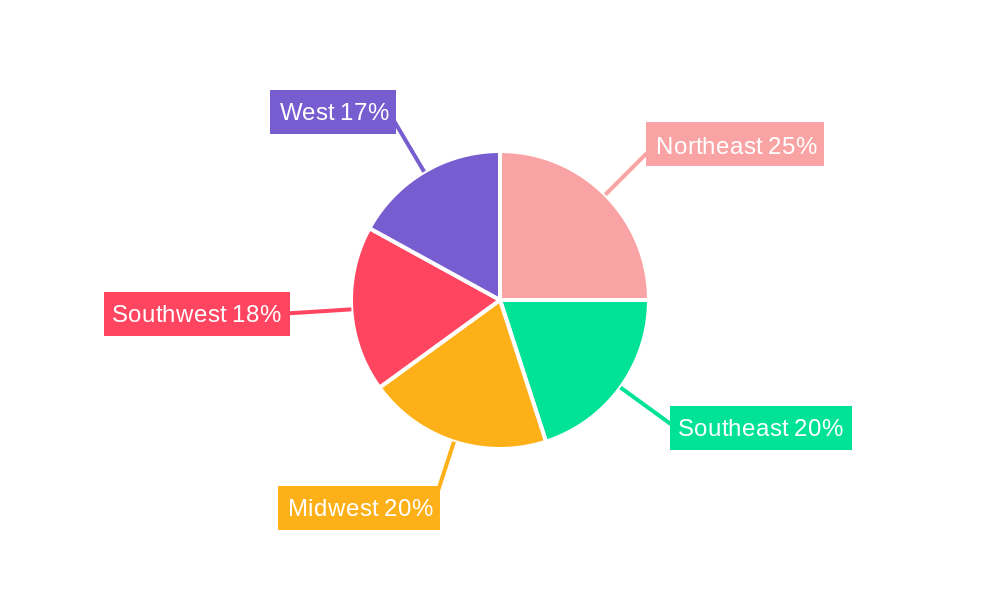
Growth is expected to remain consistent, mirroring national economic trends. The market's segmentation by product type (refrigerators, freezers, etc.) reflects consumer preferences and purchasing power. Refrigerators and freezers consistently maintain high demand due to their essential nature, while the growth of air conditioners and dishwashers is linked to rising household incomes and changing lifestyles. Regional variations in growth exist, with higher concentrations in densely populated areas and regions with a strong housing market. The Northeast and West regions, known for higher average incomes and a preference for advanced technology, likely exhibit stronger growth compared to other regions. The forecast period (2025-2033) suggests a continued upward trajectory, with the CAGR of 2.93% indicating sustained, albeit moderate, expansion. Long-term market prospects remain positive, contingent on economic stability and evolving consumer demands.
US Home Appliance Industry Company Market Share
US Home Appliance Industry Market Report: 2019-2033
This comprehensive report provides an in-depth analysis of the US home appliance industry, covering market dynamics, growth trends, key players, and future outlook. With a focus on key segments like refrigerators, washing machines, and dishwashers, and distribution channels including multi-branded stores and online retailers, this report is essential for industry professionals, investors, and anyone seeking to understand this dynamic market. The study period spans 2019-2033, with a base year of 2025 and a forecast period of 2025-2033. Market size is presented in Million units.
US Home Appliance Industry Market Dynamics & Structure
This section analyzes the competitive landscape of the US home appliance market, examining market concentration, technological advancements, regulatory influences, and strategic activities. The report delves into the impact of substitute products, evolving consumer demographics, and mergers & acquisitions (M&A) trends. Quantitative data, including market share percentages and M&A deal volumes, will be presented alongside qualitative factors such as barriers to innovation.
- Market Concentration: Analysis of market share held by key players like Whirlpool Corporation, Samsung Electronics, LG Electronics, and others. (e.g., Whirlpool holds xx% market share in 2024, while Samsung holds xx%).
- Technological Innovation: Examination of key technological drivers such as smart home integration, energy efficiency improvements, and advanced materials. Discussion of innovation barriers, including R&D costs and regulatory compliance.
- Regulatory Framework: Assessment of relevant federal and state regulations impacting appliance manufacturing, safety standards, and energy efficiency mandates.
- Competitive Substitutes: Analysis of alternative product categories or technologies that compete with traditional home appliances.
- End-User Demographics: Exploration of changing consumer preferences, purchasing power, and lifestyle trends impacting demand for home appliances.
- M&A Trends: Review of significant M&A activity within the industry, including deal volumes and strategic rationale behind the transactions. (e.g., xx M&A deals were observed between 2019-2024).
US Home Appliance Industry Growth Trends & Insights
This section offers a detailed analysis of the US home appliance market's growth trajectory, leveraging proprietary data and market research to provide comprehensive insights into market size evolution, adoption rates, technological disruptions, and shifts in consumer behavior. Specific metrics such as Compound Annual Growth Rate (CAGR) and market penetration rates will be presented.
(600-word analysis based on proprietary data and market research)
Dominant Regions, Countries, or Segments in US Home Appliance Industry
This section pinpoints the leading regions, states, or segments (by product type – Refrigerators, Freezers, Air-conditioners, Dishwashers, Washing Machines, Ovens – and by distribution channel – Multi-Branded Stores, Exclusive Brand Outlets, Online) driving market growth within the US. Key drivers, including economic factors and infrastructure, are highlighted using bullet points, while paragraphs analyze dominance factors such as market share and growth potential.
- Leading Segments: Identification of the highest-performing product categories based on market share and growth rate (e.g., Refrigerators hold xx% market share and are projected to grow at xx% CAGR).
- Distribution Channel Analysis: Evaluation of the performance of different distribution channels, highlighting the most successful based on sales volume and growth projections (e.g., Online sales are projected to increase by xx% by 2033).
- Regional Variations: Analysis of regional discrepancies in market growth, consumer preferences, and economic factors.
(600-word analysis with bullet points and paragraphs)
US Home Appliance Industry Product Landscape
This section provides a concise overview of product innovations, applications, and performance metrics within the US home appliance industry. It highlights the unique selling propositions and technological advancements driving product differentiation and consumer appeal. Discussion of smart appliance features, energy efficiency ratings, and design innovations will be included.
(100-150 words)
Key Drivers, Barriers & Challenges in US Home Appliance Industry
This section identifies the key factors driving market growth, including technological advancements, economic conditions, and supportive government policies. It also examines challenges and restraints, such as supply chain disruptions, regulatory hurdles, and competitive pressures, presenting quantifiable impacts wherever possible.
Key Drivers:
- Technological advancements (e.g., smart home integration, energy efficiency).
- Rising disposable incomes and improved living standards.
- Favorable government policies and incentives.
Key Barriers & Challenges:
- Supply chain disruptions and raw material price volatility.
- Stringent environmental regulations and compliance costs.
- Intense competition from both domestic and international players. (e.g., Increased competition from xx% of imported appliances).
(150 words each for drivers and challenges)
Emerging Opportunities in US Home Appliance Industry
This section highlights emerging trends and growth opportunities, focusing on untapped markets, innovative applications, and evolving consumer preferences. This includes exploring the potential of niche markets, such as eco-friendly appliances, customizable options, and subscription-based service models.
(150 words)
Growth Accelerators in the US Home Appliance Industry Industry
This section examines the catalysts expected to drive long-term growth within the industry, including technological breakthroughs, strategic partnerships, and expansion strategies. It will explore the potential for expansion into underserved markets and the development of new product categories.
(150 words)
Key Players Shaping the US Home Appliance Industry Market
Notable Milestones in US Home Appliance Industry Sector
- April 2023: Haier launched an innovative super drum washing machine with intelligent voice control, enhancing its product portfolio and market competitiveness.
- November 2022: Lowe's partnership with Miele expanded its premium appliance offerings, catering to a higher-end consumer segment.
In-Depth US Home Appliance Industry Market Outlook
This section summarizes the key growth drivers and future potential of the US home appliance market, focusing on strategic opportunities for businesses and investors. It examines the long-term prospects for market expansion, technological innovation, and changing consumer demands. The report highlights the potential for increased market penetration in underserved segments and the emergence of new product categories and technologies.
(150 words)
US Home Appliance Industry Segmentation
-
1. Product
- 1.1. Refrigerators
- 1.2. Freezers
- 1.3. Air-conditioners
- 1.4. Dishwashers
- 1.5. Washing Machines
- 1.6. Ovens
-
2. Distribution Channel
- 2.1. Multi-Branded Stores
- 2.2. Exclusive Brand Outlets
- 2.3. Online
US Home Appliance Industry Segmentation By Geography
-
1. North America
- 1.1. United States
- 1.2. Canada
- 1.3. Mexico
-
2. South America
- 2.1. Brazil
- 2.2. Argentina
- 2.3. Rest of South America
-
3. Europe
- 3.1. United Kingdom
- 3.2. Germany
- 3.3. France
- 3.4. Italy
- 3.5. Spain
- 3.6. Russia
- 3.7. Benelux
- 3.8. Nordics
- 3.9. Rest of Europe
-
4. Middle East & Africa
- 4.1. Turkey
- 4.2. Israel
- 4.3. GCC
- 4.4. North Africa
- 4.5. South Africa
- 4.6. Rest of Middle East & Africa
-
5. Asia Pacific
- 5.1. China
- 5.2. India
- 5.3. Japan
- 5.4. South Korea
- 5.5. ASEAN
- 5.6. Oceania
- 5.7. Rest of Asia Pacific
US Home Appliance Industry Regional Market Share
Geographic Coverage of US Home Appliance Industry
US Home Appliance Industry REPORT HIGHLIGHTS
| Aspects | Details |
|---|---|
| Study Period | 2020-2034 |
| Base Year | 2025 |
| Estimated Year | 2026 |
| Forecast Period | 2026-2034 |
| Historical Period | 2020-2025 |
| Growth Rate | CAGR of 2.93% from 2020-2034 |
| Segmentation |
|
Table of Contents
- 1. Introduction
- 1.1. Research Scope
- 1.2. Market Segmentation
- 1.3. Research Objective
- 1.4. Definitions and Assumptions
- 2. Executive Summary
- 2.1. Market Snapshot
- 3. Market Dynamics
- 3.1. Market Drivers
- 3.2. Market Restrains
- 3.3. Market Trends
- 3.4. Market Opportunities
- 4. Market Factor Analysis
- 4.1. Porters Five Forces
- 4.1.1. Bargaining Power of Suppliers
- 4.1.2. Bargaining Power of Buyers
- 4.1.3. Threat of New Entrants
- 4.1.4. Threat of Substitutes
- 4.1.5. Competitive Rivalry
- 4.2. PESTEL analysis
- 4.3. BCG Analysis
- 4.3.1. Stars (High Growth, High Market Share)
- 4.3.2. Cash Cows (Low Growth, High Market Share)
- 4.3.3. Question Mark (High Growth, Low Market Share)
- 4.3.4. Dogs (Low Growth, Low Market Share)
- 4.4. Ansoff Matrix Analysis
- 4.5. Supply Chain Analysis
- 4.6. Regulatory Landscape
- 4.7. Current Market Potential and Opportunity Assessment (TAM–SAM–SOM Framework)
- 4.8. IMR Analyst Note
- 4.1. Porters Five Forces
- 5. Market Analysis, Insights and Forecast 2021-2033
- 5.1. Market Analysis, Insights and Forecast - by Product
- 5.1.1. Refrigerators
- 5.1.2. Freezers
- 5.1.3. Air-conditioners
- 5.1.4. Dishwashers
- 5.1.5. Washing Machines
- 5.1.6. Ovens
- 5.2. Market Analysis, Insights and Forecast - by Distribution Channel
- 5.2.1. Multi-Branded Stores
- 5.2.2. Exclusive Brand Outlets
- 5.2.3. Online
- 5.3. Market Analysis, Insights and Forecast - by Region
- 5.3.1. North America
- 5.3.2. South America
- 5.3.3. Europe
- 5.3.4. Middle East & Africa
- 5.3.5. Asia Pacific
- 5.1. Market Analysis, Insights and Forecast - by Product
- 6. Global US Home Appliance Industry Analysis, Insights and Forecast, 2021-2033
- 6.1. Market Analysis, Insights and Forecast - by Product
- 6.1.1. Refrigerators
- 6.1.2. Freezers
- 6.1.3. Air-conditioners
- 6.1.4. Dishwashers
- 6.1.5. Washing Machines
- 6.1.6. Ovens
- 6.2. Market Analysis, Insights and Forecast - by Distribution Channel
- 6.2.1. Multi-Branded Stores
- 6.2.2. Exclusive Brand Outlets
- 6.2.3. Online
- 6.1. Market Analysis, Insights and Forecast - by Product
- 7. North America US Home Appliance Industry Analysis, Insights and Forecast, 2020-2032
- 7.1. Market Analysis, Insights and Forecast - by Product
- 7.1.1. Refrigerators
- 7.1.2. Freezers
- 7.1.3. Air-conditioners
- 7.1.4. Dishwashers
- 7.1.5. Washing Machines
- 7.1.6. Ovens
- 7.2. Market Analysis, Insights and Forecast - by Distribution Channel
- 7.2.1. Multi-Branded Stores
- 7.2.2. Exclusive Brand Outlets
- 7.2.3. Online
- 7.1. Market Analysis, Insights and Forecast - by Product
- 8. South America US Home Appliance Industry Analysis, Insights and Forecast, 2020-2032
- 8.1. Market Analysis, Insights and Forecast - by Product
- 8.1.1. Refrigerators
- 8.1.2. Freezers
- 8.1.3. Air-conditioners
- 8.1.4. Dishwashers
- 8.1.5. Washing Machines
- 8.1.6. Ovens
- 8.2. Market Analysis, Insights and Forecast - by Distribution Channel
- 8.2.1. Multi-Branded Stores
- 8.2.2. Exclusive Brand Outlets
- 8.2.3. Online
- 8.1. Market Analysis, Insights and Forecast - by Product
- 9. Europe US Home Appliance Industry Analysis, Insights and Forecast, 2020-2032
- 9.1. Market Analysis, Insights and Forecast - by Product
- 9.1.1. Refrigerators
- 9.1.2. Freezers
- 9.1.3. Air-conditioners
- 9.1.4. Dishwashers
- 9.1.5. Washing Machines
- 9.1.6. Ovens
- 9.2. Market Analysis, Insights and Forecast - by Distribution Channel
- 9.2.1. Multi-Branded Stores
- 9.2.2. Exclusive Brand Outlets
- 9.2.3. Online
- 9.1. Market Analysis, Insights and Forecast - by Product
- 10. Middle East & Africa US Home Appliance Industry Analysis, Insights and Forecast, 2020-2032
- 10.1. Market Analysis, Insights and Forecast - by Product
- 10.1.1. Refrigerators
- 10.1.2. Freezers
- 10.1.3. Air-conditioners
- 10.1.4. Dishwashers
- 10.1.5. Washing Machines
- 10.1.6. Ovens
- 10.2. Market Analysis, Insights and Forecast - by Distribution Channel
- 10.2.1. Multi-Branded Stores
- 10.2.2. Exclusive Brand Outlets
- 10.2.3. Online
- 10.1. Market Analysis, Insights and Forecast - by Product
- 11. Asia Pacific US Home Appliance Industry Analysis, Insights and Forecast, 2020-2032
- 11.1. Market Analysis, Insights and Forecast - by Product
- 11.1.1. Refrigerators
- 11.1.2. Freezers
- 11.1.3. Air-conditioners
- 11.1.4. Dishwashers
- 11.1.5. Washing Machines
- 11.1.6. Ovens
- 11.2. Market Analysis, Insights and Forecast - by Distribution Channel
- 11.2.1. Multi-Branded Stores
- 11.2.2. Exclusive Brand Outlets
- 11.2.3. Online
- 11.1. Market Analysis, Insights and Forecast - by Product
- 12. Competitive Analysis
- 12.1. Company Profiles
- 12.1.1 Whirlpool Corporation
- 12.1.1.1. Company Overview
- 12.1.1.2. Products
- 12.1.1.3. Company Financials
- 12.1.1.4. SWOT Analysis
- 12.1.2 Samsung Electronics
- 12.1.2.1. Company Overview
- 12.1.2.2. Products
- 12.1.2.3. Company Financials
- 12.1.2.4. SWOT Analysis
- 12.1.3 Gorenje Group
- 12.1.3.1. Company Overview
- 12.1.3.2. Products
- 12.1.3.3. Company Financials
- 12.1.3.4. SWOT Analysis
- 12.1.4 Midea Group
- 12.1.4.1. Company Overview
- 12.1.4.2. Products
- 12.1.4.3. Company Financials
- 12.1.4.4. SWOT Analysis
- 12.1.5 Haier Group
- 12.1.5.1. Company Overview
- 12.1.5.2. Products
- 12.1.5.3. Company Financials
- 12.1.5.4. SWOT Analysis
- 12.1.6 Bosch
- 12.1.6.1. Company Overview
- 12.1.6.2. Products
- 12.1.6.3. Company Financials
- 12.1.6.4. SWOT Analysis
- 12.1.7 Arcelik AS**List Not Exhaustive
- 12.1.7.1. Company Overview
- 12.1.7.2. Products
- 12.1.7.3. Company Financials
- 12.1.7.4. SWOT Analysis
- 12.1.8 Electrolux AB
- 12.1.8.1. Company Overview
- 12.1.8.2. Products
- 12.1.8.3. Company Financials
- 12.1.8.4. SWOT Analysis
- 12.1.9 Panasonic Corporation
- 12.1.9.1. Company Overview
- 12.1.9.2. Products
- 12.1.9.3. Company Financials
- 12.1.9.4. SWOT Analysis
- 12.1.10 LG Electronics
- 12.1.10.1. Company Overview
- 12.1.10.2. Products
- 12.1.10.3. Company Financials
- 12.1.10.4. SWOT Analysis
- 12.1.1 Whirlpool Corporation
- 12.2. Market Entropy
- 12.2.1 Company's Key Areas Served
- 12.2.2 Recent Developments
- 12.3. Company Market Share Analysis 2025
- 12.3.1 Top 5 Companies Market Share Analysis
- 12.3.2 Top 3 Companies Market Share Analysis
- 12.4. List of Potential Customers
- 13. Research Methodology
List of Figures
- Figure 1: Global US Home Appliance Industry Revenue Breakdown (Million, %) by Region 2025 & 2033
- Figure 2: North America US Home Appliance Industry Revenue (Million), by Product 2025 & 2033
- Figure 3: North America US Home Appliance Industry Revenue Share (%), by Product 2025 & 2033
- Figure 4: North America US Home Appliance Industry Revenue (Million), by Distribution Channel 2025 & 2033
- Figure 5: North America US Home Appliance Industry Revenue Share (%), by Distribution Channel 2025 & 2033
- Figure 6: North America US Home Appliance Industry Revenue (Million), by Country 2025 & 2033
- Figure 7: North America US Home Appliance Industry Revenue Share (%), by Country 2025 & 2033
- Figure 8: South America US Home Appliance Industry Revenue (Million), by Product 2025 & 2033
- Figure 9: South America US Home Appliance Industry Revenue Share (%), by Product 2025 & 2033
- Figure 10: South America US Home Appliance Industry Revenue (Million), by Distribution Channel 2025 & 2033
- Figure 11: South America US Home Appliance Industry Revenue Share (%), by Distribution Channel 2025 & 2033
- Figure 12: South America US Home Appliance Industry Revenue (Million), by Country 2025 & 2033
- Figure 13: South America US Home Appliance Industry Revenue Share (%), by Country 2025 & 2033
- Figure 14: Europe US Home Appliance Industry Revenue (Million), by Product 2025 & 2033
- Figure 15: Europe US Home Appliance Industry Revenue Share (%), by Product 2025 & 2033
- Figure 16: Europe US Home Appliance Industry Revenue (Million), by Distribution Channel 2025 & 2033
- Figure 17: Europe US Home Appliance Industry Revenue Share (%), by Distribution Channel 2025 & 2033
- Figure 18: Europe US Home Appliance Industry Revenue (Million), by Country 2025 & 2033
- Figure 19: Europe US Home Appliance Industry Revenue Share (%), by Country 2025 & 2033
- Figure 20: Middle East & Africa US Home Appliance Industry Revenue (Million), by Product 2025 & 2033
- Figure 21: Middle East & Africa US Home Appliance Industry Revenue Share (%), by Product 2025 & 2033
- Figure 22: Middle East & Africa US Home Appliance Industry Revenue (Million), by Distribution Channel 2025 & 2033
- Figure 23: Middle East & Africa US Home Appliance Industry Revenue Share (%), by Distribution Channel 2025 & 2033
- Figure 24: Middle East & Africa US Home Appliance Industry Revenue (Million), by Country 2025 & 2033
- Figure 25: Middle East & Africa US Home Appliance Industry Revenue Share (%), by Country 2025 & 2033
- Figure 26: Asia Pacific US Home Appliance Industry Revenue (Million), by Product 2025 & 2033
- Figure 27: Asia Pacific US Home Appliance Industry Revenue Share (%), by Product 2025 & 2033
- Figure 28: Asia Pacific US Home Appliance Industry Revenue (Million), by Distribution Channel 2025 & 2033
- Figure 29: Asia Pacific US Home Appliance Industry Revenue Share (%), by Distribution Channel 2025 & 2033
- Figure 30: Asia Pacific US Home Appliance Industry Revenue (Million), by Country 2025 & 2033
- Figure 31: Asia Pacific US Home Appliance Industry Revenue Share (%), by Country 2025 & 2033
List of Tables
- Table 1: Global US Home Appliance Industry Revenue Million Forecast, by Product 2020 & 2033
- Table 2: Global US Home Appliance Industry Revenue Million Forecast, by Distribution Channel 2020 & 2033
- Table 3: Global US Home Appliance Industry Revenue Million Forecast, by Region 2020 & 2033
- Table 4: Global US Home Appliance Industry Revenue Million Forecast, by Product 2020 & 2033
- Table 5: Global US Home Appliance Industry Revenue Million Forecast, by Distribution Channel 2020 & 2033
- Table 6: Global US Home Appliance Industry Revenue Million Forecast, by Country 2020 & 2033
- Table 7: United States US Home Appliance Industry Revenue (Million) Forecast, by Application 2020 & 2033
- Table 8: Canada US Home Appliance Industry Revenue (Million) Forecast, by Application 2020 & 2033
- Table 9: Mexico US Home Appliance Industry Revenue (Million) Forecast, by Application 2020 & 2033
- Table 10: Global US Home Appliance Industry Revenue Million Forecast, by Product 2020 & 2033
- Table 11: Global US Home Appliance Industry Revenue Million Forecast, by Distribution Channel 2020 & 2033
- Table 12: Global US Home Appliance Industry Revenue Million Forecast, by Country 2020 & 2033
- Table 13: Brazil US Home Appliance Industry Revenue (Million) Forecast, by Application 2020 & 2033
- Table 14: Argentina US Home Appliance Industry Revenue (Million) Forecast, by Application 2020 & 2033
- Table 15: Rest of South America US Home Appliance Industry Revenue (Million) Forecast, by Application 2020 & 2033
- Table 16: Global US Home Appliance Industry Revenue Million Forecast, by Product 2020 & 2033
- Table 17: Global US Home Appliance Industry Revenue Million Forecast, by Distribution Channel 2020 & 2033
- Table 18: Global US Home Appliance Industry Revenue Million Forecast, by Country 2020 & 2033
- Table 19: United Kingdom US Home Appliance Industry Revenue (Million) Forecast, by Application 2020 & 2033
- Table 20: Germany US Home Appliance Industry Revenue (Million) Forecast, by Application 2020 & 2033
- Table 21: France US Home Appliance Industry Revenue (Million) Forecast, by Application 2020 & 2033
- Table 22: Italy US Home Appliance Industry Revenue (Million) Forecast, by Application 2020 & 2033
- Table 23: Spain US Home Appliance Industry Revenue (Million) Forecast, by Application 2020 & 2033
- Table 24: Russia US Home Appliance Industry Revenue (Million) Forecast, by Application 2020 & 2033
- Table 25: Benelux US Home Appliance Industry Revenue (Million) Forecast, by Application 2020 & 2033
- Table 26: Nordics US Home Appliance Industry Revenue (Million) Forecast, by Application 2020 & 2033
- Table 27: Rest of Europe US Home Appliance Industry Revenue (Million) Forecast, by Application 2020 & 2033
- Table 28: Global US Home Appliance Industry Revenue Million Forecast, by Product 2020 & 2033
- Table 29: Global US Home Appliance Industry Revenue Million Forecast, by Distribution Channel 2020 & 2033
- Table 30: Global US Home Appliance Industry Revenue Million Forecast, by Country 2020 & 2033
- Table 31: Turkey US Home Appliance Industry Revenue (Million) Forecast, by Application 2020 & 2033
- Table 32: Israel US Home Appliance Industry Revenue (Million) Forecast, by Application 2020 & 2033
- Table 33: GCC US Home Appliance Industry Revenue (Million) Forecast, by Application 2020 & 2033
- Table 34: North Africa US Home Appliance Industry Revenue (Million) Forecast, by Application 2020 & 2033
- Table 35: South Africa US Home Appliance Industry Revenue (Million) Forecast, by Application 2020 & 2033
- Table 36: Rest of Middle East & Africa US Home Appliance Industry Revenue (Million) Forecast, by Application 2020 & 2033
- Table 37: Global US Home Appliance Industry Revenue Million Forecast, by Product 2020 & 2033
- Table 38: Global US Home Appliance Industry Revenue Million Forecast, by Distribution Channel 2020 & 2033
- Table 39: Global US Home Appliance Industry Revenue Million Forecast, by Country 2020 & 2033
- Table 40: China US Home Appliance Industry Revenue (Million) Forecast, by Application 2020 & 2033
- Table 41: India US Home Appliance Industry Revenue (Million) Forecast, by Application 2020 & 2033
- Table 42: Japan US Home Appliance Industry Revenue (Million) Forecast, by Application 2020 & 2033
- Table 43: South Korea US Home Appliance Industry Revenue (Million) Forecast, by Application 2020 & 2033
- Table 44: ASEAN US Home Appliance Industry Revenue (Million) Forecast, by Application 2020 & 2033
- Table 45: Oceania US Home Appliance Industry Revenue (Million) Forecast, by Application 2020 & 2033
- Table 46: Rest of Asia Pacific US Home Appliance Industry Revenue (Million) Forecast, by Application 2020 & 2033
Frequently Asked Questions
1. What is the projected Compound Annual Growth Rate (CAGR) of the US Home Appliance Industry?
The projected CAGR is approximately 2.93%.
2. Which companies are prominent players in the US Home Appliance Industry?
Key companies in the market include Whirlpool Corporation, Samsung Electronics, Gorenje Group, Midea Group, Haier Group, Bosch, Arcelik AS**List Not Exhaustive, Electrolux AB, Panasonic Corporation, LG Electronics.
3. What are the main segments of the US Home Appliance Industry?
The market segments include Product, Distribution Channel.
4. Can you provide details about the market size?
The market size is estimated to be USD 33.44 Million as of 2022.
5. What are some drivers contributing to market growth?
Shifts in Consumer Preferences and Lifestyle Changes Drives the Market's Growth; Demand for Time Saving Solutions Drives the Market's Growth.
6. What are the notable trends driving market growth?
Increased Adoption of Multi and Advanced Products Driving the Market for Major Home Appliances.
7. Are there any restraints impacting market growth?
Supply Chain Disruptions; High Cost of Maintenance4.3.2.1; Market Oppurtunities4.; Technological Advancements in Major Home Appliances.
8. Can you provide examples of recent developments in the market?
April 2023: Haier launched an innovative super drum washing machine with intelligent voice control, and the excellent drum ensures effective washing performance.
9. What pricing options are available for accessing the report?
Pricing options include single-user, multi-user, and enterprise licenses priced at USD 3800, USD 4500, and USD 5800 respectively.
10. Is the market size provided in terms of value or volume?
The market size is provided in terms of value, measured in Million.
11. Are there any specific market keywords associated with the report?
Yes, the market keyword associated with the report is "US Home Appliance Industry," which aids in identifying and referencing the specific market segment covered.
12. How do I determine which pricing option suits my needs best?
The pricing options vary based on user requirements and access needs. Individual users may opt for single-user licenses, while businesses requiring broader access may choose multi-user or enterprise licenses for cost-effective access to the report.
13. Are there any additional resources or data provided in the US Home Appliance Industry report?
While the report offers comprehensive insights, it's advisable to review the specific contents or supplementary materials provided to ascertain if additional resources or data are available.
14. How can I stay updated on further developments or reports in the US Home Appliance Industry?
To stay informed about further developments, trends, and reports in the US Home Appliance Industry, consider subscribing to industry newsletters, following relevant companies and organizations, or regularly checking reputable industry news sources and publications.
Methodology
Step 1 - Identification of Relevant Samples Size from Population Database


Step 2 - Approaches for Defining Global Market Size (Value, Volume* & Price*)

Note*: In applicable scenarios
Step 3 - Data Sources
Primary Research
- Web Analytics
- Survey Reports
- Research Institute
- Latest Research Reports
- Opinion Leaders
Secondary Research
- Annual Reports
- White Paper
- Latest Press Release
- Industry Association
- Paid Database
- Investor Presentations

Step 4 - Data Triangulation
Involves using different sources of information in order to increase the validity of a study
These sources are likely to be stakeholders in a program - participants, other researchers, program staff, other community members, and so on.
Then we put all data in single framework & apply various statistical tools to find out the dynamic on the market.
During the analysis stage, feedback from the stakeholder groups would be compared to determine areas of agreement as well as areas of divergence