

Key Insights
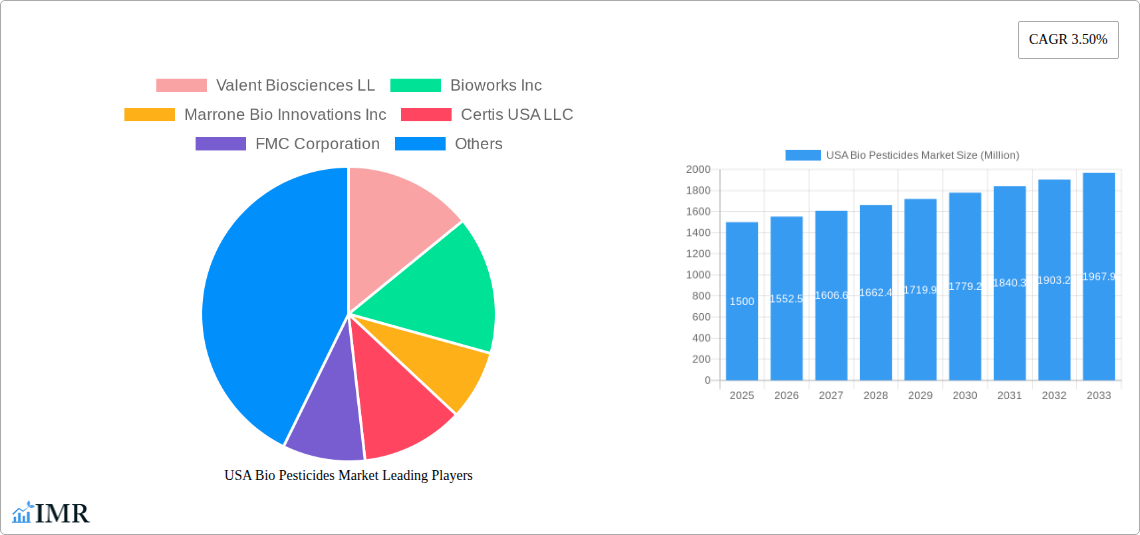
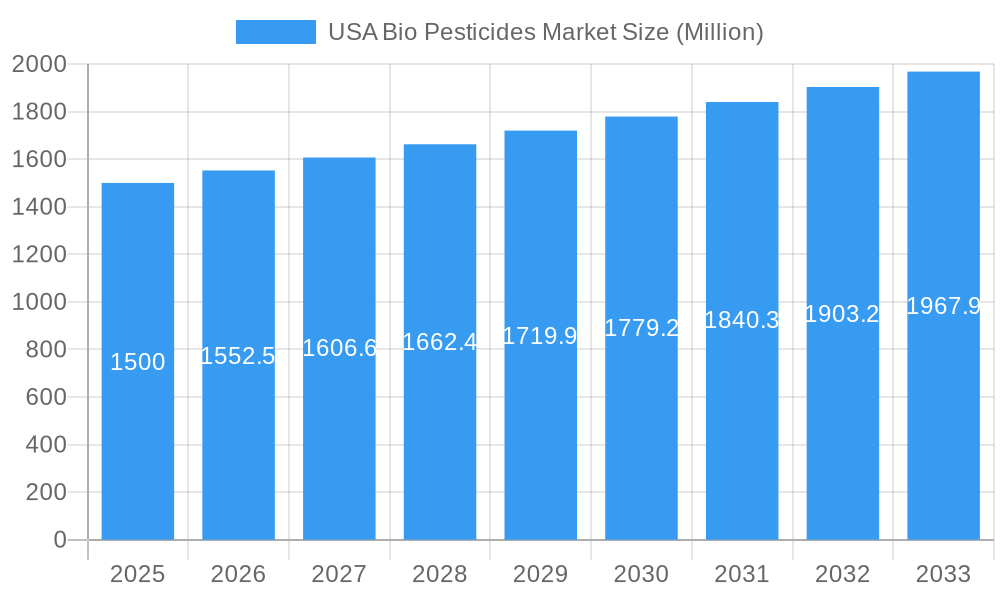
The United States biopesticides market, valued at approximately $1.5 billion in 2025, is projected to experience robust growth, driven by increasing consumer demand for sustainable agriculture and stricter regulations on synthetic pesticides. A compound annual growth rate (CAGR) of 3.5% from 2025 to 2033 indicates a market size exceeding $2.2 billion by 2033. This growth is fueled by several key factors. The rising awareness of the environmental and health risks associated with conventional pesticides is pushing farmers and consumers towards eco-friendly alternatives. Government initiatives promoting sustainable agriculture practices and supporting the development and adoption of biopesticides further bolster market expansion. Segment-wise, bioinsecticides currently hold a significant share, followed by biofungicides, reflecting the prevalent need for pest and disease control in various crops. Cash crops, due to their high economic value and susceptibility to pests and diseases, are a major driver of biopesticide consumption. Key players like Valent Biosciences, Bioworks, and Marrone Bio Innovations are investing heavily in research and development to enhance product efficacy and expand their market reach. The Midwest and West regions, with their extensive agricultural lands, are expected to witness significant growth, while the Northeast and Southeast regions will contribute steadily due to their diverse cropping systems. However, factors such as higher initial costs compared to conventional pesticides and concerns regarding efficacy in certain situations pose challenges to market penetration.
USA Bio Pesticides Market Market Size (In Billion)
The competitive landscape is characterized by a mix of established players and emerging biotech companies. Established players benefit from extensive distribution networks and brand recognition, while innovative startups offer specialized biopesticide solutions. The market is seeing increased mergers and acquisitions, collaborations, and strategic partnerships, signifying consolidation and further innovation within the sector. Looking ahead, the market's trajectory suggests a continued shift towards biopesticides as a crucial component of integrated pest management (IPM) strategies, aligning with global sustainability goals and consumer preferences. Technological advancements in biopesticide formulation and delivery systems are poised to enhance their effectiveness and market acceptance. The focus on precision agriculture techniques will further propel the adoption of these eco-friendly solutions in various agricultural settings.
USA Bio Pesticides Market Company Market Share
USA Bio Pesticides Market: A Comprehensive Market Report (2019-2033)
This in-depth report provides a comprehensive analysis of the USA Bio Pesticides Market, encompassing market dynamics, growth trends, leading segments, and key players. The study period covers 2019-2033, with 2025 as the base year and a forecast period of 2025-2033. The report is essential for industry professionals, investors, and researchers seeking a detailed understanding of this rapidly evolving market, valued at xx Million USD in 2025.
USA Bio Pesticides Market Market Dynamics & Structure
The USA Bio Pesticides Market is characterized by moderate concentration, with key players like Valent Biosciences LL, Bioworks Inc, and Corteva Agriscience holding significant market share. Technological innovation, driven by the need for sustainable and effective pest control solutions, is a major growth driver. Stringent regulatory frameworks, including EPA guidelines, shape product development and market access. Biopesticides are increasingly viewed as a safer alternative to chemical pesticides, fueled by growing consumer awareness and demand for organic produce. However, higher initial costs compared to chemical pesticides and efficacy concerns in certain applications present challenges. The market is witnessing increased M&A activity, with deals focused on expanding product portfolios and technological capabilities. For example, the xx Million USD acquisition of Symborg by Corteva Agriscience in September 2022 demonstrates this trend.
- Market Concentration: Moderately concentrated, with top 5 players holding xx% market share in 2025.
- Technological Innovation: Focus on enhanced efficacy, targeted delivery systems, and novel formulations.
- Regulatory Landscape: Stringent EPA regulations impacting product registration and market entry.
- Competitive Substitutes: Chemical pesticides remain a major competitive pressure.
- End-User Demographics: Growing demand from organic farming and environmentally conscious consumers.
- M&A Trends: Increasing consolidation through acquisitions and strategic partnerships to expand market reach.
USA Bio Pesticides Market Growth Trends & Insights
The USA Bio Pesticides Market is experiencing robust growth, driven by increasing consumer preference for organically grown produce, stringent regulations on chemical pesticides, and growing awareness of environmental sustainability. The market size expanded from xx Million USD in 2019 to xx Million USD in 2024, exhibiting a CAGR of xx% during the historical period. The market is projected to reach xx Million USD by 2033, showcasing continued strong growth momentum. This growth is further fueled by technological advancements leading to the development of more effective and targeted biopesticides. Shifting consumer behaviors, favoring sustainable agricultural practices, contribute to the increased adoption rate of biopesticides across various crop types. Market penetration is expected to reach xx% by 2033.
Dominant Regions, Countries, or Segments in USA Bio Pesticides Market
The California region holds the largest market share, due to its prominent agricultural sector and strong emphasis on organic farming. Within the crop type segment, Cash Crops dominates, driven by high market demand and economic profitability. The Bioinsecticides segment exhibits the highest growth potential, with increasing focus on effective pest management solutions.
- Leading Region: California, driven by its extensive agricultural industry and organic farming practices.
- Dominant Crop Type: Cash Crops, due to high market demand and economic viability.
- Fastest-Growing Segment: Bioinsecticides, fueled by the need for effective and sustainable pest management.
- Key Drivers: Strong consumer demand for organic produce, government support for sustainable agriculture, and technological advancements.
USA Bio Pesticides Market Product Landscape
The market offers a diverse range of biopesticides, encompassing biofungicides, bioherbicides, bioinsecticides, and other specialized formulations. Product innovation focuses on improving efficacy, targeted delivery mechanisms, and reduced environmental impact. Unique selling propositions include enhanced bioactivity, reduced pesticide residues, and minimized risks to beneficial organisms. Technological advancements are centered around targeted gene editing, enhanced fermentation processes, and improved formulation technologies.
Key Drivers, Barriers & Challenges in USA Bio Pesticides Market
Key Drivers:
- Growing consumer preference for organic and sustainably produced food.
- Increasing regulatory pressure on synthetic pesticide use.
- Rising awareness of the environmental impact of conventional pesticides.
- Technological advancements leading to improved efficacy and cost-effectiveness of biopesticides.
Key Challenges:
- Higher cost compared to synthetic pesticides.
- Efficacy concerns in certain situations.
- Regulatory hurdles and complex approval processes.
- Potential supply chain bottlenecks and limited availability of certain biopesticides.
Emerging Opportunities in USA Bio Pesticides Market
- Untapped markets in specialty crops and niche agricultural segments.
- Growing demand for biopesticides in greenhouse and indoor farming.
- Development of novel biopesticides with enhanced efficacy and broader spectrum activity.
- Integration of biopesticides with precision agriculture technologies.
Growth Accelerators in the USA Bio Pesticides Market Industry
Strategic partnerships between biopesticide manufacturers and agricultural companies are accelerating market growth. Technological breakthroughs such as CRISPR-Cas9 gene editing are improving biopesticide efficacy. Government initiatives promoting sustainable agriculture and reducing synthetic pesticide use are creating favorable market conditions. Expansion into new geographic regions and untapped market segments is further driving growth.
Key Players Shaping the USA Bio Pesticides Market Market
- Valent Biosciences LL
- Bioworks Inc
- Marrone Bio Innovations Inc
- Certis USA LLC
- FMC Corporation
- Andermatt Group AG
- Indogulf BioAg LLC (Biotech Division of Indogulf Company)
- Corteva Agriscience
- Terramera Inc
- Lallemand Inc
Notable Milestones in USA Bio Pesticides Market Sector
- June 2022: Certis Biologicals and Novozymes collaborate to develop new technologies for fungal disease control in row crops.
- June 2022: Valent BioSciences LLC expands its biorational manufacturing facility to meet rising demand.
- September 2022: Corteva Agriscience acquires Symborg to strengthen its biologicals portfolio.
In-Depth USA Bio Pesticides Market Market Outlook
The USA Bio Pesticides Market is poised for continued strong growth, driven by a confluence of factors including increasing consumer demand for organic products, supportive government policies, and technological advancements. Strategic investments in research and development, coupled with strategic partnerships, will further propel market expansion. Untapped market segments and emerging applications will present significant opportunities for market players in the coming years.
USA Bio Pesticides Market Segmentation
- 1. Production Analysis
- 2. Consumption Analysis
- 3. Import Market Analysis (Value & Volume)
- 4. Export Market Analysis (Value & Volume)
- 5. Price Trend Analysis
USA Bio Pesticides Market Segmentation By Geography
-
1. North America
- 1.1. United States
- 1.2. Canada
- 1.3. Mexico
-
2. South America
- 2.1. Brazil
- 2.2. Argentina
- 2.3. Rest of South America
-
3. Europe
- 3.1. United Kingdom
- 3.2. Germany
- 3.3. France
- 3.4. Italy
- 3.5. Spain
- 3.6. Russia
- 3.7. Benelux
- 3.8. Nordics
- 3.9. Rest of Europe
-
4. Middle East & Africa
- 4.1. Turkey
- 4.2. Israel
- 4.3. GCC
- 4.4. North Africa
- 4.5. South Africa
- 4.6. Rest of Middle East & Africa
-
5. Asia Pacific
- 5.1. China
- 5.2. India
- 5.3. Japan
- 5.4. South Korea
- 5.5. ASEAN
- 5.6. Oceania
- 5.7. Rest of Asia Pacific
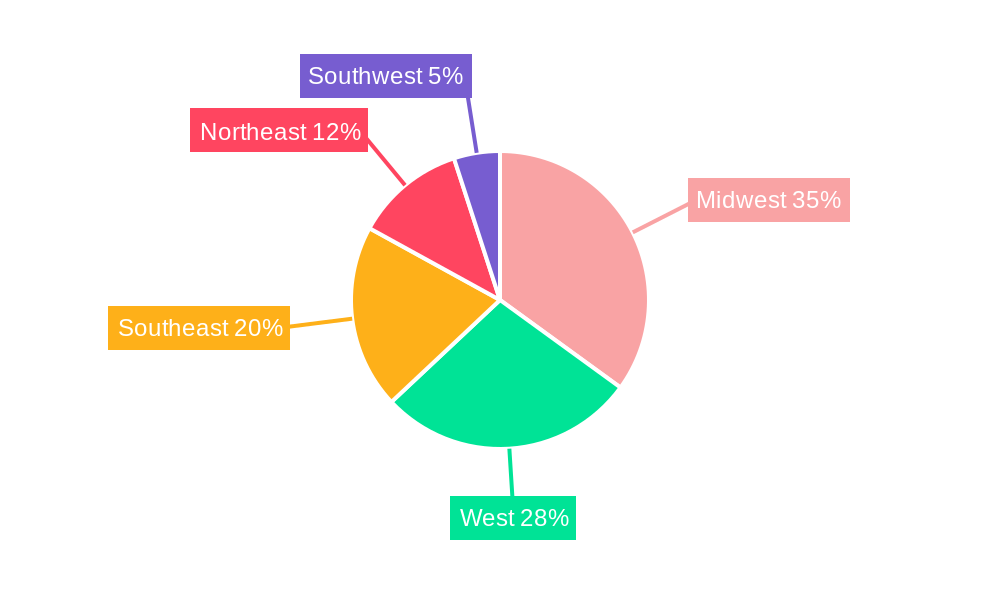
USA Bio Pesticides Market Regional Market Share
Geographic Coverage of USA Bio Pesticides Market
USA Bio Pesticides Market REPORT HIGHLIGHTS
| Aspects | Details |
|---|---|
| Study Period | 2020-2034 |
| Base Year | 2025 |
| Estimated Year | 2026 |
| Forecast Period | 2026-2034 |
| Historical Period | 2020-2025 |
| Growth Rate | CAGR of 14.6% from 2020-2034 |
| Segmentation |
|
Table of Contents
- 1. Introduction
- 1.1. Research Scope
- 1.2. Market Segmentation
- 1.3. Research Objective
- 1.4. Definitions and Assumptions
- 2. Executive Summary
- 2.1. Market Snapshot
- 3. Market Dynamics
- 3.1. Market Drivers
- 3.2. Market Restrains
- 3.3. Market Trends
- 3.4. Market Opportunities
- 4. Market Factor Analysis
- 4.1. Porters Five Forces
- 4.1.1. Bargaining Power of Suppliers
- 4.1.2. Bargaining Power of Buyers
- 4.1.3. Threat of New Entrants
- 4.1.4. Threat of Substitutes
- 4.1.5. Competitive Rivalry
- 4.2. PESTEL analysis
- 4.3. BCG Analysis
- 4.3.1. Stars (High Growth, High Market Share)
- 4.3.2. Cash Cows (Low Growth, High Market Share)
- 4.3.3. Question Mark (High Growth, Low Market Share)
- 4.3.4. Dogs (Low Growth, Low Market Share)
- 4.4. Ansoff Matrix Analysis
- 4.5. Supply Chain Analysis
- 4.6. Regulatory Landscape
- 4.7. Current Market Potential and Opportunity Assessment (TAM–SAM–SOM Framework)
- 4.8. IMR Analyst Note
- 4.1. Porters Five Forces
- 5. Market Analysis, Insights and Forecast 2021-2033
- 5.1. Market Analysis, Insights and Forecast - by Production Analysis
- 5.2. Market Analysis, Insights and Forecast - by Consumption Analysis
- 5.3. Market Analysis, Insights and Forecast - by Import Market Analysis (Value & Volume)
- 5.4. Market Analysis, Insights and Forecast - by Export Market Analysis (Value & Volume)
- 5.5. Market Analysis, Insights and Forecast - by Price Trend Analysis
- 5.6. Market Analysis, Insights and Forecast - by Region
- 5.6.1. North America
- 5.6.2. South America
- 5.6.3. Europe
- 5.6.4. Middle East & Africa
- 5.6.5. Asia Pacific
- 6. Global USA Bio Pesticides Market Analysis, Insights and Forecast, 2021-2033
- 6.1. Market Analysis, Insights and Forecast - by Production Analysis
- 6.2. Market Analysis, Insights and Forecast - by Consumption Analysis
- 6.3. Market Analysis, Insights and Forecast - by Import Market Analysis (Value & Volume)
- 6.4. Market Analysis, Insights and Forecast - by Export Market Analysis (Value & Volume)
- 6.5. Market Analysis, Insights and Forecast - by Price Trend Analysis
- 7. North America USA Bio Pesticides Market Analysis, Insights and Forecast, 2020-2032
- 7.1. Market Analysis, Insights and Forecast - by Production Analysis
- 7.2. Market Analysis, Insights and Forecast - by Consumption Analysis
- 7.3. Market Analysis, Insights and Forecast - by Import Market Analysis (Value & Volume)
- 7.4. Market Analysis, Insights and Forecast - by Export Market Analysis (Value & Volume)
- 7.5. Market Analysis, Insights and Forecast - by Price Trend Analysis
- 8. South America USA Bio Pesticides Market Analysis, Insights and Forecast, 2020-2032
- 8.1. Market Analysis, Insights and Forecast - by Production Analysis
- 8.2. Market Analysis, Insights and Forecast - by Consumption Analysis
- 8.3. Market Analysis, Insights and Forecast - by Import Market Analysis (Value & Volume)
- 8.4. Market Analysis, Insights and Forecast - by Export Market Analysis (Value & Volume)
- 8.5. Market Analysis, Insights and Forecast - by Price Trend Analysis
- 9. Europe USA Bio Pesticides Market Analysis, Insights and Forecast, 2020-2032
- 9.1. Market Analysis, Insights and Forecast - by Production Analysis
- 9.2. Market Analysis, Insights and Forecast - by Consumption Analysis
- 9.3. Market Analysis, Insights and Forecast - by Import Market Analysis (Value & Volume)
- 9.4. Market Analysis, Insights and Forecast - by Export Market Analysis (Value & Volume)
- 9.5. Market Analysis, Insights and Forecast - by Price Trend Analysis
- 10. Middle East & Africa USA Bio Pesticides Market Analysis, Insights and Forecast, 2020-2032
- 10.1. Market Analysis, Insights and Forecast - by Production Analysis
- 10.2. Market Analysis, Insights and Forecast - by Consumption Analysis
- 10.3. Market Analysis, Insights and Forecast - by Import Market Analysis (Value & Volume)
- 10.4. Market Analysis, Insights and Forecast - by Export Market Analysis (Value & Volume)
- 10.5. Market Analysis, Insights and Forecast - by Price Trend Analysis
- 11. Asia Pacific USA Bio Pesticides Market Analysis, Insights and Forecast, 2020-2032
- 11.1. Market Analysis, Insights and Forecast - by Production Analysis
- 11.2. Market Analysis, Insights and Forecast - by Consumption Analysis
- 11.3. Market Analysis, Insights and Forecast - by Import Market Analysis (Value & Volume)
- 11.4. Market Analysis, Insights and Forecast - by Export Market Analysis (Value & Volume)
- 11.5. Market Analysis, Insights and Forecast - by Price Trend Analysis
- 12. Competitive Analysis
- 12.1. Company Profiles
- 12.1.1 Valent Biosciences LL
- 12.1.1.1. Company Overview
- 12.1.1.2. Products
- 12.1.1.3. Company Financials
- 12.1.1.4. SWOT Analysis
- 12.1.2 Bioworks Inc
- 12.1.2.1. Company Overview
- 12.1.2.2. Products
- 12.1.2.3. Company Financials
- 12.1.2.4. SWOT Analysis
- 12.1.3 Marrone Bio Innovations Inc
- 12.1.3.1. Company Overview
- 12.1.3.2. Products
- 12.1.3.3. Company Financials
- 12.1.3.4. SWOT Analysis
- 12.1.4 Certis USA LLC
- 12.1.4.1. Company Overview
- 12.1.4.2. Products
- 12.1.4.3. Company Financials
- 12.1.4.4. SWOT Analysis
- 12.1.5 FMC Corporation
- 12.1.5.1. Company Overview
- 12.1.5.2. Products
- 12.1.5.3. Company Financials
- 12.1.5.4. SWOT Analysis
- 12.1.6 Andermatt Group AG
- 12.1.6.1. Company Overview
- 12.1.6.2. Products
- 12.1.6.3. Company Financials
- 12.1.6.4. SWOT Analysis
- 12.1.7 Indogulf BioAg LLC (Biotech Division of Indogulf Company)
- 12.1.7.1. Company Overview
- 12.1.7.2. Products
- 12.1.7.3. Company Financials
- 12.1.7.4. SWOT Analysis
- 12.1.8 Corteva Agriscience
- 12.1.8.1. Company Overview
- 12.1.8.2. Products
- 12.1.8.3. Company Financials
- 12.1.8.4. SWOT Analysis
- 12.1.9 Terramera Inc
- 12.1.9.1. Company Overview
- 12.1.9.2. Products
- 12.1.9.3. Company Financials
- 12.1.9.4. SWOT Analysis
- 12.1.10 Lallemand Inc
- 12.1.10.1. Company Overview
- 12.1.10.2. Products
- 12.1.10.3. Company Financials
- 12.1.10.4. SWOT Analysis
- 12.1.1 Valent Biosciences LL
- 12.2. Market Entropy
- 12.2.1 Company's Key Areas Served
- 12.2.2 Recent Developments
- 12.3. Company Market Share Analysis 2025
- 12.3.1 Top 5 Companies Market Share Analysis
- 12.3.2 Top 3 Companies Market Share Analysis
- 12.4. List of Potential Customers
- 13. Research Methodology
List of Figures
- Figure 1: Global USA Bio Pesticides Market Revenue Breakdown (billion, %) by Region 2025 & 2033
- Figure 2: North America USA Bio Pesticides Market Revenue (billion), by Production Analysis 2025 & 2033
- Figure 3: North America USA Bio Pesticides Market Revenue Share (%), by Production Analysis 2025 & 2033
- Figure 4: North America USA Bio Pesticides Market Revenue (billion), by Consumption Analysis 2025 & 2033
- Figure 5: North America USA Bio Pesticides Market Revenue Share (%), by Consumption Analysis 2025 & 2033
- Figure 6: North America USA Bio Pesticides Market Revenue (billion), by Import Market Analysis (Value & Volume) 2025 & 2033
- Figure 7: North America USA Bio Pesticides Market Revenue Share (%), by Import Market Analysis (Value & Volume) 2025 & 2033
- Figure 8: North America USA Bio Pesticides Market Revenue (billion), by Export Market Analysis (Value & Volume) 2025 & 2033
- Figure 9: North America USA Bio Pesticides Market Revenue Share (%), by Export Market Analysis (Value & Volume) 2025 & 2033
- Figure 10: North America USA Bio Pesticides Market Revenue (billion), by Price Trend Analysis 2025 & 2033
- Figure 11: North America USA Bio Pesticides Market Revenue Share (%), by Price Trend Analysis 2025 & 2033
- Figure 12: North America USA Bio Pesticides Market Revenue (billion), by Country 2025 & 2033
- Figure 13: North America USA Bio Pesticides Market Revenue Share (%), by Country 2025 & 2033
- Figure 14: South America USA Bio Pesticides Market Revenue (billion), by Production Analysis 2025 & 2033
- Figure 15: South America USA Bio Pesticides Market Revenue Share (%), by Production Analysis 2025 & 2033
- Figure 16: South America USA Bio Pesticides Market Revenue (billion), by Consumption Analysis 2025 & 2033
- Figure 17: South America USA Bio Pesticides Market Revenue Share (%), by Consumption Analysis 2025 & 2033
- Figure 18: South America USA Bio Pesticides Market Revenue (billion), by Import Market Analysis (Value & Volume) 2025 & 2033
- Figure 19: South America USA Bio Pesticides Market Revenue Share (%), by Import Market Analysis (Value & Volume) 2025 & 2033
- Figure 20: South America USA Bio Pesticides Market Revenue (billion), by Export Market Analysis (Value & Volume) 2025 & 2033
- Figure 21: South America USA Bio Pesticides Market Revenue Share (%), by Export Market Analysis (Value & Volume) 2025 & 2033
- Figure 22: South America USA Bio Pesticides Market Revenue (billion), by Price Trend Analysis 2025 & 2033
- Figure 23: South America USA Bio Pesticides Market Revenue Share (%), by Price Trend Analysis 2025 & 2033
- Figure 24: South America USA Bio Pesticides Market Revenue (billion), by Country 2025 & 2033
- Figure 25: South America USA Bio Pesticides Market Revenue Share (%), by Country 2025 & 2033
- Figure 26: Europe USA Bio Pesticides Market Revenue (billion), by Production Analysis 2025 & 2033
- Figure 27: Europe USA Bio Pesticides Market Revenue Share (%), by Production Analysis 2025 & 2033
- Figure 28: Europe USA Bio Pesticides Market Revenue (billion), by Consumption Analysis 2025 & 2033
- Figure 29: Europe USA Bio Pesticides Market Revenue Share (%), by Consumption Analysis 2025 & 2033
- Figure 30: Europe USA Bio Pesticides Market Revenue (billion), by Import Market Analysis (Value & Volume) 2025 & 2033
- Figure 31: Europe USA Bio Pesticides Market Revenue Share (%), by Import Market Analysis (Value & Volume) 2025 & 2033
- Figure 32: Europe USA Bio Pesticides Market Revenue (billion), by Export Market Analysis (Value & Volume) 2025 & 2033
- Figure 33: Europe USA Bio Pesticides Market Revenue Share (%), by Export Market Analysis (Value & Volume) 2025 & 2033
- Figure 34: Europe USA Bio Pesticides Market Revenue (billion), by Price Trend Analysis 2025 & 2033
- Figure 35: Europe USA Bio Pesticides Market Revenue Share (%), by Price Trend Analysis 2025 & 2033
- Figure 36: Europe USA Bio Pesticides Market Revenue (billion), by Country 2025 & 2033
- Figure 37: Europe USA Bio Pesticides Market Revenue Share (%), by Country 2025 & 2033
- Figure 38: Middle East & Africa USA Bio Pesticides Market Revenue (billion), by Production Analysis 2025 & 2033
- Figure 39: Middle East & Africa USA Bio Pesticides Market Revenue Share (%), by Production Analysis 2025 & 2033
- Figure 40: Middle East & Africa USA Bio Pesticides Market Revenue (billion), by Consumption Analysis 2025 & 2033
- Figure 41: Middle East & Africa USA Bio Pesticides Market Revenue Share (%), by Consumption Analysis 2025 & 2033
- Figure 42: Middle East & Africa USA Bio Pesticides Market Revenue (billion), by Import Market Analysis (Value & Volume) 2025 & 2033
- Figure 43: Middle East & Africa USA Bio Pesticides Market Revenue Share (%), by Import Market Analysis (Value & Volume) 2025 & 2033
- Figure 44: Middle East & Africa USA Bio Pesticides Market Revenue (billion), by Export Market Analysis (Value & Volume) 2025 & 2033
- Figure 45: Middle East & Africa USA Bio Pesticides Market Revenue Share (%), by Export Market Analysis (Value & Volume) 2025 & 2033
- Figure 46: Middle East & Africa USA Bio Pesticides Market Revenue (billion), by Price Trend Analysis 2025 & 2033
- Figure 47: Middle East & Africa USA Bio Pesticides Market Revenue Share (%), by Price Trend Analysis 2025 & 2033
- Figure 48: Middle East & Africa USA Bio Pesticides Market Revenue (billion), by Country 2025 & 2033
- Figure 49: Middle East & Africa USA Bio Pesticides Market Revenue Share (%), by Country 2025 & 2033
- Figure 50: Asia Pacific USA Bio Pesticides Market Revenue (billion), by Production Analysis 2025 & 2033
- Figure 51: Asia Pacific USA Bio Pesticides Market Revenue Share (%), by Production Analysis 2025 & 2033
- Figure 52: Asia Pacific USA Bio Pesticides Market Revenue (billion), by Consumption Analysis 2025 & 2033
- Figure 53: Asia Pacific USA Bio Pesticides Market Revenue Share (%), by Consumption Analysis 2025 & 2033
- Figure 54: Asia Pacific USA Bio Pesticides Market Revenue (billion), by Import Market Analysis (Value & Volume) 2025 & 2033
- Figure 55: Asia Pacific USA Bio Pesticides Market Revenue Share (%), by Import Market Analysis (Value & Volume) 2025 & 2033
- Figure 56: Asia Pacific USA Bio Pesticides Market Revenue (billion), by Export Market Analysis (Value & Volume) 2025 & 2033
- Figure 57: Asia Pacific USA Bio Pesticides Market Revenue Share (%), by Export Market Analysis (Value & Volume) 2025 & 2033
- Figure 58: Asia Pacific USA Bio Pesticides Market Revenue (billion), by Price Trend Analysis 2025 & 2033
- Figure 59: Asia Pacific USA Bio Pesticides Market Revenue Share (%), by Price Trend Analysis 2025 & 2033
- Figure 60: Asia Pacific USA Bio Pesticides Market Revenue (billion), by Country 2025 & 2033
- Figure 61: Asia Pacific USA Bio Pesticides Market Revenue Share (%), by Country 2025 & 2033
List of Tables
- Table 1: Global USA Bio Pesticides Market Revenue billion Forecast, by Production Analysis 2020 & 2033
- Table 2: Global USA Bio Pesticides Market Revenue billion Forecast, by Consumption Analysis 2020 & 2033
- Table 3: Global USA Bio Pesticides Market Revenue billion Forecast, by Import Market Analysis (Value & Volume) 2020 & 2033
- Table 4: Global USA Bio Pesticides Market Revenue billion Forecast, by Export Market Analysis (Value & Volume) 2020 & 2033
- Table 5: Global USA Bio Pesticides Market Revenue billion Forecast, by Price Trend Analysis 2020 & 2033
- Table 6: Global USA Bio Pesticides Market Revenue billion Forecast, by Region 2020 & 2033
- Table 7: Global USA Bio Pesticides Market Revenue billion Forecast, by Production Analysis 2020 & 2033
- Table 8: Global USA Bio Pesticides Market Revenue billion Forecast, by Consumption Analysis 2020 & 2033
- Table 9: Global USA Bio Pesticides Market Revenue billion Forecast, by Import Market Analysis (Value & Volume) 2020 & 2033
- Table 10: Global USA Bio Pesticides Market Revenue billion Forecast, by Export Market Analysis (Value & Volume) 2020 & 2033
- Table 11: Global USA Bio Pesticides Market Revenue billion Forecast, by Price Trend Analysis 2020 & 2033
- Table 12: Global USA Bio Pesticides Market Revenue billion Forecast, by Country 2020 & 2033
- Table 13: United States USA Bio Pesticides Market Revenue (billion) Forecast, by Application 2020 & 2033
- Table 14: Canada USA Bio Pesticides Market Revenue (billion) Forecast, by Application 2020 & 2033
- Table 15: Mexico USA Bio Pesticides Market Revenue (billion) Forecast, by Application 2020 & 2033
- Table 16: Global USA Bio Pesticides Market Revenue billion Forecast, by Production Analysis 2020 & 2033
- Table 17: Global USA Bio Pesticides Market Revenue billion Forecast, by Consumption Analysis 2020 & 2033
- Table 18: Global USA Bio Pesticides Market Revenue billion Forecast, by Import Market Analysis (Value & Volume) 2020 & 2033
- Table 19: Global USA Bio Pesticides Market Revenue billion Forecast, by Export Market Analysis (Value & Volume) 2020 & 2033
- Table 20: Global USA Bio Pesticides Market Revenue billion Forecast, by Price Trend Analysis 2020 & 2033
- Table 21: Global USA Bio Pesticides Market Revenue billion Forecast, by Country 2020 & 2033
- Table 22: Brazil USA Bio Pesticides Market Revenue (billion) Forecast, by Application 2020 & 2033
- Table 23: Argentina USA Bio Pesticides Market Revenue (billion) Forecast, by Application 2020 & 2033
- Table 24: Rest of South America USA Bio Pesticides Market Revenue (billion) Forecast, by Application 2020 & 2033
- Table 25: Global USA Bio Pesticides Market Revenue billion Forecast, by Production Analysis 2020 & 2033
- Table 26: Global USA Bio Pesticides Market Revenue billion Forecast, by Consumption Analysis 2020 & 2033
- Table 27: Global USA Bio Pesticides Market Revenue billion Forecast, by Import Market Analysis (Value & Volume) 2020 & 2033
- Table 28: Global USA Bio Pesticides Market Revenue billion Forecast, by Export Market Analysis (Value & Volume) 2020 & 2033
- Table 29: Global USA Bio Pesticides Market Revenue billion Forecast, by Price Trend Analysis 2020 & 2033
- Table 30: Global USA Bio Pesticides Market Revenue billion Forecast, by Country 2020 & 2033
- Table 31: United Kingdom USA Bio Pesticides Market Revenue (billion) Forecast, by Application 2020 & 2033
- Table 32: Germany USA Bio Pesticides Market Revenue (billion) Forecast, by Application 2020 & 2033
- Table 33: France USA Bio Pesticides Market Revenue (billion) Forecast, by Application 2020 & 2033
- Table 34: Italy USA Bio Pesticides Market Revenue (billion) Forecast, by Application 2020 & 2033
- Table 35: Spain USA Bio Pesticides Market Revenue (billion) Forecast, by Application 2020 & 2033
- Table 36: Russia USA Bio Pesticides Market Revenue (billion) Forecast, by Application 2020 & 2033
- Table 37: Benelux USA Bio Pesticides Market Revenue (billion) Forecast, by Application 2020 & 2033
- Table 38: Nordics USA Bio Pesticides Market Revenue (billion) Forecast, by Application 2020 & 2033
- Table 39: Rest of Europe USA Bio Pesticides Market Revenue (billion) Forecast, by Application 2020 & 2033
- Table 40: Global USA Bio Pesticides Market Revenue billion Forecast, by Production Analysis 2020 & 2033
- Table 41: Global USA Bio Pesticides Market Revenue billion Forecast, by Consumption Analysis 2020 & 2033
- Table 42: Global USA Bio Pesticides Market Revenue billion Forecast, by Import Market Analysis (Value & Volume) 2020 & 2033
- Table 43: Global USA Bio Pesticides Market Revenue billion Forecast, by Export Market Analysis (Value & Volume) 2020 & 2033
- Table 44: Global USA Bio Pesticides Market Revenue billion Forecast, by Price Trend Analysis 2020 & 2033
- Table 45: Global USA Bio Pesticides Market Revenue billion Forecast, by Country 2020 & 2033
- Table 46: Turkey USA Bio Pesticides Market Revenue (billion) Forecast, by Application 2020 & 2033
- Table 47: Israel USA Bio Pesticides Market Revenue (billion) Forecast, by Application 2020 & 2033
- Table 48: GCC USA Bio Pesticides Market Revenue (billion) Forecast, by Application 2020 & 2033
- Table 49: North Africa USA Bio Pesticides Market Revenue (billion) Forecast, by Application 2020 & 2033
- Table 50: South Africa USA Bio Pesticides Market Revenue (billion) Forecast, by Application 2020 & 2033
- Table 51: Rest of Middle East & Africa USA Bio Pesticides Market Revenue (billion) Forecast, by Application 2020 & 2033
- Table 52: Global USA Bio Pesticides Market Revenue billion Forecast, by Production Analysis 2020 & 2033
- Table 53: Global USA Bio Pesticides Market Revenue billion Forecast, by Consumption Analysis 2020 & 2033
- Table 54: Global USA Bio Pesticides Market Revenue billion Forecast, by Import Market Analysis (Value & Volume) 2020 & 2033
- Table 55: Global USA Bio Pesticides Market Revenue billion Forecast, by Export Market Analysis (Value & Volume) 2020 & 2033
- Table 56: Global USA Bio Pesticides Market Revenue billion Forecast, by Price Trend Analysis 2020 & 2033
- Table 57: Global USA Bio Pesticides Market Revenue billion Forecast, by Country 2020 & 2033
- Table 58: China USA Bio Pesticides Market Revenue (billion) Forecast, by Application 2020 & 2033
- Table 59: India USA Bio Pesticides Market Revenue (billion) Forecast, by Application 2020 & 2033
- Table 60: Japan USA Bio Pesticides Market Revenue (billion) Forecast, by Application 2020 & 2033
- Table 61: South Korea USA Bio Pesticides Market Revenue (billion) Forecast, by Application 2020 & 2033
- Table 62: ASEAN USA Bio Pesticides Market Revenue (billion) Forecast, by Application 2020 & 2033
- Table 63: Oceania USA Bio Pesticides Market Revenue (billion) Forecast, by Application 2020 & 2033
- Table 64: Rest of Asia Pacific USA Bio Pesticides Market Revenue (billion) Forecast, by Application 2020 & 2033
Frequently Asked Questions
1. What is the projected Compound Annual Growth Rate (CAGR) of the USA Bio Pesticides Market?
The projected CAGR is approximately 14.6%.
2. Which companies are prominent players in the USA Bio Pesticides Market?
Key companies in the market include Valent Biosciences LL, Bioworks Inc, Marrone Bio Innovations Inc, Certis USA LLC, FMC Corporation, Andermatt Group AG, Indogulf BioAg LLC (Biotech Division of Indogulf Company), Corteva Agriscience, Terramera Inc, Lallemand Inc.
3. What are the main segments of the USA Bio Pesticides Market?
The market segments include Production Analysis, Consumption Analysis, Import Market Analysis (Value & Volume), Export Market Analysis (Value & Volume), Price Trend Analysis.
4. Can you provide details about the market size?
The market size is estimated to be USD 8.94 billion as of 2022.
5. What are some drivers contributing to market growth?
Seed Treatment As A Solution To Enhance Yield; Growing Awareness For Seed Treatment Among The Farmers; Rising Trend Of Organic Farming.
6. What are the notable trends driving market growth?
Row Crops is the largest Crop Type.
7. Are there any restraints impacting market growth?
Limitations Across Farm-Level Seed Treatment; Rising Environmental Concerns.
8. Can you provide examples of recent developments in the market?
September 2022: Corteva Agriscience signed an agreement to acquire a biologicals-based company Symborg as a part of its strategy to expand its biologicals portfolio. This move would help Corteva Agriscience in achieving its aim to become a global leader in the agricultural biologicals market.June 2022: Certis Biologicals and Novozymes, two leading agricultural biotechnology companies, collaborated to develop new technologies for highly effective fungal disease control. This collaboration will provide new solutions to row crop growers.June 2022: Valent BioSciences LLC confirmed that it had approved a big expansion of its biorational manufacturing facility in Osage, Iowa, to meet the rising demand for its biorational products and introduce new products that will necessitate more capacity.
9. What pricing options are available for accessing the report?
Pricing options include single-user, multi-user, and enterprise licenses priced at USD 3800, USD 4500, and USD 5800 respectively.
10. Is the market size provided in terms of value or volume?
The market size is provided in terms of value, measured in billion.
11. Are there any specific market keywords associated with the report?
Yes, the market keyword associated with the report is "USA Bio Pesticides Market," which aids in identifying and referencing the specific market segment covered.
12. How do I determine which pricing option suits my needs best?
The pricing options vary based on user requirements and access needs. Individual users may opt for single-user licenses, while businesses requiring broader access may choose multi-user or enterprise licenses for cost-effective access to the report.
13. Are there any additional resources or data provided in the USA Bio Pesticides Market report?
While the report offers comprehensive insights, it's advisable to review the specific contents or supplementary materials provided to ascertain if additional resources or data are available.
14. How can I stay updated on further developments or reports in the USA Bio Pesticides Market?
To stay informed about further developments, trends, and reports in the USA Bio Pesticides Market, consider subscribing to industry newsletters, following relevant companies and organizations, or regularly checking reputable industry news sources and publications.
Methodology
Step 1 - Identification of Relevant Samples Size from Population Database


Step 2 - Approaches for Defining Global Market Size (Value, Volume* & Price*)

Note*: In applicable scenarios
Step 3 - Data Sources
Primary Research
- Web Analytics
- Survey Reports
- Research Institute
- Latest Research Reports
- Opinion Leaders
Secondary Research
- Annual Reports
- White Paper
- Latest Press Release
- Industry Association
- Paid Database
- Investor Presentations

Step 4 - Data Triangulation
Involves using different sources of information in order to increase the validity of a study
These sources are likely to be stakeholders in a program - participants, other researchers, program staff, other community members, and so on.
Then we put all data in single framework & apply various statistical tools to find out the dynamic on the market.
During the analysis stage, feedback from the stakeholder groups would be compared to determine areas of agreement as well as areas of divergence