

Key Insights
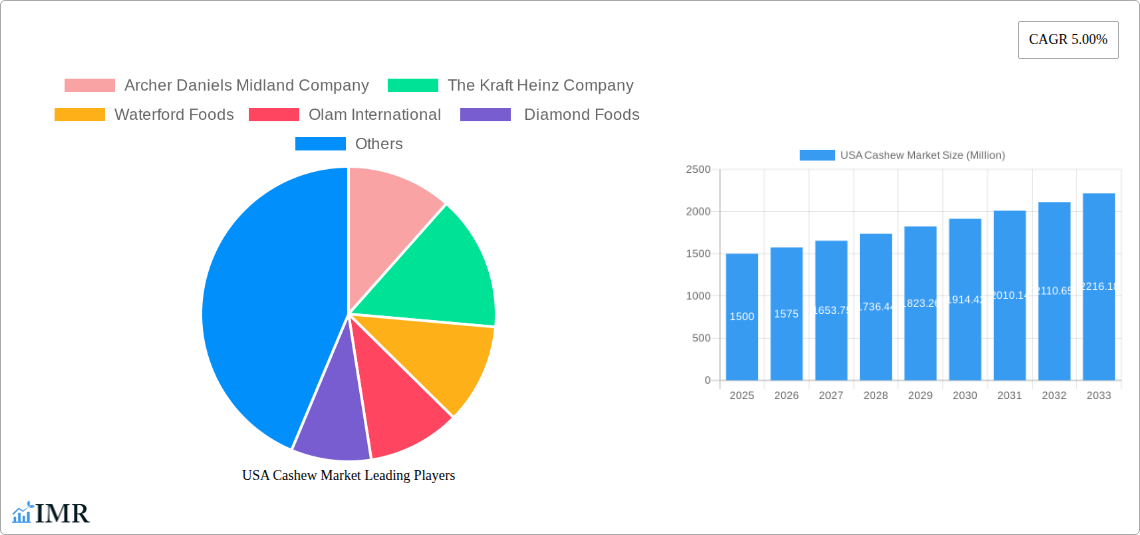
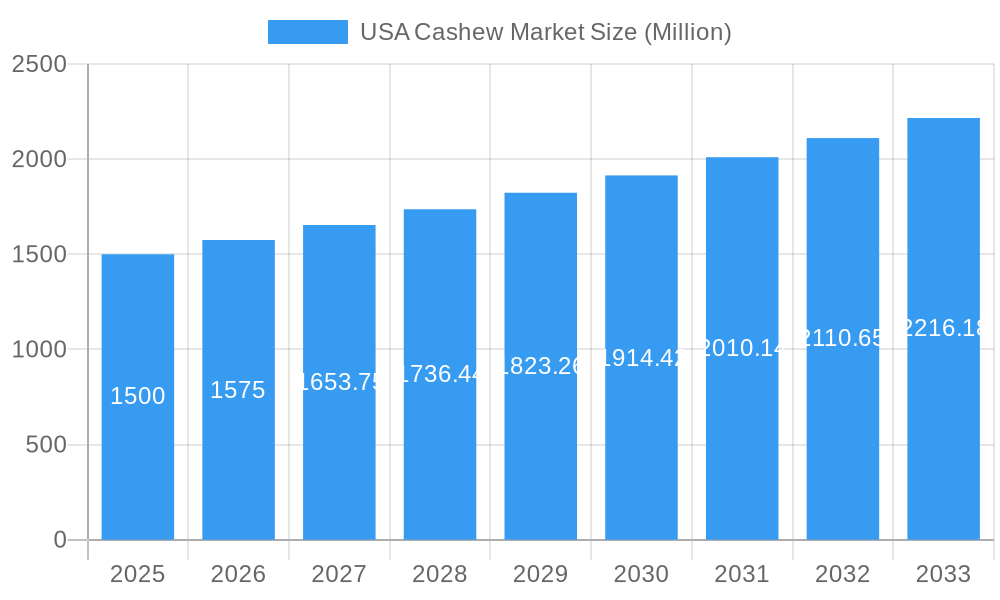
The US cashew market, a significant segment of the global cashew industry, is experiencing robust growth, driven by increasing consumer demand for healthy snacks and versatile culinary ingredients. The market's value in 2025 is estimated at $1.5 billion USD, reflecting the substantial consumption of cashews in various forms, including raw, roasted, salted, and processed into cashew butter and cream. This growth is projected to continue at a Compound Annual Growth Rate (CAGR) of 5%, leading to a market value exceeding $2 billion by 2033. Key drivers include the rising popularity of plant-based diets, increasing awareness of cashews' nutritional benefits (rich in healthy fats and protein), and the expanding use of cashews in various food products like confectionery, desserts, and savory dishes. The market is segmented by product type, with roasted and salted cashews holding the largest market share currently, while cashew butter and cream are experiencing rapid growth due to their convenience and use in various recipes and health-conscious snacks. Major players such as Archer Daniels Midland Company, The Kraft Heinz Company, and Olam International are actively involved in the production, processing, and distribution of cashews, contributing to the market's dynamism and competition.
USA Cashew Market Market Size (In Billion)
The strong growth trajectory is also fueled by innovative product development, including flavored cashews and organic options catering to specific consumer preferences. However, challenges exist, such as price fluctuations in cashew raw materials due to global supply chain dynamics and potential competition from other nuts and alternative snack options. Nevertheless, the long-term outlook for the US cashew market remains positive, indicating a substantial opportunity for growth and market expansion. The increasing health consciousness among American consumers, along with the versatility and convenience of cashews, positions the market for sustained growth throughout the forecast period. Continued innovation and strategic market penetration by key players will be crucial for sustaining this positive trajectory.
USA Cashew Market Company Market Share
USA Cashew Market: A Comprehensive Market Report (2019-2033)
This comprehensive report provides a detailed analysis of the USA cashew market, encompassing market dynamics, growth trends, key players, and future outlook. With a focus on both the parent market (nut and snack market) and child market segments (raw, roasted, salted cashews, cashew cream, and cashew butter), this report offers invaluable insights for industry professionals, investors, and strategic decision-makers. The study period spans from 2019 to 2033, with 2025 as the base and estimated year.
USA Cashew Market Market Dynamics & Structure
This section delves into the intricate structure of the USA cashew market, examining market concentration, technological advancements, regulatory landscapes, competitive substitutes, end-user demographics, and mergers & acquisitions (M&A) activities. The market is moderately concentrated, with key players holding significant shares, but also witnessing increasing competition from smaller, niche brands focusing on organic and specialty cashew products.
- Market Concentration: The top five players (Archer Daniels Midland Company, The Kraft Heinz Company, Waterford Foods, Olam International, and Diamond Foods) hold an estimated xx% market share collectively in 2025.
- Technological Innovation: Automation in processing and packaging, coupled with innovations in flavor profiles and product formats (e.g., cashew milk powders, cashew creams), are key drivers. However, barriers include high initial investment costs for advanced technologies and potential supply chain disruptions.
- Regulatory Framework: FDA regulations regarding labeling, food safety, and organic certification significantly influence market operations. Compliance costs can impact smaller players more significantly.
- Competitive Substitutes: Other nuts (almonds, peanuts), seeds, and dairy alternatives pose competitive threats, necessitating product differentiation strategies.
- End-User Demographics: Health-conscious consumers, particularly millennials and Gen Z, are key drivers of growth, favoring organic, plant-based products.
- M&A Trends: The past five years have seen xx M&A deals in the USA cashew market, primarily focused on consolidating processing and distribution capabilities. This trend is expected to continue.
USA Cashew Market Growth Trends & Insights
The USA cashew market has witnessed robust growth over the historical period (2019-2024), driven by increasing consumer demand for healthy snacks and plant-based alternatives. The market size expanded from xx million units in 2019 to xx million units in 2024, registering a CAGR of xx%. This growth trajectory is projected to continue, with a forecasted CAGR of xx% during the forecast period (2025-2033), reaching xx million units by 2033. This growth is fueled by several factors, including rising disposable incomes, increasing health awareness, and the expansion of retail channels. Technological disruptions such as improved processing technologies and innovative product formulations are further boosting market growth. Consumer behavior shifts toward convenience, sustainability, and ethical sourcing are also significantly impacting market dynamics. Market penetration of cashew-based products, particularly cashew milk and butter, remains relatively low, suggesting substantial untapped potential.
Dominant Regions, Countries, or Segments in USA Cashew Market
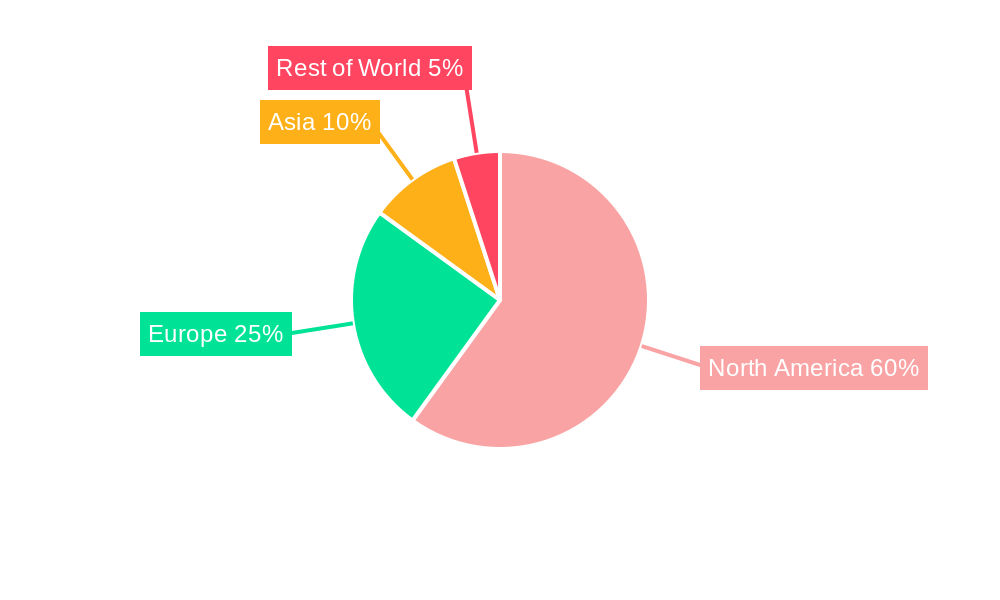
The Western region of the USA currently holds the largest market share within the US cashew market, followed by the Northeast and Southern regions. California, in particular, stands out due to its robust agricultural sector and proximity to major processing facilities. The roasted cashew segment dominates the product landscape, followed by salted and raw cashews, with cashew cream and butter showing promising growth potential.
- Key Drivers for Western Region Dominance:
- Established processing infrastructure.
- Strong distribution networks.
- High concentration of health-conscious consumers.
- Growth Potential in other regions:
- Increasing awareness about health benefits in other regions.
- Expansion of retail channels and online sales.
The roasted cashews segment's dominance is attributed to its widespread appeal and versatility, catering to a broad range of consumer preferences. However, cashew cream and butter segments are exhibiting faster growth rates driven by evolving consumer preferences towards healthier alternatives and increased usage in various food applications.
USA Cashew Market Product Landscape
The USA cashew market showcases a diverse range of products, from raw and roasted cashews to value-added options like cashew butter and cashew cream. Product innovation focuses on enhancing taste profiles, improving nutritional content (e.g., organic, fortified), and introducing convenient formats (e.g., single-serving pouches, ready-to-eat snacks). Technological advancements include improved roasting techniques for enhanced flavor and texture, as well as efficient processing methods to reduce costs and waste. Unique selling propositions often highlight organic certification, ethical sourcing, and unique flavor combinations.
Key Drivers, Barriers & Challenges in USA Cashew Market
Key Drivers: Rising consumer preference for healthy snacks, increasing awareness of cashew's nutritional benefits, growing demand for plant-based alternatives to dairy, and expanding retail channels.
Challenges & Restraints: Fluctuations in raw cashew prices due to global supply chain disruptions, stringent food safety regulations increasing compliance costs, intense competition from substitute products, and the potential for supply chain disruptions impacting availability and cost.
Emerging Opportunities in USA Cashew Market
Emerging trends point towards growing demand for organic and sustainably sourced cashews, innovative product formats (e.g., cashew-based protein bars, functional beverages), and expansion into niche markets (e.g., vegan/vegetarian consumers). Untapped opportunities exist in developing value-added cashew products targeting specific dietary needs and preferences. Further penetration into e-commerce channels and direct-to-consumer sales is another potential avenue for growth.
Growth Accelerators in the USA Cashew Market Industry
Technological advancements in processing and packaging, coupled with strategic partnerships between producers, processors, and retailers, are key growth accelerators. Expansion into new market segments, such as the food service industry, and leveraging online marketing strategies to reach broader consumer bases are also crucial for long-term growth.
Key Players Shaping the USA Cashew Market Market
Notable Milestones in USA Cashew Market Sector
- February 2023: Launch of USDA-organic certified cold-pressed cashew milk and Blue Cold-Pressed Juice under the Clean Juice brand. This signifies a growing trend towards organic and healthy cashew-based products.
- September 2020: Z Natural Foods launched a dairy-free Cashew Milk Powder, further expanding the cashew milk category and catering to consumer demand for convenient alternatives.
- February 2020: The USDA launched a USD 38 million project to enhance the African cashew value chain, potentially improving the supply and affordability of raw cashews in the US market.
In-Depth USA Cashew Market Market Outlook
The future of the USA cashew market appears bright, driven by the continued growth in consumer demand for healthy snacks and plant-based products. Strategic partnerships, product innovation, and effective marketing strategies are key to capitalizing on the market's significant growth potential. Expansion into new product categories, like cashew-based protein products, and exploring innovative applications in food service and other industries present exciting opportunities for market players.
USA Cashew Market Segmentation
- 1. Production Analysis (Volume)
- 2. Consumption Analysis (Value and Volume)
- 3. Import Analysis (Value and Volume)
- 4. Export Analysis (Value and Volume)
- 5. Price Trend Analysis
- 6. Production Analysis (Volume)
- 7. Consumption Analysis (Value and Volume)
- 8. Import Analysis (Value and Volume)
- 9. Export Analysis (Value and Volume)
- 10. Price Trend Analysis
USA Cashew Market Segmentation By Geography
-
1. North America
- 1.1. United States
- 1.2. Canada
- 1.3. Mexico
-
2. South America
- 2.1. Brazil
- 2.2. Argentina
- 2.3. Rest of South America
-
3. Europe
- 3.1. United Kingdom
- 3.2. Germany
- 3.3. France
- 3.4. Italy
- 3.5. Spain
- 3.6. Russia
- 3.7. Benelux
- 3.8. Nordics
- 3.9. Rest of Europe
-
4. Middle East & Africa
- 4.1. Turkey
- 4.2. Israel
- 4.3. GCC
- 4.4. North Africa
- 4.5. South Africa
- 4.6. Rest of Middle East & Africa
-
5. Asia Pacific
- 5.1. China
- 5.2. India
- 5.3. Japan
- 5.4. South Korea
- 5.5. ASEAN
- 5.6. Oceania
- 5.7. Rest of Asia Pacific
USA Cashew Market Regional Market Share
Geographic Coverage of USA Cashew Market
USA Cashew Market REPORT HIGHLIGHTS
| Aspects | Details |
|---|---|
| Study Period | 2020-2034 |
| Base Year | 2025 |
| Estimated Year | 2026 |
| Forecast Period | 2026-2034 |
| Historical Period | 2020-2025 |
| Growth Rate | CAGR of 5.00% from 2020-2034 |
| Segmentation |
|
Table of Contents
- 1. Introduction
- 1.1. Research Scope
- 1.2. Market Segmentation
- 1.3. Research Objective
- 1.4. Definitions and Assumptions
- 2. Executive Summary
- 2.1. Market Snapshot
- 3. Market Dynamics
- 3.1. Market Drivers
- 3.2. Market Restrains
- 3.3. Market Trends
- 3.4. Market Opportunities
- 4. Market Factor Analysis
- 4.1. Porters Five Forces
- 4.1.1. Bargaining Power of Suppliers
- 4.1.2. Bargaining Power of Buyers
- 4.1.3. Threat of New Entrants
- 4.1.4. Threat of Substitutes
- 4.1.5. Competitive Rivalry
- 4.2. PESTEL analysis
- 4.3. BCG Analysis
- 4.3.1. Stars (High Growth, High Market Share)
- 4.3.2. Cash Cows (Low Growth, High Market Share)
- 4.3.3. Question Mark (High Growth, Low Market Share)
- 4.3.4. Dogs (Low Growth, Low Market Share)
- 4.4. Ansoff Matrix Analysis
- 4.5. Supply Chain Analysis
- 4.6. Regulatory Landscape
- 4.7. Current Market Potential and Opportunity Assessment (TAM–SAM–SOM Framework)
- 4.8. IMR Analyst Note
- 4.1. Porters Five Forces
- 5. Market Analysis, Insights and Forecast 2021-2033
- 5.1. Market Analysis, Insights and Forecast - by Production Analysis (Volume)
- 5.2. Market Analysis, Insights and Forecast - by Consumption Analysis (Value and Volume)
- 5.3. Market Analysis, Insights and Forecast - by Import Analysis (Value and Volume)
- 5.4. Market Analysis, Insights and Forecast - by Export Analysis (Value and Volume)
- 5.5. Market Analysis, Insights and Forecast - by Price Trend Analysis
- 5.6. Market Analysis, Insights and Forecast - by Production Analysis (Volume)
- 5.7. Market Analysis, Insights and Forecast - by Consumption Analysis (Value and Volume)
- 5.8. Market Analysis, Insights and Forecast - by Import Analysis (Value and Volume)
- 5.9. Market Analysis, Insights and Forecast - by Export Analysis (Value and Volume)
- 5.10. Market Analysis, Insights and Forecast - by Price Trend Analysis
- 5.11. Market Analysis, Insights and Forecast - by Region
- 5.11.1. North America
- 5.11.2. South America
- 5.11.3. Europe
- 5.11.4. Middle East & Africa
- 5.11.5. Asia Pacific
- 6. Global USA Cashew Market Analysis, Insights and Forecast, 2021-2033
- 6.1. Market Analysis, Insights and Forecast - by Production Analysis (Volume)
- 6.2. Market Analysis, Insights and Forecast - by Consumption Analysis (Value and Volume)
- 6.3. Market Analysis, Insights and Forecast - by Import Analysis (Value and Volume)
- 6.4. Market Analysis, Insights and Forecast - by Export Analysis (Value and Volume)
- 6.5. Market Analysis, Insights and Forecast - by Price Trend Analysis
- 6.6. Market Analysis, Insights and Forecast - by Production Analysis (Volume)
- 6.7. Market Analysis, Insights and Forecast - by Consumption Analysis (Value and Volume)
- 6.8. Market Analysis, Insights and Forecast - by Import Analysis (Value and Volume)
- 6.9. Market Analysis, Insights and Forecast - by Export Analysis (Value and Volume)
- 6.10. Market Analysis, Insights and Forecast - by Price Trend Analysis
- 7. North America USA Cashew Market Analysis, Insights and Forecast, 2020-2032
- 7.1. Market Analysis, Insights and Forecast - by Production Analysis (Volume)
- 7.2. Market Analysis, Insights and Forecast - by Consumption Analysis (Value and Volume)
- 7.3. Market Analysis, Insights and Forecast - by Import Analysis (Value and Volume)
- 7.4. Market Analysis, Insights and Forecast - by Export Analysis (Value and Volume)
- 7.5. Market Analysis, Insights and Forecast - by Price Trend Analysis
- 7.6. Market Analysis, Insights and Forecast - by Production Analysis (Volume)
- 7.7. Market Analysis, Insights and Forecast - by Consumption Analysis (Value and Volume)
- 7.8. Market Analysis, Insights and Forecast - by Import Analysis (Value and Volume)
- 7.9. Market Analysis, Insights and Forecast - by Export Analysis (Value and Volume)
- 7.10. Market Analysis, Insights and Forecast - by Price Trend Analysis
- 8. South America USA Cashew Market Analysis, Insights and Forecast, 2020-2032
- 8.1. Market Analysis, Insights and Forecast - by Production Analysis (Volume)
- 8.2. Market Analysis, Insights and Forecast - by Consumption Analysis (Value and Volume)
- 8.3. Market Analysis, Insights and Forecast - by Import Analysis (Value and Volume)
- 8.4. Market Analysis, Insights and Forecast - by Export Analysis (Value and Volume)
- 8.5. Market Analysis, Insights and Forecast - by Price Trend Analysis
- 8.6. Market Analysis, Insights and Forecast - by Production Analysis (Volume)
- 8.7. Market Analysis, Insights and Forecast - by Consumption Analysis (Value and Volume)
- 8.8. Market Analysis, Insights and Forecast - by Import Analysis (Value and Volume)
- 8.9. Market Analysis, Insights and Forecast - by Export Analysis (Value and Volume)
- 8.10. Market Analysis, Insights and Forecast - by Price Trend Analysis
- 9. Europe USA Cashew Market Analysis, Insights and Forecast, 2020-2032
- 9.1. Market Analysis, Insights and Forecast - by Production Analysis (Volume)
- 9.2. Market Analysis, Insights and Forecast - by Consumption Analysis (Value and Volume)
- 9.3. Market Analysis, Insights and Forecast - by Import Analysis (Value and Volume)
- 9.4. Market Analysis, Insights and Forecast - by Export Analysis (Value and Volume)
- 9.5. Market Analysis, Insights and Forecast - by Price Trend Analysis
- 9.6. Market Analysis, Insights and Forecast - by Production Analysis (Volume)
- 9.7. Market Analysis, Insights and Forecast - by Consumption Analysis (Value and Volume)
- 9.8. Market Analysis, Insights and Forecast - by Import Analysis (Value and Volume)
- 9.9. Market Analysis, Insights and Forecast - by Export Analysis (Value and Volume)
- 9.10. Market Analysis, Insights and Forecast - by Price Trend Analysis
- 10. Middle East & Africa USA Cashew Market Analysis, Insights and Forecast, 2020-2032
- 10.1. Market Analysis, Insights and Forecast - by Production Analysis (Volume)
- 10.2. Market Analysis, Insights and Forecast - by Consumption Analysis (Value and Volume)
- 10.3. Market Analysis, Insights and Forecast - by Import Analysis (Value and Volume)
- 10.4. Market Analysis, Insights and Forecast - by Export Analysis (Value and Volume)
- 10.5. Market Analysis, Insights and Forecast - by Price Trend Analysis
- 10.6. Market Analysis, Insights and Forecast - by Production Analysis (Volume)
- 10.7. Market Analysis, Insights and Forecast - by Consumption Analysis (Value and Volume)
- 10.8. Market Analysis, Insights and Forecast - by Import Analysis (Value and Volume)
- 10.9. Market Analysis, Insights and Forecast - by Export Analysis (Value and Volume)
- 10.10. Market Analysis, Insights and Forecast - by Price Trend Analysis
- 11. Asia Pacific USA Cashew Market Analysis, Insights and Forecast, 2020-2032
- 11.1. Market Analysis, Insights and Forecast - by Production Analysis (Volume)
- 11.2. Market Analysis, Insights and Forecast - by Consumption Analysis (Value and Volume)
- 11.3. Market Analysis, Insights and Forecast - by Import Analysis (Value and Volume)
- 11.4. Market Analysis, Insights and Forecast - by Export Analysis (Value and Volume)
- 11.5. Market Analysis, Insights and Forecast - by Price Trend Analysis
- 11.6. Market Analysis, Insights and Forecast - by Production Analysis (Volume)
- 11.7. Market Analysis, Insights and Forecast - by Consumption Analysis (Value and Volume)
- 11.8. Market Analysis, Insights and Forecast - by Import Analysis (Value and Volume)
- 11.9. Market Analysis, Insights and Forecast - by Export Analysis (Value and Volume)
- 11.10. Market Analysis, Insights and Forecast - by Price Trend Analysis
- 12. Competitive Analysis
- 12.1. Company Profiles
- 12.1.1 Archer Daniels Midland Company
- 12.1.1.1. Company Overview
- 12.1.1.2. Products
- 12.1.1.3. Company Financials
- 12.1.1.4. SWOT Analysis
- 12.1.2 The Kraft Heinz Company
- 12.1.2.1. Company Overview
- 12.1.2.2. Products
- 12.1.2.3. Company Financials
- 12.1.2.4. SWOT Analysis
- 12.1.3 Waterford Foods
- 12.1.3.1. Company Overview
- 12.1.3.2. Products
- 12.1.3.3. Company Financials
- 12.1.3.4. SWOT Analysis
- 12.1.4 Olam International
- 12.1.4.1. Company Overview
- 12.1.4.2. Products
- 12.1.4.3. Company Financials
- 12.1.4.4. SWOT Analysis
- 12.1.5 Diamond Foods
- 12.1.5.1. Company Overview
- 12.1.5.2. Products
- 12.1.5.3. Company Financials
- 12.1.5.4. SWOT Analysis
- 12.1.1 Archer Daniels Midland Company
- 12.2. Market Entropy
- 12.2.1 Company's Key Areas Served
- 12.2.2 Recent Developments
- 12.3. Company Market Share Analysis 2025
- 12.3.1 Top 5 Companies Market Share Analysis
- 12.3.2 Top 3 Companies Market Share Analysis
- 12.4. List of Potential Customers
- 13. Research Methodology
List of Figures
- Figure 1: Global USA Cashew Market Revenue Breakdown (Million, %) by Region 2025 & 2033
- Figure 2: Global USA Cashew Market Volume Breakdown (Kiloton, %) by Region 2025 & 2033
- Figure 3: North America USA Cashew Market Revenue (Million), by Production Analysis (Volume) 2025 & 2033
- Figure 4: North America USA Cashew Market Volume (Kiloton), by Production Analysis (Volume) 2025 & 2033
- Figure 5: North America USA Cashew Market Revenue Share (%), by Production Analysis (Volume) 2025 & 2033
- Figure 6: North America USA Cashew Market Volume Share (%), by Production Analysis (Volume) 2025 & 2033
- Figure 7: North America USA Cashew Market Revenue (Million), by Consumption Analysis (Value and Volume) 2025 & 2033
- Figure 8: North America USA Cashew Market Volume (Kiloton), by Consumption Analysis (Value and Volume) 2025 & 2033
- Figure 9: North America USA Cashew Market Revenue Share (%), by Consumption Analysis (Value and Volume) 2025 & 2033
- Figure 10: North America USA Cashew Market Volume Share (%), by Consumption Analysis (Value and Volume) 2025 & 2033
- Figure 11: North America USA Cashew Market Revenue (Million), by Import Analysis (Value and Volume) 2025 & 2033
- Figure 12: North America USA Cashew Market Volume (Kiloton), by Import Analysis (Value and Volume) 2025 & 2033
- Figure 13: North America USA Cashew Market Revenue Share (%), by Import Analysis (Value and Volume) 2025 & 2033
- Figure 14: North America USA Cashew Market Volume Share (%), by Import Analysis (Value and Volume) 2025 & 2033
- Figure 15: North America USA Cashew Market Revenue (Million), by Export Analysis (Value and Volume) 2025 & 2033
- Figure 16: North America USA Cashew Market Volume (Kiloton), by Export Analysis (Value and Volume) 2025 & 2033
- Figure 17: North America USA Cashew Market Revenue Share (%), by Export Analysis (Value and Volume) 2025 & 2033
- Figure 18: North America USA Cashew Market Volume Share (%), by Export Analysis (Value and Volume) 2025 & 2033
- Figure 19: North America USA Cashew Market Revenue (Million), by Price Trend Analysis 2025 & 2033
- Figure 20: North America USA Cashew Market Volume (Kiloton), by Price Trend Analysis 2025 & 2033
- Figure 21: North America USA Cashew Market Revenue Share (%), by Price Trend Analysis 2025 & 2033
- Figure 22: North America USA Cashew Market Volume Share (%), by Price Trend Analysis 2025 & 2033
- Figure 23: North America USA Cashew Market Revenue (Million), by Production Analysis (Volume) 2025 & 2033
- Figure 24: North America USA Cashew Market Volume (Kiloton), by Production Analysis (Volume) 2025 & 2033
- Figure 25: North America USA Cashew Market Revenue Share (%), by Production Analysis (Volume) 2025 & 2033
- Figure 26: North America USA Cashew Market Volume Share (%), by Production Analysis (Volume) 2025 & 2033
- Figure 27: North America USA Cashew Market Revenue (Million), by Consumption Analysis (Value and Volume) 2025 & 2033
- Figure 28: North America USA Cashew Market Volume (Kiloton), by Consumption Analysis (Value and Volume) 2025 & 2033
- Figure 29: North America USA Cashew Market Revenue Share (%), by Consumption Analysis (Value and Volume) 2025 & 2033
- Figure 30: North America USA Cashew Market Volume Share (%), by Consumption Analysis (Value and Volume) 2025 & 2033
- Figure 31: North America USA Cashew Market Revenue (Million), by Import Analysis (Value and Volume) 2025 & 2033
- Figure 32: North America USA Cashew Market Volume (Kiloton), by Import Analysis (Value and Volume) 2025 & 2033
- Figure 33: North America USA Cashew Market Revenue Share (%), by Import Analysis (Value and Volume) 2025 & 2033
- Figure 34: North America USA Cashew Market Volume Share (%), by Import Analysis (Value and Volume) 2025 & 2033
- Figure 35: North America USA Cashew Market Revenue (Million), by Export Analysis (Value and Volume) 2025 & 2033
- Figure 36: North America USA Cashew Market Volume (Kiloton), by Export Analysis (Value and Volume) 2025 & 2033
- Figure 37: North America USA Cashew Market Revenue Share (%), by Export Analysis (Value and Volume) 2025 & 2033
- Figure 38: North America USA Cashew Market Volume Share (%), by Export Analysis (Value and Volume) 2025 & 2033
- Figure 39: North America USA Cashew Market Revenue (Million), by Price Trend Analysis 2025 & 2033
- Figure 40: North America USA Cashew Market Volume (Kiloton), by Price Trend Analysis 2025 & 2033
- Figure 41: North America USA Cashew Market Revenue Share (%), by Price Trend Analysis 2025 & 2033
- Figure 42: North America USA Cashew Market Volume Share (%), by Price Trend Analysis 2025 & 2033
- Figure 43: North America USA Cashew Market Revenue (Million), by Country 2025 & 2033
- Figure 44: North America USA Cashew Market Volume (Kiloton), by Country 2025 & 2033
- Figure 45: North America USA Cashew Market Revenue Share (%), by Country 2025 & 2033
- Figure 46: North America USA Cashew Market Volume Share (%), by Country 2025 & 2033
- Figure 47: South America USA Cashew Market Revenue (Million), by Production Analysis (Volume) 2025 & 2033
- Figure 48: South America USA Cashew Market Volume (Kiloton), by Production Analysis (Volume) 2025 & 2033
- Figure 49: South America USA Cashew Market Revenue Share (%), by Production Analysis (Volume) 2025 & 2033
- Figure 50: South America USA Cashew Market Volume Share (%), by Production Analysis (Volume) 2025 & 2033
- Figure 51: South America USA Cashew Market Revenue (Million), by Consumption Analysis (Value and Volume) 2025 & 2033
- Figure 52: South America USA Cashew Market Volume (Kiloton), by Consumption Analysis (Value and Volume) 2025 & 2033
- Figure 53: South America USA Cashew Market Revenue Share (%), by Consumption Analysis (Value and Volume) 2025 & 2033
- Figure 54: South America USA Cashew Market Volume Share (%), by Consumption Analysis (Value and Volume) 2025 & 2033
- Figure 55: South America USA Cashew Market Revenue (Million), by Import Analysis (Value and Volume) 2025 & 2033
- Figure 56: South America USA Cashew Market Volume (Kiloton), by Import Analysis (Value and Volume) 2025 & 2033
- Figure 57: South America USA Cashew Market Revenue Share (%), by Import Analysis (Value and Volume) 2025 & 2033
- Figure 58: South America USA Cashew Market Volume Share (%), by Import Analysis (Value and Volume) 2025 & 2033
- Figure 59: South America USA Cashew Market Revenue (Million), by Export Analysis (Value and Volume) 2025 & 2033
- Figure 60: South America USA Cashew Market Volume (Kiloton), by Export Analysis (Value and Volume) 2025 & 2033
- Figure 61: South America USA Cashew Market Revenue Share (%), by Export Analysis (Value and Volume) 2025 & 2033
- Figure 62: South America USA Cashew Market Volume Share (%), by Export Analysis (Value and Volume) 2025 & 2033
- Figure 63: South America USA Cashew Market Revenue (Million), by Price Trend Analysis 2025 & 2033
- Figure 64: South America USA Cashew Market Volume (Kiloton), by Price Trend Analysis 2025 & 2033
- Figure 65: South America USA Cashew Market Revenue Share (%), by Price Trend Analysis 2025 & 2033
- Figure 66: South America USA Cashew Market Volume Share (%), by Price Trend Analysis 2025 & 2033
- Figure 67: South America USA Cashew Market Revenue (Million), by Production Analysis (Volume) 2025 & 2033
- Figure 68: South America USA Cashew Market Volume (Kiloton), by Production Analysis (Volume) 2025 & 2033
- Figure 69: South America USA Cashew Market Revenue Share (%), by Production Analysis (Volume) 2025 & 2033
- Figure 70: South America USA Cashew Market Volume Share (%), by Production Analysis (Volume) 2025 & 2033
- Figure 71: South America USA Cashew Market Revenue (Million), by Consumption Analysis (Value and Volume) 2025 & 2033
- Figure 72: South America USA Cashew Market Volume (Kiloton), by Consumption Analysis (Value and Volume) 2025 & 2033
- Figure 73: South America USA Cashew Market Revenue Share (%), by Consumption Analysis (Value and Volume) 2025 & 2033
- Figure 74: South America USA Cashew Market Volume Share (%), by Consumption Analysis (Value and Volume) 2025 & 2033
- Figure 75: South America USA Cashew Market Revenue (Million), by Import Analysis (Value and Volume) 2025 & 2033
- Figure 76: South America USA Cashew Market Volume (Kiloton), by Import Analysis (Value and Volume) 2025 & 2033
- Figure 77: South America USA Cashew Market Revenue Share (%), by Import Analysis (Value and Volume) 2025 & 2033
- Figure 78: South America USA Cashew Market Volume Share (%), by Import Analysis (Value and Volume) 2025 & 2033
- Figure 79: South America USA Cashew Market Revenue (Million), by Export Analysis (Value and Volume) 2025 & 2033
- Figure 80: South America USA Cashew Market Volume (Kiloton), by Export Analysis (Value and Volume) 2025 & 2033
- Figure 81: South America USA Cashew Market Revenue Share (%), by Export Analysis (Value and Volume) 2025 & 2033
- Figure 82: South America USA Cashew Market Volume Share (%), by Export Analysis (Value and Volume) 2025 & 2033
- Figure 83: South America USA Cashew Market Revenue (Million), by Price Trend Analysis 2025 & 2033
- Figure 84: South America USA Cashew Market Volume (Kiloton), by Price Trend Analysis 2025 & 2033
- Figure 85: South America USA Cashew Market Revenue Share (%), by Price Trend Analysis 2025 & 2033
- Figure 86: South America USA Cashew Market Volume Share (%), by Price Trend Analysis 2025 & 2033
- Figure 87: South America USA Cashew Market Revenue (Million), by Country 2025 & 2033
- Figure 88: South America USA Cashew Market Volume (Kiloton), by Country 2025 & 2033
- Figure 89: South America USA Cashew Market Revenue Share (%), by Country 2025 & 2033
- Figure 90: South America USA Cashew Market Volume Share (%), by Country 2025 & 2033
- Figure 91: Europe USA Cashew Market Revenue (Million), by Production Analysis (Volume) 2025 & 2033
- Figure 92: Europe USA Cashew Market Volume (Kiloton), by Production Analysis (Volume) 2025 & 2033
- Figure 93: Europe USA Cashew Market Revenue Share (%), by Production Analysis (Volume) 2025 & 2033
- Figure 94: Europe USA Cashew Market Volume Share (%), by Production Analysis (Volume) 2025 & 2033
- Figure 95: Europe USA Cashew Market Revenue (Million), by Consumption Analysis (Value and Volume) 2025 & 2033
- Figure 96: Europe USA Cashew Market Volume (Kiloton), by Consumption Analysis (Value and Volume) 2025 & 2033
- Figure 97: Europe USA Cashew Market Revenue Share (%), by Consumption Analysis (Value and Volume) 2025 & 2033
- Figure 98: Europe USA Cashew Market Volume Share (%), by Consumption Analysis (Value and Volume) 2025 & 2033
- Figure 99: Europe USA Cashew Market Revenue (Million), by Import Analysis (Value and Volume) 2025 & 2033
- Figure 100: Europe USA Cashew Market Volume (Kiloton), by Import Analysis (Value and Volume) 2025 & 2033
- Figure 101: Europe USA Cashew Market Revenue Share (%), by Import Analysis (Value and Volume) 2025 & 2033
- Figure 102: Europe USA Cashew Market Volume Share (%), by Import Analysis (Value and Volume) 2025 & 2033
- Figure 103: Europe USA Cashew Market Revenue (Million), by Export Analysis (Value and Volume) 2025 & 2033
- Figure 104: Europe USA Cashew Market Volume (Kiloton), by Export Analysis (Value and Volume) 2025 & 2033
- Figure 105: Europe USA Cashew Market Revenue Share (%), by Export Analysis (Value and Volume) 2025 & 2033
- Figure 106: Europe USA Cashew Market Volume Share (%), by Export Analysis (Value and Volume) 2025 & 2033
- Figure 107: Europe USA Cashew Market Revenue (Million), by Price Trend Analysis 2025 & 2033
- Figure 108: Europe USA Cashew Market Volume (Kiloton), by Price Trend Analysis 2025 & 2033
- Figure 109: Europe USA Cashew Market Revenue Share (%), by Price Trend Analysis 2025 & 2033
- Figure 110: Europe USA Cashew Market Volume Share (%), by Price Trend Analysis 2025 & 2033
- Figure 111: Europe USA Cashew Market Revenue (Million), by Production Analysis (Volume) 2025 & 2033
- Figure 112: Europe USA Cashew Market Volume (Kiloton), by Production Analysis (Volume) 2025 & 2033
- Figure 113: Europe USA Cashew Market Revenue Share (%), by Production Analysis (Volume) 2025 & 2033
- Figure 114: Europe USA Cashew Market Volume Share (%), by Production Analysis (Volume) 2025 & 2033
- Figure 115: Europe USA Cashew Market Revenue (Million), by Consumption Analysis (Value and Volume) 2025 & 2033
- Figure 116: Europe USA Cashew Market Volume (Kiloton), by Consumption Analysis (Value and Volume) 2025 & 2033
- Figure 117: Europe USA Cashew Market Revenue Share (%), by Consumption Analysis (Value and Volume) 2025 & 2033
- Figure 118: Europe USA Cashew Market Volume Share (%), by Consumption Analysis (Value and Volume) 2025 & 2033
- Figure 119: Europe USA Cashew Market Revenue (Million), by Import Analysis (Value and Volume) 2025 & 2033
- Figure 120: Europe USA Cashew Market Volume (Kiloton), by Import Analysis (Value and Volume) 2025 & 2033
- Figure 121: Europe USA Cashew Market Revenue Share (%), by Import Analysis (Value and Volume) 2025 & 2033
- Figure 122: Europe USA Cashew Market Volume Share (%), by Import Analysis (Value and Volume) 2025 & 2033
- Figure 123: Europe USA Cashew Market Revenue (Million), by Export Analysis (Value and Volume) 2025 & 2033
- Figure 124: Europe USA Cashew Market Volume (Kiloton), by Export Analysis (Value and Volume) 2025 & 2033
- Figure 125: Europe USA Cashew Market Revenue Share (%), by Export Analysis (Value and Volume) 2025 & 2033
- Figure 126: Europe USA Cashew Market Volume Share (%), by Export Analysis (Value and Volume) 2025 & 2033
- Figure 127: Europe USA Cashew Market Revenue (Million), by Price Trend Analysis 2025 & 2033
- Figure 128: Europe USA Cashew Market Volume (Kiloton), by Price Trend Analysis 2025 & 2033
- Figure 129: Europe USA Cashew Market Revenue Share (%), by Price Trend Analysis 2025 & 2033
- Figure 130: Europe USA Cashew Market Volume Share (%), by Price Trend Analysis 2025 & 2033
- Figure 131: Europe USA Cashew Market Revenue (Million), by Country 2025 & 2033
- Figure 132: Europe USA Cashew Market Volume (Kiloton), by Country 2025 & 2033
- Figure 133: Europe USA Cashew Market Revenue Share (%), by Country 2025 & 2033
- Figure 134: Europe USA Cashew Market Volume Share (%), by Country 2025 & 2033
- Figure 135: Middle East & Africa USA Cashew Market Revenue (Million), by Production Analysis (Volume) 2025 & 2033
- Figure 136: Middle East & Africa USA Cashew Market Volume (Kiloton), by Production Analysis (Volume) 2025 & 2033
- Figure 137: Middle East & Africa USA Cashew Market Revenue Share (%), by Production Analysis (Volume) 2025 & 2033
- Figure 138: Middle East & Africa USA Cashew Market Volume Share (%), by Production Analysis (Volume) 2025 & 2033
- Figure 139: Middle East & Africa USA Cashew Market Revenue (Million), by Consumption Analysis (Value and Volume) 2025 & 2033
- Figure 140: Middle East & Africa USA Cashew Market Volume (Kiloton), by Consumption Analysis (Value and Volume) 2025 & 2033
- Figure 141: Middle East & Africa USA Cashew Market Revenue Share (%), by Consumption Analysis (Value and Volume) 2025 & 2033
- Figure 142: Middle East & Africa USA Cashew Market Volume Share (%), by Consumption Analysis (Value and Volume) 2025 & 2033
- Figure 143: Middle East & Africa USA Cashew Market Revenue (Million), by Import Analysis (Value and Volume) 2025 & 2033
- Figure 144: Middle East & Africa USA Cashew Market Volume (Kiloton), by Import Analysis (Value and Volume) 2025 & 2033
- Figure 145: Middle East & Africa USA Cashew Market Revenue Share (%), by Import Analysis (Value and Volume) 2025 & 2033
- Figure 146: Middle East & Africa USA Cashew Market Volume Share (%), by Import Analysis (Value and Volume) 2025 & 2033
- Figure 147: Middle East & Africa USA Cashew Market Revenue (Million), by Export Analysis (Value and Volume) 2025 & 2033
- Figure 148: Middle East & Africa USA Cashew Market Volume (Kiloton), by Export Analysis (Value and Volume) 2025 & 2033
- Figure 149: Middle East & Africa USA Cashew Market Revenue Share (%), by Export Analysis (Value and Volume) 2025 & 2033
- Figure 150: Middle East & Africa USA Cashew Market Volume Share (%), by Export Analysis (Value and Volume) 2025 & 2033
- Figure 151: Middle East & Africa USA Cashew Market Revenue (Million), by Price Trend Analysis 2025 & 2033
- Figure 152: Middle East & Africa USA Cashew Market Volume (Kiloton), by Price Trend Analysis 2025 & 2033
- Figure 153: Middle East & Africa USA Cashew Market Revenue Share (%), by Price Trend Analysis 2025 & 2033
- Figure 154: Middle East & Africa USA Cashew Market Volume Share (%), by Price Trend Analysis 2025 & 2033
- Figure 155: Middle East & Africa USA Cashew Market Revenue (Million), by Production Analysis (Volume) 2025 & 2033
- Figure 156: Middle East & Africa USA Cashew Market Volume (Kiloton), by Production Analysis (Volume) 2025 & 2033
- Figure 157: Middle East & Africa USA Cashew Market Revenue Share (%), by Production Analysis (Volume) 2025 & 2033
- Figure 158: Middle East & Africa USA Cashew Market Volume Share (%), by Production Analysis (Volume) 2025 & 2033
- Figure 159: Middle East & Africa USA Cashew Market Revenue (Million), by Consumption Analysis (Value and Volume) 2025 & 2033
- Figure 160: Middle East & Africa USA Cashew Market Volume (Kiloton), by Consumption Analysis (Value and Volume) 2025 & 2033
- Figure 161: Middle East & Africa USA Cashew Market Revenue Share (%), by Consumption Analysis (Value and Volume) 2025 & 2033
- Figure 162: Middle East & Africa USA Cashew Market Volume Share (%), by Consumption Analysis (Value and Volume) 2025 & 2033
- Figure 163: Middle East & Africa USA Cashew Market Revenue (Million), by Import Analysis (Value and Volume) 2025 & 2033
- Figure 164: Middle East & Africa USA Cashew Market Volume (Kiloton), by Import Analysis (Value and Volume) 2025 & 2033
- Figure 165: Middle East & Africa USA Cashew Market Revenue Share (%), by Import Analysis (Value and Volume) 2025 & 2033
- Figure 166: Middle East & Africa USA Cashew Market Volume Share (%), by Import Analysis (Value and Volume) 2025 & 2033
- Figure 167: Middle East & Africa USA Cashew Market Revenue (Million), by Export Analysis (Value and Volume) 2025 & 2033
- Figure 168: Middle East & Africa USA Cashew Market Volume (Kiloton), by Export Analysis (Value and Volume) 2025 & 2033
- Figure 169: Middle East & Africa USA Cashew Market Revenue Share (%), by Export Analysis (Value and Volume) 2025 & 2033
- Figure 170: Middle East & Africa USA Cashew Market Volume Share (%), by Export Analysis (Value and Volume) 2025 & 2033
- Figure 171: Middle East & Africa USA Cashew Market Revenue (Million), by Price Trend Analysis 2025 & 2033
- Figure 172: Middle East & Africa USA Cashew Market Volume (Kiloton), by Price Trend Analysis 2025 & 2033
- Figure 173: Middle East & Africa USA Cashew Market Revenue Share (%), by Price Trend Analysis 2025 & 2033
- Figure 174: Middle East & Africa USA Cashew Market Volume Share (%), by Price Trend Analysis 2025 & 2033
- Figure 175: Middle East & Africa USA Cashew Market Revenue (Million), by Country 2025 & 2033
- Figure 176: Middle East & Africa USA Cashew Market Volume (Kiloton), by Country 2025 & 2033
- Figure 177: Middle East & Africa USA Cashew Market Revenue Share (%), by Country 2025 & 2033
- Figure 178: Middle East & Africa USA Cashew Market Volume Share (%), by Country 2025 & 2033
- Figure 179: Asia Pacific USA Cashew Market Revenue (Million), by Production Analysis (Volume) 2025 & 2033
- Figure 180: Asia Pacific USA Cashew Market Volume (Kiloton), by Production Analysis (Volume) 2025 & 2033
- Figure 181: Asia Pacific USA Cashew Market Revenue Share (%), by Production Analysis (Volume) 2025 & 2033
- Figure 182: Asia Pacific USA Cashew Market Volume Share (%), by Production Analysis (Volume) 2025 & 2033
- Figure 183: Asia Pacific USA Cashew Market Revenue (Million), by Consumption Analysis (Value and Volume) 2025 & 2033
- Figure 184: Asia Pacific USA Cashew Market Volume (Kiloton), by Consumption Analysis (Value and Volume) 2025 & 2033
- Figure 185: Asia Pacific USA Cashew Market Revenue Share (%), by Consumption Analysis (Value and Volume) 2025 & 2033
- Figure 186: Asia Pacific USA Cashew Market Volume Share (%), by Consumption Analysis (Value and Volume) 2025 & 2033
- Figure 187: Asia Pacific USA Cashew Market Revenue (Million), by Import Analysis (Value and Volume) 2025 & 2033
- Figure 188: Asia Pacific USA Cashew Market Volume (Kiloton), by Import Analysis (Value and Volume) 2025 & 2033
- Figure 189: Asia Pacific USA Cashew Market Revenue Share (%), by Import Analysis (Value and Volume) 2025 & 2033
- Figure 190: Asia Pacific USA Cashew Market Volume Share (%), by Import Analysis (Value and Volume) 2025 & 2033
- Figure 191: Asia Pacific USA Cashew Market Revenue (Million), by Export Analysis (Value and Volume) 2025 & 2033
- Figure 192: Asia Pacific USA Cashew Market Volume (Kiloton), by Export Analysis (Value and Volume) 2025 & 2033
- Figure 193: Asia Pacific USA Cashew Market Revenue Share (%), by Export Analysis (Value and Volume) 2025 & 2033
- Figure 194: Asia Pacific USA Cashew Market Volume Share (%), by Export Analysis (Value and Volume) 2025 & 2033
- Figure 195: Asia Pacific USA Cashew Market Revenue (Million), by Price Trend Analysis 2025 & 2033
- Figure 196: Asia Pacific USA Cashew Market Volume (Kiloton), by Price Trend Analysis 2025 & 2033
- Figure 197: Asia Pacific USA Cashew Market Revenue Share (%), by Price Trend Analysis 2025 & 2033
- Figure 198: Asia Pacific USA Cashew Market Volume Share (%), by Price Trend Analysis 2025 & 2033
- Figure 199: Asia Pacific USA Cashew Market Revenue (Million), by Production Analysis (Volume) 2025 & 2033
- Figure 200: Asia Pacific USA Cashew Market Volume (Kiloton), by Production Analysis (Volume) 2025 & 2033
- Figure 201: Asia Pacific USA Cashew Market Revenue Share (%), by Production Analysis (Volume) 2025 & 2033
- Figure 202: Asia Pacific USA Cashew Market Volume Share (%), by Production Analysis (Volume) 2025 & 2033
- Figure 203: Asia Pacific USA Cashew Market Revenue (Million), by Consumption Analysis (Value and Volume) 2025 & 2033
- Figure 204: Asia Pacific USA Cashew Market Volume (Kiloton), by Consumption Analysis (Value and Volume) 2025 & 2033
- Figure 205: Asia Pacific USA Cashew Market Revenue Share (%), by Consumption Analysis (Value and Volume) 2025 & 2033
- Figure 206: Asia Pacific USA Cashew Market Volume Share (%), by Consumption Analysis (Value and Volume) 2025 & 2033
- Figure 207: Asia Pacific USA Cashew Market Revenue (Million), by Import Analysis (Value and Volume) 2025 & 2033
- Figure 208: Asia Pacific USA Cashew Market Volume (Kiloton), by Import Analysis (Value and Volume) 2025 & 2033
- Figure 209: Asia Pacific USA Cashew Market Revenue Share (%), by Import Analysis (Value and Volume) 2025 & 2033
- Figure 210: Asia Pacific USA Cashew Market Volume Share (%), by Import Analysis (Value and Volume) 2025 & 2033
- Figure 211: Asia Pacific USA Cashew Market Revenue (Million), by Export Analysis (Value and Volume) 2025 & 2033
- Figure 212: Asia Pacific USA Cashew Market Volume (Kiloton), by Export Analysis (Value and Volume) 2025 & 2033
- Figure 213: Asia Pacific USA Cashew Market Revenue Share (%), by Export Analysis (Value and Volume) 2025 & 2033
- Figure 214: Asia Pacific USA Cashew Market Volume Share (%), by Export Analysis (Value and Volume) 2025 & 2033
- Figure 215: Asia Pacific USA Cashew Market Revenue (Million), by Price Trend Analysis 2025 & 2033
- Figure 216: Asia Pacific USA Cashew Market Volume (Kiloton), by Price Trend Analysis 2025 & 2033
- Figure 217: Asia Pacific USA Cashew Market Revenue Share (%), by Price Trend Analysis 2025 & 2033
- Figure 218: Asia Pacific USA Cashew Market Volume Share (%), by Price Trend Analysis 2025 & 2033
- Figure 219: Asia Pacific USA Cashew Market Revenue (Million), by Country 2025 & 2033
- Figure 220: Asia Pacific USA Cashew Market Volume (Kiloton), by Country 2025 & 2033
- Figure 221: Asia Pacific USA Cashew Market Revenue Share (%), by Country 2025 & 2033
- Figure 222: Asia Pacific USA Cashew Market Volume Share (%), by Country 2025 & 2033
List of Tables
- Table 1: Global USA Cashew Market Revenue Million Forecast, by Production Analysis (Volume) 2020 & 2033
- Table 2: Global USA Cashew Market Volume Kiloton Forecast, by Production Analysis (Volume) 2020 & 2033
- Table 3: Global USA Cashew Market Revenue Million Forecast, by Consumption Analysis (Value and Volume) 2020 & 2033
- Table 4: Global USA Cashew Market Volume Kiloton Forecast, by Consumption Analysis (Value and Volume) 2020 & 2033
- Table 5: Global USA Cashew Market Revenue Million Forecast, by Import Analysis (Value and Volume) 2020 & 2033
- Table 6: Global USA Cashew Market Volume Kiloton Forecast, by Import Analysis (Value and Volume) 2020 & 2033
- Table 7: Global USA Cashew Market Revenue Million Forecast, by Export Analysis (Value and Volume) 2020 & 2033
- Table 8: Global USA Cashew Market Volume Kiloton Forecast, by Export Analysis (Value and Volume) 2020 & 2033
- Table 9: Global USA Cashew Market Revenue Million Forecast, by Price Trend Analysis 2020 & 2033
- Table 10: Global USA Cashew Market Volume Kiloton Forecast, by Price Trend Analysis 2020 & 2033
- Table 11: Global USA Cashew Market Revenue Million Forecast, by Production Analysis (Volume) 2020 & 2033
- Table 12: Global USA Cashew Market Volume Kiloton Forecast, by Production Analysis (Volume) 2020 & 2033
- Table 13: Global USA Cashew Market Revenue Million Forecast, by Consumption Analysis (Value and Volume) 2020 & 2033
- Table 14: Global USA Cashew Market Volume Kiloton Forecast, by Consumption Analysis (Value and Volume) 2020 & 2033
- Table 15: Global USA Cashew Market Revenue Million Forecast, by Import Analysis (Value and Volume) 2020 & 2033
- Table 16: Global USA Cashew Market Volume Kiloton Forecast, by Import Analysis (Value and Volume) 2020 & 2033
- Table 17: Global USA Cashew Market Revenue Million Forecast, by Export Analysis (Value and Volume) 2020 & 2033
- Table 18: Global USA Cashew Market Volume Kiloton Forecast, by Export Analysis (Value and Volume) 2020 & 2033
- Table 19: Global USA Cashew Market Revenue Million Forecast, by Price Trend Analysis 2020 & 2033
- Table 20: Global USA Cashew Market Volume Kiloton Forecast, by Price Trend Analysis 2020 & 2033
- Table 21: Global USA Cashew Market Revenue Million Forecast, by Region 2020 & 2033
- Table 22: Global USA Cashew Market Volume Kiloton Forecast, by Region 2020 & 2033
- Table 23: Global USA Cashew Market Revenue Million Forecast, by Production Analysis (Volume) 2020 & 2033
- Table 24: Global USA Cashew Market Volume Kiloton Forecast, by Production Analysis (Volume) 2020 & 2033
- Table 25: Global USA Cashew Market Revenue Million Forecast, by Consumption Analysis (Value and Volume) 2020 & 2033
- Table 26: Global USA Cashew Market Volume Kiloton Forecast, by Consumption Analysis (Value and Volume) 2020 & 2033
- Table 27: Global USA Cashew Market Revenue Million Forecast, by Import Analysis (Value and Volume) 2020 & 2033
- Table 28: Global USA Cashew Market Volume Kiloton Forecast, by Import Analysis (Value and Volume) 2020 & 2033
- Table 29: Global USA Cashew Market Revenue Million Forecast, by Export Analysis (Value and Volume) 2020 & 2033
- Table 30: Global USA Cashew Market Volume Kiloton Forecast, by Export Analysis (Value and Volume) 2020 & 2033
- Table 31: Global USA Cashew Market Revenue Million Forecast, by Price Trend Analysis 2020 & 2033
- Table 32: Global USA Cashew Market Volume Kiloton Forecast, by Price Trend Analysis 2020 & 2033
- Table 33: Global USA Cashew Market Revenue Million Forecast, by Production Analysis (Volume) 2020 & 2033
- Table 34: Global USA Cashew Market Volume Kiloton Forecast, by Production Analysis (Volume) 2020 & 2033
- Table 35: Global USA Cashew Market Revenue Million Forecast, by Consumption Analysis (Value and Volume) 2020 & 2033
- Table 36: Global USA Cashew Market Volume Kiloton Forecast, by Consumption Analysis (Value and Volume) 2020 & 2033
- Table 37: Global USA Cashew Market Revenue Million Forecast, by Import Analysis (Value and Volume) 2020 & 2033
- Table 38: Global USA Cashew Market Volume Kiloton Forecast, by Import Analysis (Value and Volume) 2020 & 2033
- Table 39: Global USA Cashew Market Revenue Million Forecast, by Export Analysis (Value and Volume) 2020 & 2033
- Table 40: Global USA Cashew Market Volume Kiloton Forecast, by Export Analysis (Value and Volume) 2020 & 2033
- Table 41: Global USA Cashew Market Revenue Million Forecast, by Price Trend Analysis 2020 & 2033
- Table 42: Global USA Cashew Market Volume Kiloton Forecast, by Price Trend Analysis 2020 & 2033
- Table 43: Global USA Cashew Market Revenue Million Forecast, by Country 2020 & 2033
- Table 44: Global USA Cashew Market Volume Kiloton Forecast, by Country 2020 & 2033
- Table 45: United States USA Cashew Market Revenue (Million) Forecast, by Application 2020 & 2033
- Table 46: United States USA Cashew Market Volume (Kiloton) Forecast, by Application 2020 & 2033
- Table 47: Canada USA Cashew Market Revenue (Million) Forecast, by Application 2020 & 2033
- Table 48: Canada USA Cashew Market Volume (Kiloton) Forecast, by Application 2020 & 2033
- Table 49: Mexico USA Cashew Market Revenue (Million) Forecast, by Application 2020 & 2033
- Table 50: Mexico USA Cashew Market Volume (Kiloton) Forecast, by Application 2020 & 2033
- Table 51: Global USA Cashew Market Revenue Million Forecast, by Production Analysis (Volume) 2020 & 2033
- Table 52: Global USA Cashew Market Volume Kiloton Forecast, by Production Analysis (Volume) 2020 & 2033
- Table 53: Global USA Cashew Market Revenue Million Forecast, by Consumption Analysis (Value and Volume) 2020 & 2033
- Table 54: Global USA Cashew Market Volume Kiloton Forecast, by Consumption Analysis (Value and Volume) 2020 & 2033
- Table 55: Global USA Cashew Market Revenue Million Forecast, by Import Analysis (Value and Volume) 2020 & 2033
- Table 56: Global USA Cashew Market Volume Kiloton Forecast, by Import Analysis (Value and Volume) 2020 & 2033
- Table 57: Global USA Cashew Market Revenue Million Forecast, by Export Analysis (Value and Volume) 2020 & 2033
- Table 58: Global USA Cashew Market Volume Kiloton Forecast, by Export Analysis (Value and Volume) 2020 & 2033
- Table 59: Global USA Cashew Market Revenue Million Forecast, by Price Trend Analysis 2020 & 2033
- Table 60: Global USA Cashew Market Volume Kiloton Forecast, by Price Trend Analysis 2020 & 2033
- Table 61: Global USA Cashew Market Revenue Million Forecast, by Production Analysis (Volume) 2020 & 2033
- Table 62: Global USA Cashew Market Volume Kiloton Forecast, by Production Analysis (Volume) 2020 & 2033
- Table 63: Global USA Cashew Market Revenue Million Forecast, by Consumption Analysis (Value and Volume) 2020 & 2033
- Table 64: Global USA Cashew Market Volume Kiloton Forecast, by Consumption Analysis (Value and Volume) 2020 & 2033
- Table 65: Global USA Cashew Market Revenue Million Forecast, by Import Analysis (Value and Volume) 2020 & 2033
- Table 66: Global USA Cashew Market Volume Kiloton Forecast, by Import Analysis (Value and Volume) 2020 & 2033
- Table 67: Global USA Cashew Market Revenue Million Forecast, by Export Analysis (Value and Volume) 2020 & 2033
- Table 68: Global USA Cashew Market Volume Kiloton Forecast, by Export Analysis (Value and Volume) 2020 & 2033
- Table 69: Global USA Cashew Market Revenue Million Forecast, by Price Trend Analysis 2020 & 2033
- Table 70: Global USA Cashew Market Volume Kiloton Forecast, by Price Trend Analysis 2020 & 2033
- Table 71: Global USA Cashew Market Revenue Million Forecast, by Country 2020 & 2033
- Table 72: Global USA Cashew Market Volume Kiloton Forecast, by Country 2020 & 2033
- Table 73: Brazil USA Cashew Market Revenue (Million) Forecast, by Application 2020 & 2033
- Table 74: Brazil USA Cashew Market Volume (Kiloton) Forecast, by Application 2020 & 2033
- Table 75: Argentina USA Cashew Market Revenue (Million) Forecast, by Application 2020 & 2033
- Table 76: Argentina USA Cashew Market Volume (Kiloton) Forecast, by Application 2020 & 2033
- Table 77: Rest of South America USA Cashew Market Revenue (Million) Forecast, by Application 2020 & 2033
- Table 78: Rest of South America USA Cashew Market Volume (Kiloton) Forecast, by Application 2020 & 2033
- Table 79: Global USA Cashew Market Revenue Million Forecast, by Production Analysis (Volume) 2020 & 2033
- Table 80: Global USA Cashew Market Volume Kiloton Forecast, by Production Analysis (Volume) 2020 & 2033
- Table 81: Global USA Cashew Market Revenue Million Forecast, by Consumption Analysis (Value and Volume) 2020 & 2033
- Table 82: Global USA Cashew Market Volume Kiloton Forecast, by Consumption Analysis (Value and Volume) 2020 & 2033
- Table 83: Global USA Cashew Market Revenue Million Forecast, by Import Analysis (Value and Volume) 2020 & 2033
- Table 84: Global USA Cashew Market Volume Kiloton Forecast, by Import Analysis (Value and Volume) 2020 & 2033
- Table 85: Global USA Cashew Market Revenue Million Forecast, by Export Analysis (Value and Volume) 2020 & 2033
- Table 86: Global USA Cashew Market Volume Kiloton Forecast, by Export Analysis (Value and Volume) 2020 & 2033
- Table 87: Global USA Cashew Market Revenue Million Forecast, by Price Trend Analysis 2020 & 2033
- Table 88: Global USA Cashew Market Volume Kiloton Forecast, by Price Trend Analysis 2020 & 2033
- Table 89: Global USA Cashew Market Revenue Million Forecast, by Production Analysis (Volume) 2020 & 2033
- Table 90: Global USA Cashew Market Volume Kiloton Forecast, by Production Analysis (Volume) 2020 & 2033
- Table 91: Global USA Cashew Market Revenue Million Forecast, by Consumption Analysis (Value and Volume) 2020 & 2033
- Table 92: Global USA Cashew Market Volume Kiloton Forecast, by Consumption Analysis (Value and Volume) 2020 & 2033
- Table 93: Global USA Cashew Market Revenue Million Forecast, by Import Analysis (Value and Volume) 2020 & 2033
- Table 94: Global USA Cashew Market Volume Kiloton Forecast, by Import Analysis (Value and Volume) 2020 & 2033
- Table 95: Global USA Cashew Market Revenue Million Forecast, by Export Analysis (Value and Volume) 2020 & 2033
- Table 96: Global USA Cashew Market Volume Kiloton Forecast, by Export Analysis (Value and Volume) 2020 & 2033
- Table 97: Global USA Cashew Market Revenue Million Forecast, by Price Trend Analysis 2020 & 2033
- Table 98: Global USA Cashew Market Volume Kiloton Forecast, by Price Trend Analysis 2020 & 2033
- Table 99: Global USA Cashew Market Revenue Million Forecast, by Country 2020 & 2033
- Table 100: Global USA Cashew Market Volume Kiloton Forecast, by Country 2020 & 2033
- Table 101: United Kingdom USA Cashew Market Revenue (Million) Forecast, by Application 2020 & 2033
- Table 102: United Kingdom USA Cashew Market Volume (Kiloton) Forecast, by Application 2020 & 2033
- Table 103: Germany USA Cashew Market Revenue (Million) Forecast, by Application 2020 & 2033
- Table 104: Germany USA Cashew Market Volume (Kiloton) Forecast, by Application 2020 & 2033
- Table 105: France USA Cashew Market Revenue (Million) Forecast, by Application 2020 & 2033
- Table 106: France USA Cashew Market Volume (Kiloton) Forecast, by Application 2020 & 2033
- Table 107: Italy USA Cashew Market Revenue (Million) Forecast, by Application 2020 & 2033
- Table 108: Italy USA Cashew Market Volume (Kiloton) Forecast, by Application 2020 & 2033
- Table 109: Spain USA Cashew Market Revenue (Million) Forecast, by Application 2020 & 2033
- Table 110: Spain USA Cashew Market Volume (Kiloton) Forecast, by Application 2020 & 2033
- Table 111: Russia USA Cashew Market Revenue (Million) Forecast, by Application 2020 & 2033
- Table 112: Russia USA Cashew Market Volume (Kiloton) Forecast, by Application 2020 & 2033
- Table 113: Benelux USA Cashew Market Revenue (Million) Forecast, by Application 2020 & 2033
- Table 114: Benelux USA Cashew Market Volume (Kiloton) Forecast, by Application 2020 & 2033
- Table 115: Nordics USA Cashew Market Revenue (Million) Forecast, by Application 2020 & 2033
- Table 116: Nordics USA Cashew Market Volume (Kiloton) Forecast, by Application 2020 & 2033
- Table 117: Rest of Europe USA Cashew Market Revenue (Million) Forecast, by Application 2020 & 2033
- Table 118: Rest of Europe USA Cashew Market Volume (Kiloton) Forecast, by Application 2020 & 2033
- Table 119: Global USA Cashew Market Revenue Million Forecast, by Production Analysis (Volume) 2020 & 2033
- Table 120: Global USA Cashew Market Volume Kiloton Forecast, by Production Analysis (Volume) 2020 & 2033
- Table 121: Global USA Cashew Market Revenue Million Forecast, by Consumption Analysis (Value and Volume) 2020 & 2033
- Table 122: Global USA Cashew Market Volume Kiloton Forecast, by Consumption Analysis (Value and Volume) 2020 & 2033
- Table 123: Global USA Cashew Market Revenue Million Forecast, by Import Analysis (Value and Volume) 2020 & 2033
- Table 124: Global USA Cashew Market Volume Kiloton Forecast, by Import Analysis (Value and Volume) 2020 & 2033
- Table 125: Global USA Cashew Market Revenue Million Forecast, by Export Analysis (Value and Volume) 2020 & 2033
- Table 126: Global USA Cashew Market Volume Kiloton Forecast, by Export Analysis (Value and Volume) 2020 & 2033
- Table 127: Global USA Cashew Market Revenue Million Forecast, by Price Trend Analysis 2020 & 2033
- Table 128: Global USA Cashew Market Volume Kiloton Forecast, by Price Trend Analysis 2020 & 2033
- Table 129: Global USA Cashew Market Revenue Million Forecast, by Production Analysis (Volume) 2020 & 2033
- Table 130: Global USA Cashew Market Volume Kiloton Forecast, by Production Analysis (Volume) 2020 & 2033
- Table 131: Global USA Cashew Market Revenue Million Forecast, by Consumption Analysis (Value and Volume) 2020 & 2033
- Table 132: Global USA Cashew Market Volume Kiloton Forecast, by Consumption Analysis (Value and Volume) 2020 & 2033
- Table 133: Global USA Cashew Market Revenue Million Forecast, by Import Analysis (Value and Volume) 2020 & 2033
- Table 134: Global USA Cashew Market Volume Kiloton Forecast, by Import Analysis (Value and Volume) 2020 & 2033
- Table 135: Global USA Cashew Market Revenue Million Forecast, by Export Analysis (Value and Volume) 2020 & 2033
- Table 136: Global USA Cashew Market Volume Kiloton Forecast, by Export Analysis (Value and Volume) 2020 & 2033
- Table 137: Global USA Cashew Market Revenue Million Forecast, by Price Trend Analysis 2020 & 2033
- Table 138: Global USA Cashew Market Volume Kiloton Forecast, by Price Trend Analysis 2020 & 2033
- Table 139: Global USA Cashew Market Revenue Million Forecast, by Country 2020 & 2033
- Table 140: Global USA Cashew Market Volume Kiloton Forecast, by Country 2020 & 2033
- Table 141: Turkey USA Cashew Market Revenue (Million) Forecast, by Application 2020 & 2033
- Table 142: Turkey USA Cashew Market Volume (Kiloton) Forecast, by Application 2020 & 2033
- Table 143: Israel USA Cashew Market Revenue (Million) Forecast, by Application 2020 & 2033
- Table 144: Israel USA Cashew Market Volume (Kiloton) Forecast, by Application 2020 & 2033
- Table 145: GCC USA Cashew Market Revenue (Million) Forecast, by Application 2020 & 2033
- Table 146: GCC USA Cashew Market Volume (Kiloton) Forecast, by Application 2020 & 2033
- Table 147: North Africa USA Cashew Market Revenue (Million) Forecast, by Application 2020 & 2033
- Table 148: North Africa USA Cashew Market Volume (Kiloton) Forecast, by Application 2020 & 2033
- Table 149: South Africa USA Cashew Market Revenue (Million) Forecast, by Application 2020 & 2033
- Table 150: South Africa USA Cashew Market Volume (Kiloton) Forecast, by Application 2020 & 2033
- Table 151: Rest of Middle East & Africa USA Cashew Market Revenue (Million) Forecast, by Application 2020 & 2033
- Table 152: Rest of Middle East & Africa USA Cashew Market Volume (Kiloton) Forecast, by Application 2020 & 2033
- Table 153: Global USA Cashew Market Revenue Million Forecast, by Production Analysis (Volume) 2020 & 2033
- Table 154: Global USA Cashew Market Volume Kiloton Forecast, by Production Analysis (Volume) 2020 & 2033
- Table 155: Global USA Cashew Market Revenue Million Forecast, by Consumption Analysis (Value and Volume) 2020 & 2033
- Table 156: Global USA Cashew Market Volume Kiloton Forecast, by Consumption Analysis (Value and Volume) 2020 & 2033
- Table 157: Global USA Cashew Market Revenue Million Forecast, by Import Analysis (Value and Volume) 2020 & 2033
- Table 158: Global USA Cashew Market Volume Kiloton Forecast, by Import Analysis (Value and Volume) 2020 & 2033
- Table 159: Global USA Cashew Market Revenue Million Forecast, by Export Analysis (Value and Volume) 2020 & 2033
- Table 160: Global USA Cashew Market Volume Kiloton Forecast, by Export Analysis (Value and Volume) 2020 & 2033
- Table 161: Global USA Cashew Market Revenue Million Forecast, by Price Trend Analysis 2020 & 2033
- Table 162: Global USA Cashew Market Volume Kiloton Forecast, by Price Trend Analysis 2020 & 2033
- Table 163: Global USA Cashew Market Revenue Million Forecast, by Production Analysis (Volume) 2020 & 2033
- Table 164: Global USA Cashew Market Volume Kiloton Forecast, by Production Analysis (Volume) 2020 & 2033
- Table 165: Global USA Cashew Market Revenue Million Forecast, by Consumption Analysis (Value and Volume) 2020 & 2033
- Table 166: Global USA Cashew Market Volume Kiloton Forecast, by Consumption Analysis (Value and Volume) 2020 & 2033
- Table 167: Global USA Cashew Market Revenue Million Forecast, by Import Analysis (Value and Volume) 2020 & 2033
- Table 168: Global USA Cashew Market Volume Kiloton Forecast, by Import Analysis (Value and Volume) 2020 & 2033
- Table 169: Global USA Cashew Market Revenue Million Forecast, by Export Analysis (Value and Volume) 2020 & 2033
- Table 170: Global USA Cashew Market Volume Kiloton Forecast, by Export Analysis (Value and Volume) 2020 & 2033
- Table 171: Global USA Cashew Market Revenue Million Forecast, by Price Trend Analysis 2020 & 2033
- Table 172: Global USA Cashew Market Volume Kiloton Forecast, by Price Trend Analysis 2020 & 2033
- Table 173: Global USA Cashew Market Revenue Million Forecast, by Country 2020 & 2033
- Table 174: Global USA Cashew Market Volume Kiloton Forecast, by Country 2020 & 2033
- Table 175: China USA Cashew Market Revenue (Million) Forecast, by Application 2020 & 2033
- Table 176: China USA Cashew Market Volume (Kiloton) Forecast, by Application 2020 & 2033
- Table 177: India USA Cashew Market Revenue (Million) Forecast, by Application 2020 & 2033
- Table 178: India USA Cashew Market Volume (Kiloton) Forecast, by Application 2020 & 2033
- Table 179: Japan USA Cashew Market Revenue (Million) Forecast, by Application 2020 & 2033
- Table 180: Japan USA Cashew Market Volume (Kiloton) Forecast, by Application 2020 & 2033
- Table 181: South Korea USA Cashew Market Revenue (Million) Forecast, by Application 2020 & 2033
- Table 182: South Korea USA Cashew Market Volume (Kiloton) Forecast, by Application 2020 & 2033
- Table 183: ASEAN USA Cashew Market Revenue (Million) Forecast, by Application 2020 & 2033
- Table 184: ASEAN USA Cashew Market Volume (Kiloton) Forecast, by Application 2020 & 2033
- Table 185: Oceania USA Cashew Market Revenue (Million) Forecast, by Application 2020 & 2033
- Table 186: Oceania USA Cashew Market Volume (Kiloton) Forecast, by Application 2020 & 2033
- Table 187: Rest of Asia Pacific USA Cashew Market Revenue (Million) Forecast, by Application 2020 & 2033
- Table 188: Rest of Asia Pacific USA Cashew Market Volume (Kiloton) Forecast, by Application 2020 & 2033
Frequently Asked Questions
1. What is the projected Compound Annual Growth Rate (CAGR) of the USA Cashew Market?
The projected CAGR is approximately 5.00%.
2. Which companies are prominent players in the USA Cashew Market?
Key companies in the market include Archer Daniels Midland Company , The Kraft Heinz Company, Waterford Foods, Olam International , Diamond Foods .
3. What are the main segments of the USA Cashew Market?
The market segments include Production Analysis (Volume), Consumption Analysis (Value and Volume), Import Analysis (Value and Volume), Export Analysis (Value and Volume), Price Trend Analysis, Production Analysis (Volume), Consumption Analysis (Value and Volume), Import Analysis (Value and Volume), Export Analysis (Value and Volume), Price Trend Analysis.
4. Can you provide details about the market size?
The market size is estimated to be USD XXX Million as of 2022.
5. What are some drivers contributing to market growth?
Rising Consumption of Cashew Nuts in the Country; Favorable Government Initiatives.
6. What are the notable trends driving market growth?
Health Benefits of Cashew Nuts Increases Consumption.
7. Are there any restraints impacting market growth?
Hazardous Climatic Condition Hinders Cashew Production; Stringent Regulations Related to Food Quality Standards.
8. Can you provide examples of recent developments in the market?
February 2023: New Organic Cashew Milk and Blue Cold-Pressed Juice were launched under the brand Clean Juice, which is a USDA-organic certified cold-pressed cashew milk.
9. What pricing options are available for accessing the report?
Pricing options include single-user, multi-user, and enterprise licenses priced at USD 3800, USD 4500, and USD 5800 respectively.
10. Is the market size provided in terms of value or volume?
The market size is provided in terms of value, measured in Million and volume, measured in Kiloton.
11. Are there any specific market keywords associated with the report?
Yes, the market keyword associated with the report is "USA Cashew Market," which aids in identifying and referencing the specific market segment covered.
12. How do I determine which pricing option suits my needs best?
The pricing options vary based on user requirements and access needs. Individual users may opt for single-user licenses, while businesses requiring broader access may choose multi-user or enterprise licenses for cost-effective access to the report.
13. Are there any additional resources or data provided in the USA Cashew Market report?
While the report offers comprehensive insights, it's advisable to review the specific contents or supplementary materials provided to ascertain if additional resources or data are available.
14. How can I stay updated on further developments or reports in the USA Cashew Market?
To stay informed about further developments, trends, and reports in the USA Cashew Market, consider subscribing to industry newsletters, following relevant companies and organizations, or regularly checking reputable industry news sources and publications.
Methodology
Step 1 - Identification of Relevant Samples Size from Population Database


Step 2 - Approaches for Defining Global Market Size (Value, Volume* & Price*)

Note*: In applicable scenarios
Step 3 - Data Sources
Primary Research
- Web Analytics
- Survey Reports
- Research Institute
- Latest Research Reports
- Opinion Leaders
Secondary Research
- Annual Reports
- White Paper
- Latest Press Release
- Industry Association
- Paid Database
- Investor Presentations

Step 4 - Data Triangulation
Involves using different sources of information in order to increase the validity of a study
These sources are likely to be stakeholders in a program - participants, other researchers, program staff, other community members, and so on.
Then we put all data in single framework & apply various statistical tools to find out the dynamic on the market.
During the analysis stage, feedback from the stakeholder groups would be compared to determine areas of agreement as well as areas of divergence