

Key Insights
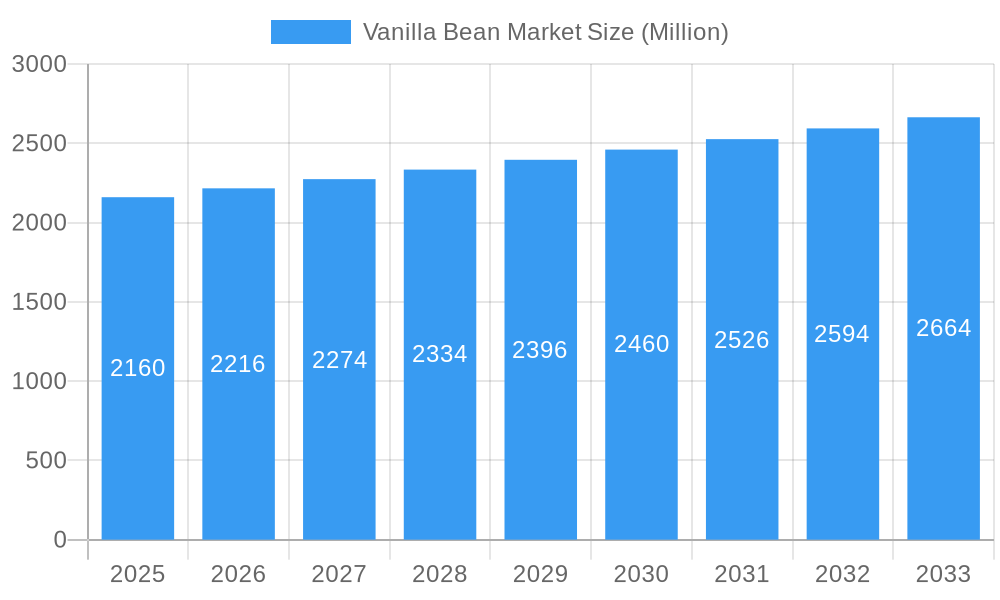
The global vanilla bean market, valued at $2.16 billion in 2025, is projected to experience steady growth, driven by increasing consumer demand for natural flavors and ingredients in food and beverages. The market's Compound Annual Growth Rate (CAGR) of 2.60% from 2025 to 2033 indicates a consistent expansion, fueled by several key factors. Growing popularity of gourmet foods and artisanal products is significantly boosting the demand for high-quality vanilla beans. The rising adoption of vanilla extract and other vanilla-based products in the cosmetics and pharmaceutical industries also contributes to market growth. Organic vanilla beans are witnessing a particularly strong surge in popularity due to the increasing awareness of health and sustainability among consumers. However, the market faces challenges such as fluctuating vanilla bean prices due to climate change and dependence on specific geographical regions for production. Furthermore, the availability of synthetic vanilla substitutes presents a competitive threat, though the natural authenticity of vanilla beans remains highly valued. Market segmentation reveals that whole vanilla beans retain a significant market share, followed by extracts, paste, and powder. The food and beverage industry remains the dominant application segment, followed by cosmetics and pharmaceuticals. North America and Europe currently hold significant market share, but Asia Pacific shows promising growth potential due to rising disposable incomes and increased consumption of Westernized foods. Leading companies, including E. Guittard & Co., Beanilla, McCormick & Company, and others are continuously innovating and expanding their product offerings to cater to the evolving consumer preferences and global demand for this versatile ingredient.
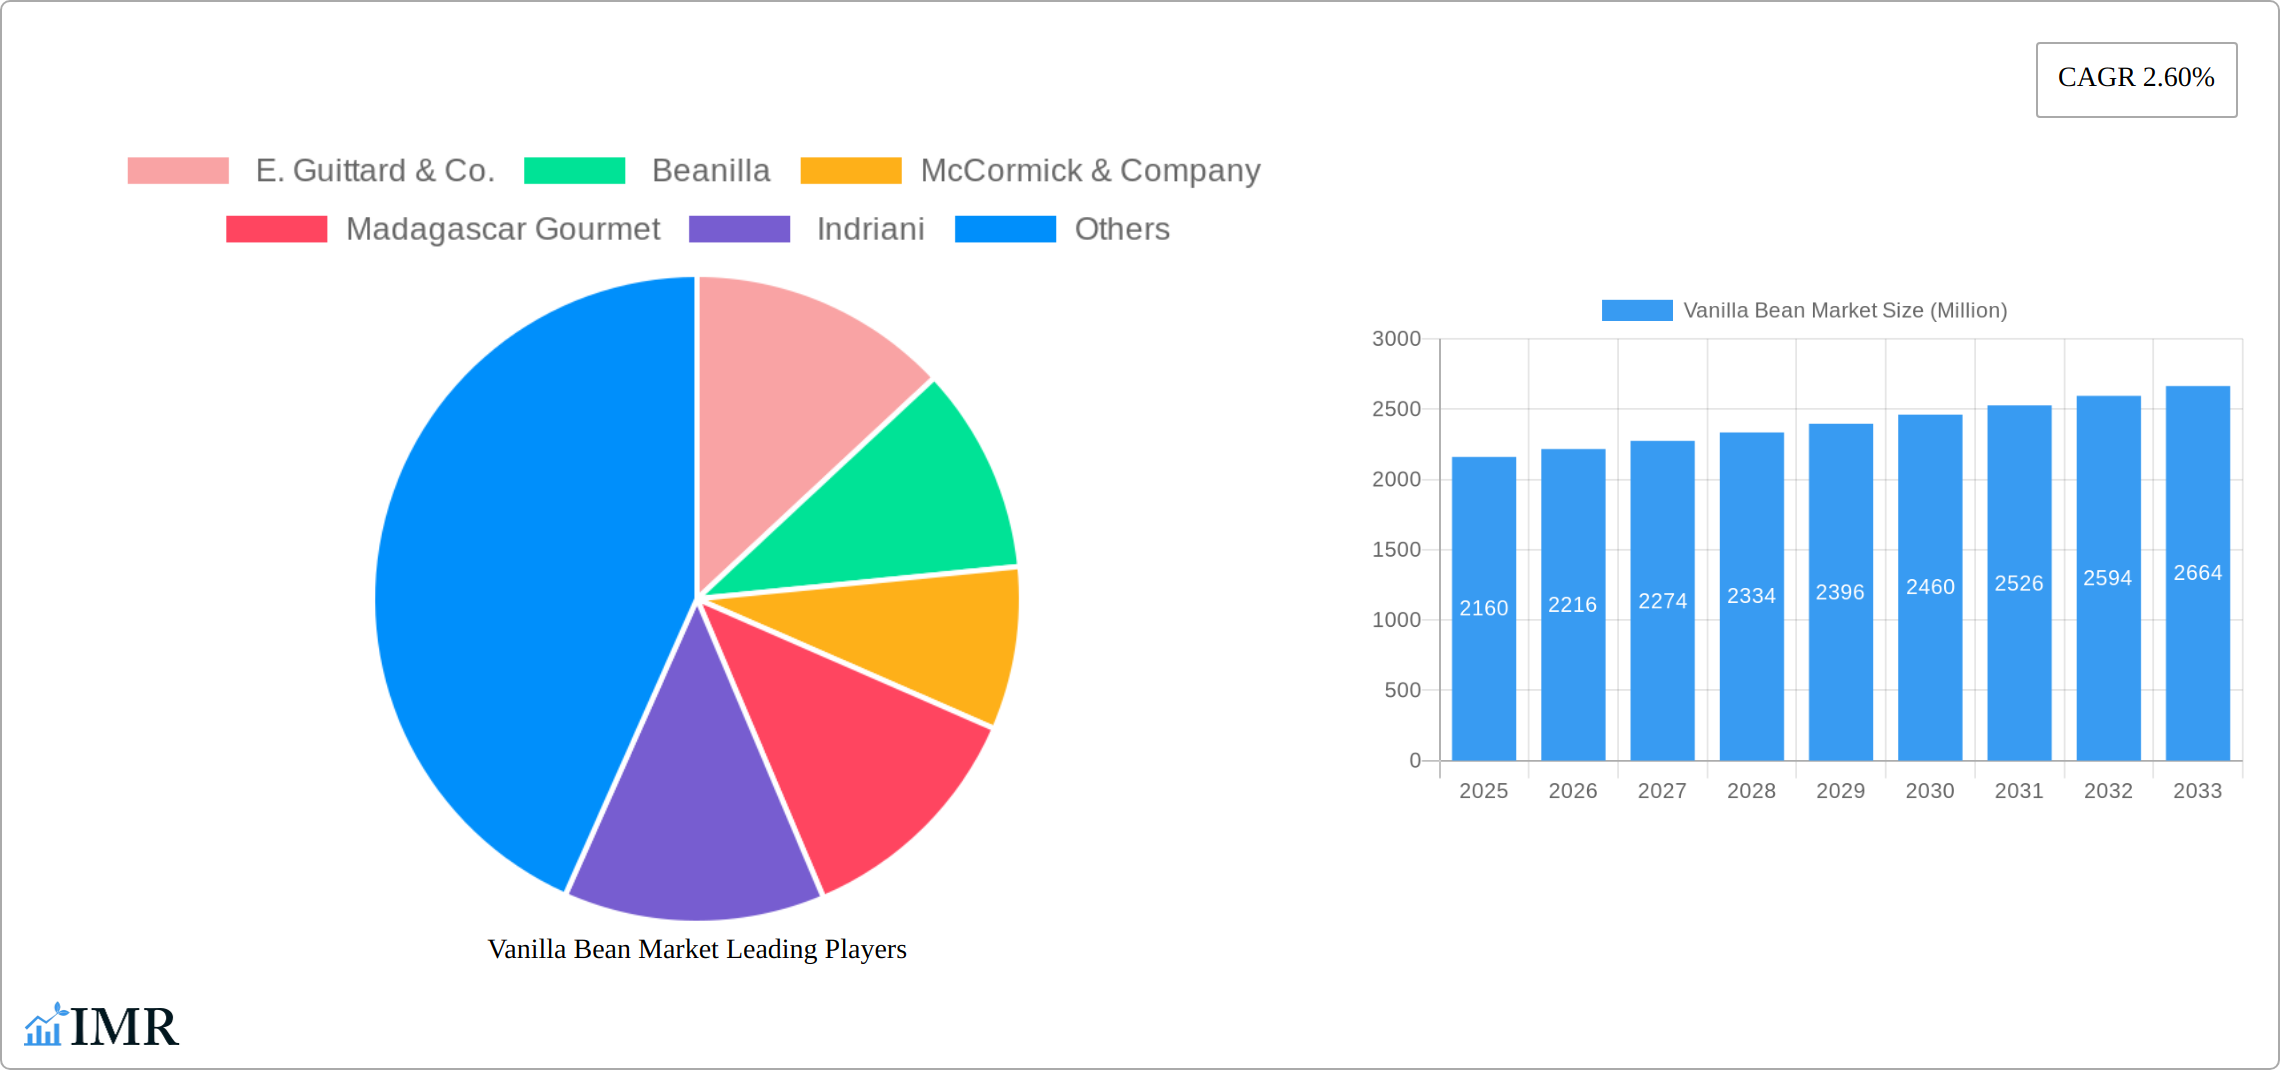
Vanilla Bean Market Market Size (In Billion)
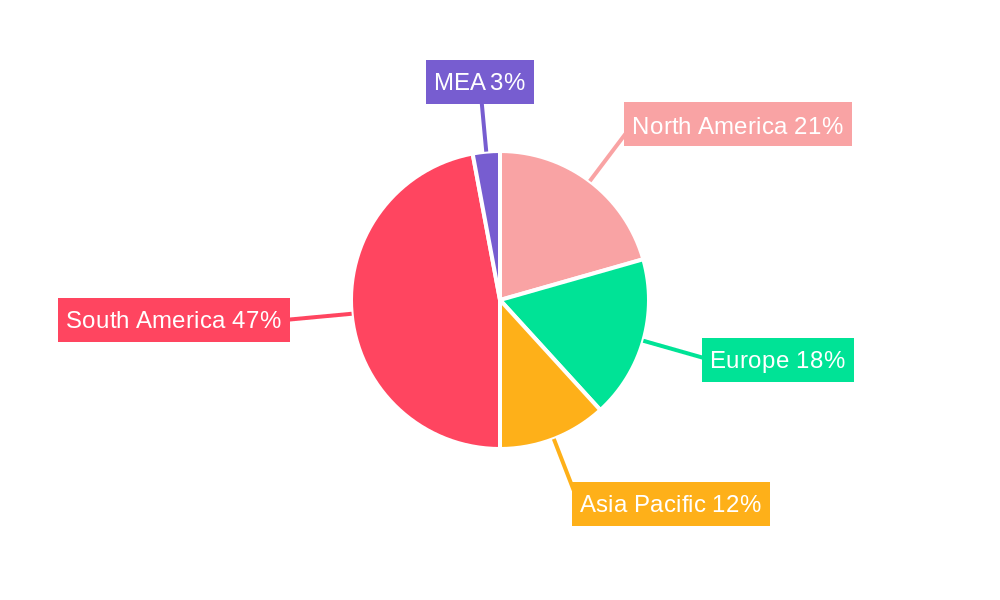
The regional distribution of the vanilla bean market displays a concentration in established markets, with North America and Europe leading in consumption. However, developing economies in Asia-Pacific show considerable growth potential, driven by increasing demand for Westernized food products and a rising middle class with increased disposable income. South America, a major vanilla producer, is anticipated to witness stable growth, driven both by domestic consumption and exports. The Middle East and Africa, while currently holding a smaller market share, are expected to show gradual growth, primarily driven by increased adoption of vanilla-based products within the food and beverage sectors. Competition within the market is shaped by a blend of established multinational players and specialized niche producers, leading to a diverse range of product offerings in terms of quality, origin, and price points. This competitive landscape drives innovation and ensures a continuous supply of vanilla bean products to meet evolving market demands.
Vanilla Bean Market Company Market Share
Vanilla Bean Market: A Comprehensive Report (2019-2033)
This in-depth report provides a comprehensive analysis of the Vanilla Bean Market, encompassing market dynamics, growth trends, regional dominance, product landscape, and key players. With a study period spanning 2019-2033, a base year of 2025, and a forecast period of 2025-2033, this report offers invaluable insights for industry professionals, investors, and strategists. The report utilizes data from the historical period (2019-2024) to project future market trends. The total market value is predicted to be xx Million in 2025.
Vanilla Bean Market Dynamics & Structure
This section analyzes the market's competitive landscape, technological advancements, regulatory influences, and industry trends. The vanilla bean market exhibits a moderately concentrated structure, with key players like McCormick & Company and Nielsen-Massey Vanillas holding significant market share. However, the presence of smaller, specialized players like Beanilla and VanillaVida introduces competitive dynamism.
- Market Concentration: The market is characterized by a mix of large multinational corporations and smaller niche players, leading to both consolidated and fragmented segments. The top 5 players are estimated to hold xx% of the market share in 2025.
- Technological Innovation: Advancements in extraction techniques, particularly those employed by companies like VanillaVida using image processing, are driving improvements in flavor quality and yield.
- Regulatory Frameworks: Food safety regulations and organic certification standards impact production and labeling practices, influencing consumer choices. Variations in regulations across different regions introduce complexities for global players.
- Competitive Product Substitutes: Artificial vanilla flavorings offer a cheaper alternative, posing a challenge to natural vanilla beans, particularly in budget-conscious segments.
- End-User Demographics: The food and beverage industry is a primary driver, with growing demand from health-conscious consumers fueling the organic segment's expansion.
- M&A Trends: While specific M&A deal volumes are unavailable (xx), the market anticipates consolidation as larger players seek to expand their product portfolio and geographic reach. Innovation-driven acquisitions are also expected.
Vanilla Bean Market Growth Trends & Insights
The vanilla bean market has experienced robust growth over the past five years, driven by a confluence of factors. Increased consumer demand for natural and premium flavors in gourmet foods and beverages is a primary driver. This trend is amplified by the rising popularity of organic products and the expanding applications of vanilla beyond traditional uses, including cosmetics and pharmaceuticals. The Compound Annual Growth Rate (CAGR) for the historical period (2019-2024) is estimated at xx%, while the projected CAGR for the forecast period (2025-2033) is xx%. Market penetration within the food and beverage segment is projected to increase by xx% by 2033. Furthermore, technological advancements, such as refined extraction methods and innovative cultivation techniques, are significantly boosting both production efficiency and the overall quality of vanilla flavor profiles, thus positively impacting market growth. The evolving consumer preference for high-quality, natural ingredients further solidifies the strong demand for premium vanilla beans.
Dominant Regions, Countries, or Segments in Vanilla Bean Market
Madagascar maintains its position as the leading global producer of vanilla beans, commanding approximately xx% of the global market share in 2025. This dominance stems from its favorable climatic conditions, established cultivation infrastructure, and the expertise of its numerous farmers. The northeastern Sava region is particularly significant in this production. The food industry continues to be the largest application segment, followed by the cosmetics and pharmaceutical industries which are experiencing increasing demand for natural ingredients.
- Key Drivers (Madagascar):
- Well-established and extensive cultivation infrastructure.
- Optimum climate and soil conditions ideally suited for vanilla bean growth.
- A substantial and experienced workforce of approximately 80,000 farmers engaged in vanilla production (as of June 2022).
- Segment Dominance: Whole vanilla beans represent the dominant segment by value, followed by vanilla extract. The organic vanilla bean segment shows particularly strong growth potential, fueled by increasing consumer health consciousness and demand for sustainably sourced products.
- Growth Potential: Significant growth opportunities exist through expansion into emerging markets and increased penetration into the cosmetics and pharmaceutical sectors, where high-quality vanilla extract is increasingly valued for its aroma and potential health benefits.
Vanilla Bean Market Product Landscape
The vanilla bean market offers various product types, including whole vanilla beans, extracts, pastes, and powders. Recent innovations include improved extraction techniques enhancing flavor concentration and the development of ready-to-use pastes, as exemplified by Nielsen-Massey Vanillas' 2020 product launch. These advancements cater to different consumer needs and application requirements, offering convenient and flavorful alternatives. Unique selling propositions focus on origin, sustainability, and superior flavor profiles, emphasizing organic and premium options.
Key Drivers, Barriers & Challenges in Vanilla Bean Market
Key Drivers: Rising consumer demand for natural and organic food products, the increasing use of vanilla in diverse applications, and technological advancements leading to improved extraction and processing methods are driving the market's growth.
Key Challenges: Fluctuations in vanilla bean prices due to factors such as climate change and crop yields, the availability of inexpensive artificial vanilla substitutes, and supply chain disruptions caused by geopolitical events pose significant challenges to the market. The impact on market value is estimated at xx Million annually due to price fluctuations alone.
Emerging Opportunities in Vanilla Bean Market
Untapped markets in Asia and Africa, increasing demand for vanilla in specialized applications (e.g., functional foods and nutraceuticals), and the growing trend towards personalized and customized vanilla products represent significant emerging opportunities. Developing sustainable and ethical sourcing practices will also create new market niches.
Growth Accelerators in the Vanilla Bean Market Industry
Several key factors are accelerating growth within the vanilla bean market. These include continuous advancements in cultivation techniques leading to higher yields and improved quality, the implementation of more efficient processing methods, the development of strategic partnerships to ensure the stability and reliability of the supply chain, and the successful expansion into new geographical markets. Crucially, ongoing investment in research and development (R&D) focused on creating innovative vanilla-based products will be essential in driving long-term, sustainable growth.
Key Players Shaping the Vanilla Bean Market Market
- E. Guittard & Co.
- Beanilla
- McCormick & Company
- Madagascar Gourmet
- Indriani
- VanillaVida
- Nielsen-Massey Vanillas
Notable Milestones in Vanilla Bean Market Sector
- June 2022: Approximately 25,000 hectares of land in Madagascar were dedicated to vanilla cultivation, employing around 80,000 farmers. This underscores the significant scale of production and the industry's regional concentration in Madagascar.
- September 2022: Vanilla Vida's pioneering use of image processing and non-GMO methods in vanilla production represents a significant technological advancement, positively impacting flavor quality and yield.
- January 2020: Nielsen-Massey Vanillas' introduction of 2-oz. vanilla bean paste bottles enhanced product accessibility and demonstrated responsiveness to consumer demand for convenient, smaller-sized packaging.
In-Depth Vanilla Bean Market Market Outlook
The vanilla bean market shows significant long-term growth potential, driven by sustained demand for natural flavors and ongoing technological advancements. Strategic partnerships focusing on sustainable sourcing, investments in R&D to develop innovative products, and expansion into new markets will be crucial for players seeking to capitalize on this opportunity. The market is projected to achieve a value of xx Million by 2033, representing a substantial increase from its current level.
Vanilla Bean Market Segmentation
- 1. Production Analysis
- 2. Consumption Analysis
- 3. Import Market Analysis (Value & Volume)
- 4. Export Market Analysis (Value & Volume)
- 5. Price Trend Analysis
Vanilla Bean Market Segmentation By Geography
- 1. United States
- 2. Canada
- 3. Mexico
- 4. Germany
- 5. France
- 6. Netherlands
- 7. Japan
- 8. Indonesia
- 9. China
- 10. Madagascar
- 11. Papua New Guinea
- 12. Uganda
Vanilla Bean Market Regional Market Share
Geographic Coverage of Vanilla Bean Market
Vanilla Bean Market REPORT HIGHLIGHTS
| Aspects | Details |
|---|---|
| Study Period | 2020-2034 |
| Base Year | 2025 |
| Estimated Year | 2026 |
| Forecast Period | 2026-2034 |
| Historical Period | 2020-2025 |
| Growth Rate | CAGR of 2.60% from 2020-2034 |
| Segmentation |
|
Table of Contents
- 1. Introduction
- 1.1. Research Scope
- 1.2. Market Segmentation
- 1.3. Research Objective
- 1.4. Definitions and Assumptions
- 2. Executive Summary
- 2.1. Market Snapshot
- 3. Market Dynamics
- 3.1. Market Drivers
- 3.2. Market Restrains
- 3.3. Market Trends
- 3.4. Market Opportunities
- 4. Market Factor Analysis
- 4.1. Porters Five Forces
- 4.1.1. Bargaining Power of Suppliers
- 4.1.2. Bargaining Power of Buyers
- 4.1.3. Threat of New Entrants
- 4.1.4. Threat of Substitutes
- 4.1.5. Competitive Rivalry
- 4.2. PESTEL analysis
- 4.3. BCG Analysis
- 4.3.1. Stars (High Growth, High Market Share)
- 4.3.2. Cash Cows (Low Growth, High Market Share)
- 4.3.3. Question Mark (High Growth, Low Market Share)
- 4.3.4. Dogs (Low Growth, Low Market Share)
- 4.4. Ansoff Matrix Analysis
- 4.5. Supply Chain Analysis
- 4.6. Regulatory Landscape
- 4.7. Current Market Potential and Opportunity Assessment (TAM–SAM–SOM Framework)
- 4.8. IMR Analyst Note
- 4.1. Porters Five Forces
- 5. Market Analysis, Insights and Forecast 2021-2033
- 5.1. Market Analysis, Insights and Forecast - by Production Analysis
- 5.2. Market Analysis, Insights and Forecast - by Consumption Analysis
- 5.3. Market Analysis, Insights and Forecast - by Import Market Analysis (Value & Volume)
- 5.4. Market Analysis, Insights and Forecast - by Export Market Analysis (Value & Volume)
- 5.5. Market Analysis, Insights and Forecast - by Price Trend Analysis
- 5.6. Market Analysis, Insights and Forecast - by Region
- 5.6.1. United States
- 5.6.2. Canada
- 5.6.3. Mexico
- 5.6.4. Germany
- 5.6.5. France
- 5.6.6. Netherlands
- 5.6.7. Japan
- 5.6.8. Indonesia
- 5.6.9. China
- 5.6.10. Madagascar
- 5.6.11. Papua New Guinea
- 5.6.12. Uganda
- 6. Global Vanilla Bean Market Analysis, Insights and Forecast, 2021-2033
- 6.1. Market Analysis, Insights and Forecast - by Production Analysis
- 6.2. Market Analysis, Insights and Forecast - by Consumption Analysis
- 6.3. Market Analysis, Insights and Forecast - by Import Market Analysis (Value & Volume)
- 6.4. Market Analysis, Insights and Forecast - by Export Market Analysis (Value & Volume)
- 6.5. Market Analysis, Insights and Forecast - by Price Trend Analysis
- 7. United States Vanilla Bean Market Analysis, Insights and Forecast, 2020-2032
- 7.1. Market Analysis, Insights and Forecast - by Production Analysis
- 7.2. Market Analysis, Insights and Forecast - by Consumption Analysis
- 7.3. Market Analysis, Insights and Forecast - by Import Market Analysis (Value & Volume)
- 7.4. Market Analysis, Insights and Forecast - by Export Market Analysis (Value & Volume)
- 7.5. Market Analysis, Insights and Forecast - by Price Trend Analysis
- 8. Canada Vanilla Bean Market Analysis, Insights and Forecast, 2020-2032
- 8.1. Market Analysis, Insights and Forecast - by Production Analysis
- 8.2. Market Analysis, Insights and Forecast - by Consumption Analysis
- 8.3. Market Analysis, Insights and Forecast - by Import Market Analysis (Value & Volume)
- 8.4. Market Analysis, Insights and Forecast - by Export Market Analysis (Value & Volume)
- 8.5. Market Analysis, Insights and Forecast - by Price Trend Analysis
- 9. Mexico Vanilla Bean Market Analysis, Insights and Forecast, 2020-2032
- 9.1. Market Analysis, Insights and Forecast - by Production Analysis
- 9.2. Market Analysis, Insights and Forecast - by Consumption Analysis
- 9.3. Market Analysis, Insights and Forecast - by Import Market Analysis (Value & Volume)
- 9.4. Market Analysis, Insights and Forecast - by Export Market Analysis (Value & Volume)
- 9.5. Market Analysis, Insights and Forecast - by Price Trend Analysis
- 10. Germany Vanilla Bean Market Analysis, Insights and Forecast, 2020-2032
- 10.1. Market Analysis, Insights and Forecast - by Production Analysis
- 10.2. Market Analysis, Insights and Forecast - by Consumption Analysis
- 10.3. Market Analysis, Insights and Forecast - by Import Market Analysis (Value & Volume)
- 10.4. Market Analysis, Insights and Forecast - by Export Market Analysis (Value & Volume)
- 10.5. Market Analysis, Insights and Forecast - by Price Trend Analysis
- 11. France Vanilla Bean Market Analysis, Insights and Forecast, 2020-2032
- 11.1. Market Analysis, Insights and Forecast - by Production Analysis
- 11.2. Market Analysis, Insights and Forecast - by Consumption Analysis
- 11.3. Market Analysis, Insights and Forecast - by Import Market Analysis (Value & Volume)
- 11.4. Market Analysis, Insights and Forecast - by Export Market Analysis (Value & Volume)
- 11.5. Market Analysis, Insights and Forecast - by Price Trend Analysis
- 12. Netherlands Vanilla Bean Market Analysis, Insights and Forecast, 2020-2032
- 12.1. Market Analysis, Insights and Forecast - by Production Analysis
- 12.2. Market Analysis, Insights and Forecast - by Consumption Analysis
- 12.3. Market Analysis, Insights and Forecast - by Import Market Analysis (Value & Volume)
- 12.4. Market Analysis, Insights and Forecast - by Export Market Analysis (Value & Volume)
- 12.5. Market Analysis, Insights and Forecast - by Price Trend Analysis
- 13. Japan Vanilla Bean Market Analysis, Insights and Forecast, 2020-2032
- 13.1. Market Analysis, Insights and Forecast - by Production Analysis
- 13.2. Market Analysis, Insights and Forecast - by Consumption Analysis
- 13.3. Market Analysis, Insights and Forecast - by Import Market Analysis (Value & Volume)
- 13.4. Market Analysis, Insights and Forecast - by Export Market Analysis (Value & Volume)
- 13.5. Market Analysis, Insights and Forecast - by Price Trend Analysis
- 14. Indonesia Vanilla Bean Market Analysis, Insights and Forecast, 2020-2032
- 14.1. Market Analysis, Insights and Forecast - by Production Analysis
- 14.2. Market Analysis, Insights and Forecast - by Consumption Analysis
- 14.3. Market Analysis, Insights and Forecast - by Import Market Analysis (Value & Volume)
- 14.4. Market Analysis, Insights and Forecast - by Export Market Analysis (Value & Volume)
- 14.5. Market Analysis, Insights and Forecast - by Price Trend Analysis
- 15. China Vanilla Bean Market Analysis, Insights and Forecast, 2020-2032
- 15.1. Market Analysis, Insights and Forecast - by Production Analysis
- 15.2. Market Analysis, Insights and Forecast - by Consumption Analysis
- 15.3. Market Analysis, Insights and Forecast - by Import Market Analysis (Value & Volume)
- 15.4. Market Analysis, Insights and Forecast - by Export Market Analysis (Value & Volume)
- 15.5. Market Analysis, Insights and Forecast - by Price Trend Analysis
- 16. Madagascar Vanilla Bean Market Analysis, Insights and Forecast, 2020-2032
- 16.1. Market Analysis, Insights and Forecast - by Production Analysis
- 16.2. Market Analysis, Insights and Forecast - by Consumption Analysis
- 16.3. Market Analysis, Insights and Forecast - by Import Market Analysis (Value & Volume)
- 16.4. Market Analysis, Insights and Forecast - by Export Market Analysis (Value & Volume)
- 16.5. Market Analysis, Insights and Forecast - by Price Trend Analysis
- 17. Papua New Guinea Vanilla Bean Market Analysis, Insights and Forecast, 2020-2032
- 17.1. Market Analysis, Insights and Forecast - by Production Analysis
- 17.2. Market Analysis, Insights and Forecast - by Consumption Analysis
- 17.3. Market Analysis, Insights and Forecast - by Import Market Analysis (Value & Volume)
- 17.4. Market Analysis, Insights and Forecast - by Export Market Analysis (Value & Volume)
- 17.5. Market Analysis, Insights and Forecast - by Price Trend Analysis
- 18. Uganda Vanilla Bean Market Analysis, Insights and Forecast, 2020-2032
- 18.1. Market Analysis, Insights and Forecast - by Production Analysis
- 18.2. Market Analysis, Insights and Forecast - by Consumption Analysis
- 18.3. Market Analysis, Insights and Forecast - by Import Market Analysis (Value & Volume)
- 18.4. Market Analysis, Insights and Forecast - by Export Market Analysis (Value & Volume)
- 18.5. Market Analysis, Insights and Forecast - by Price Trend Analysis
- 19. Competitive Analysis
- 19.1. Company Profiles
- 19.1.1 E. Guittard & Co.
- 19.1.1.1. Company Overview
- 19.1.1.2. Products
- 19.1.1.3. Company Financials
- 19.1.1.4. SWOT Analysis
- 19.1.2 Beanilla
- 19.1.2.1. Company Overview
- 19.1.2.2. Products
- 19.1.2.3. Company Financials
- 19.1.2.4. SWOT Analysis
- 19.1.3 McCormick & Company
- 19.1.3.1. Company Overview
- 19.1.3.2. Products
- 19.1.3.3. Company Financials
- 19.1.3.4. SWOT Analysis
- 19.1.4 Madagascar Gourmet
- 19.1.4.1. Company Overview
- 19.1.4.2. Products
- 19.1.4.3. Company Financials
- 19.1.4.4. SWOT Analysis
- 19.1.5 Indriani
- 19.1.5.1. Company Overview
- 19.1.5.2. Products
- 19.1.5.3. Company Financials
- 19.1.5.4. SWOT Analysis
- 19.1.6 VanillaVida
- 19.1.6.1. Company Overview
- 19.1.6.2. Products
- 19.1.6.3. Company Financials
- 19.1.6.4. SWOT Analysis
- 19.1.7 Nielsen-Massey Vanillas
- 19.1.7.1. Company Overview
- 19.1.7.2. Products
- 19.1.7.3. Company Financials
- 19.1.7.4. SWOT Analysis
- 19.1.1 E. Guittard & Co.
- 19.2. Market Entropy
- 19.2.1 Company's Key Areas Served
- 19.2.2 Recent Developments
- 19.3. Company Market Share Analysis 2025
- 19.3.1 Top 5 Companies Market Share Analysis
- 19.3.2 Top 3 Companies Market Share Analysis
- 19.4. List of Potential Customers
- 20. Research Methodology
List of Figures
- Figure 1: Global Vanilla Bean Market Revenue Breakdown (Million, %) by Region 2025 & 2033
- Figure 2: Global Vanilla Bean Market Volume Breakdown (Kiloton, %) by Region 2025 & 2033
- Figure 3: United States Vanilla Bean Market Revenue (Million), by Production Analysis 2025 & 2033
- Figure 4: United States Vanilla Bean Market Volume (Kiloton), by Production Analysis 2025 & 2033
- Figure 5: United States Vanilla Bean Market Revenue Share (%), by Production Analysis 2025 & 2033
- Figure 6: United States Vanilla Bean Market Volume Share (%), by Production Analysis 2025 & 2033
- Figure 7: United States Vanilla Bean Market Revenue (Million), by Consumption Analysis 2025 & 2033
- Figure 8: United States Vanilla Bean Market Volume (Kiloton), by Consumption Analysis 2025 & 2033
- Figure 9: United States Vanilla Bean Market Revenue Share (%), by Consumption Analysis 2025 & 2033
- Figure 10: United States Vanilla Bean Market Volume Share (%), by Consumption Analysis 2025 & 2033
- Figure 11: United States Vanilla Bean Market Revenue (Million), by Import Market Analysis (Value & Volume) 2025 & 2033
- Figure 12: United States Vanilla Bean Market Volume (Kiloton), by Import Market Analysis (Value & Volume) 2025 & 2033
- Figure 13: United States Vanilla Bean Market Revenue Share (%), by Import Market Analysis (Value & Volume) 2025 & 2033
- Figure 14: United States Vanilla Bean Market Volume Share (%), by Import Market Analysis (Value & Volume) 2025 & 2033
- Figure 15: United States Vanilla Bean Market Revenue (Million), by Export Market Analysis (Value & Volume) 2025 & 2033
- Figure 16: United States Vanilla Bean Market Volume (Kiloton), by Export Market Analysis (Value & Volume) 2025 & 2033
- Figure 17: United States Vanilla Bean Market Revenue Share (%), by Export Market Analysis (Value & Volume) 2025 & 2033
- Figure 18: United States Vanilla Bean Market Volume Share (%), by Export Market Analysis (Value & Volume) 2025 & 2033
- Figure 19: United States Vanilla Bean Market Revenue (Million), by Price Trend Analysis 2025 & 2033
- Figure 20: United States Vanilla Bean Market Volume (Kiloton), by Price Trend Analysis 2025 & 2033
- Figure 21: United States Vanilla Bean Market Revenue Share (%), by Price Trend Analysis 2025 & 2033
- Figure 22: United States Vanilla Bean Market Volume Share (%), by Price Trend Analysis 2025 & 2033
- Figure 23: United States Vanilla Bean Market Revenue (Million), by Country 2025 & 2033
- Figure 24: United States Vanilla Bean Market Volume (Kiloton), by Country 2025 & 2033
- Figure 25: United States Vanilla Bean Market Revenue Share (%), by Country 2025 & 2033
- Figure 26: United States Vanilla Bean Market Volume Share (%), by Country 2025 & 2033
- Figure 27: Canada Vanilla Bean Market Revenue (Million), by Production Analysis 2025 & 2033
- Figure 28: Canada Vanilla Bean Market Volume (Kiloton), by Production Analysis 2025 & 2033
- Figure 29: Canada Vanilla Bean Market Revenue Share (%), by Production Analysis 2025 & 2033
- Figure 30: Canada Vanilla Bean Market Volume Share (%), by Production Analysis 2025 & 2033
- Figure 31: Canada Vanilla Bean Market Revenue (Million), by Consumption Analysis 2025 & 2033
- Figure 32: Canada Vanilla Bean Market Volume (Kiloton), by Consumption Analysis 2025 & 2033
- Figure 33: Canada Vanilla Bean Market Revenue Share (%), by Consumption Analysis 2025 & 2033
- Figure 34: Canada Vanilla Bean Market Volume Share (%), by Consumption Analysis 2025 & 2033
- Figure 35: Canada Vanilla Bean Market Revenue (Million), by Import Market Analysis (Value & Volume) 2025 & 2033
- Figure 36: Canada Vanilla Bean Market Volume (Kiloton), by Import Market Analysis (Value & Volume) 2025 & 2033
- Figure 37: Canada Vanilla Bean Market Revenue Share (%), by Import Market Analysis (Value & Volume) 2025 & 2033
- Figure 38: Canada Vanilla Bean Market Volume Share (%), by Import Market Analysis (Value & Volume) 2025 & 2033
- Figure 39: Canada Vanilla Bean Market Revenue (Million), by Export Market Analysis (Value & Volume) 2025 & 2033
- Figure 40: Canada Vanilla Bean Market Volume (Kiloton), by Export Market Analysis (Value & Volume) 2025 & 2033
- Figure 41: Canada Vanilla Bean Market Revenue Share (%), by Export Market Analysis (Value & Volume) 2025 & 2033
- Figure 42: Canada Vanilla Bean Market Volume Share (%), by Export Market Analysis (Value & Volume) 2025 & 2033
- Figure 43: Canada Vanilla Bean Market Revenue (Million), by Price Trend Analysis 2025 & 2033
- Figure 44: Canada Vanilla Bean Market Volume (Kiloton), by Price Trend Analysis 2025 & 2033
- Figure 45: Canada Vanilla Bean Market Revenue Share (%), by Price Trend Analysis 2025 & 2033
- Figure 46: Canada Vanilla Bean Market Volume Share (%), by Price Trend Analysis 2025 & 2033
- Figure 47: Canada Vanilla Bean Market Revenue (Million), by Country 2025 & 2033
- Figure 48: Canada Vanilla Bean Market Volume (Kiloton), by Country 2025 & 2033
- Figure 49: Canada Vanilla Bean Market Revenue Share (%), by Country 2025 & 2033
- Figure 50: Canada Vanilla Bean Market Volume Share (%), by Country 2025 & 2033
- Figure 51: Mexico Vanilla Bean Market Revenue (Million), by Production Analysis 2025 & 2033
- Figure 52: Mexico Vanilla Bean Market Volume (Kiloton), by Production Analysis 2025 & 2033
- Figure 53: Mexico Vanilla Bean Market Revenue Share (%), by Production Analysis 2025 & 2033
- Figure 54: Mexico Vanilla Bean Market Volume Share (%), by Production Analysis 2025 & 2033
- Figure 55: Mexico Vanilla Bean Market Revenue (Million), by Consumption Analysis 2025 & 2033
- Figure 56: Mexico Vanilla Bean Market Volume (Kiloton), by Consumption Analysis 2025 & 2033
- Figure 57: Mexico Vanilla Bean Market Revenue Share (%), by Consumption Analysis 2025 & 2033
- Figure 58: Mexico Vanilla Bean Market Volume Share (%), by Consumption Analysis 2025 & 2033
- Figure 59: Mexico Vanilla Bean Market Revenue (Million), by Import Market Analysis (Value & Volume) 2025 & 2033
- Figure 60: Mexico Vanilla Bean Market Volume (Kiloton), by Import Market Analysis (Value & Volume) 2025 & 2033
- Figure 61: Mexico Vanilla Bean Market Revenue Share (%), by Import Market Analysis (Value & Volume) 2025 & 2033
- Figure 62: Mexico Vanilla Bean Market Volume Share (%), by Import Market Analysis (Value & Volume) 2025 & 2033
- Figure 63: Mexico Vanilla Bean Market Revenue (Million), by Export Market Analysis (Value & Volume) 2025 & 2033
- Figure 64: Mexico Vanilla Bean Market Volume (Kiloton), by Export Market Analysis (Value & Volume) 2025 & 2033
- Figure 65: Mexico Vanilla Bean Market Revenue Share (%), by Export Market Analysis (Value & Volume) 2025 & 2033
- Figure 66: Mexico Vanilla Bean Market Volume Share (%), by Export Market Analysis (Value & Volume) 2025 & 2033
- Figure 67: Mexico Vanilla Bean Market Revenue (Million), by Price Trend Analysis 2025 & 2033
- Figure 68: Mexico Vanilla Bean Market Volume (Kiloton), by Price Trend Analysis 2025 & 2033
- Figure 69: Mexico Vanilla Bean Market Revenue Share (%), by Price Trend Analysis 2025 & 2033
- Figure 70: Mexico Vanilla Bean Market Volume Share (%), by Price Trend Analysis 2025 & 2033
- Figure 71: Mexico Vanilla Bean Market Revenue (Million), by Country 2025 & 2033
- Figure 72: Mexico Vanilla Bean Market Volume (Kiloton), by Country 2025 & 2033
- Figure 73: Mexico Vanilla Bean Market Revenue Share (%), by Country 2025 & 2033
- Figure 74: Mexico Vanilla Bean Market Volume Share (%), by Country 2025 & 2033
- Figure 75: Germany Vanilla Bean Market Revenue (Million), by Production Analysis 2025 & 2033
- Figure 76: Germany Vanilla Bean Market Volume (Kiloton), by Production Analysis 2025 & 2033
- Figure 77: Germany Vanilla Bean Market Revenue Share (%), by Production Analysis 2025 & 2033
- Figure 78: Germany Vanilla Bean Market Volume Share (%), by Production Analysis 2025 & 2033
- Figure 79: Germany Vanilla Bean Market Revenue (Million), by Consumption Analysis 2025 & 2033
- Figure 80: Germany Vanilla Bean Market Volume (Kiloton), by Consumption Analysis 2025 & 2033
- Figure 81: Germany Vanilla Bean Market Revenue Share (%), by Consumption Analysis 2025 & 2033
- Figure 82: Germany Vanilla Bean Market Volume Share (%), by Consumption Analysis 2025 & 2033
- Figure 83: Germany Vanilla Bean Market Revenue (Million), by Import Market Analysis (Value & Volume) 2025 & 2033
- Figure 84: Germany Vanilla Bean Market Volume (Kiloton), by Import Market Analysis (Value & Volume) 2025 & 2033
- Figure 85: Germany Vanilla Bean Market Revenue Share (%), by Import Market Analysis (Value & Volume) 2025 & 2033
- Figure 86: Germany Vanilla Bean Market Volume Share (%), by Import Market Analysis (Value & Volume) 2025 & 2033
- Figure 87: Germany Vanilla Bean Market Revenue (Million), by Export Market Analysis (Value & Volume) 2025 & 2033
- Figure 88: Germany Vanilla Bean Market Volume (Kiloton), by Export Market Analysis (Value & Volume) 2025 & 2033
- Figure 89: Germany Vanilla Bean Market Revenue Share (%), by Export Market Analysis (Value & Volume) 2025 & 2033
- Figure 90: Germany Vanilla Bean Market Volume Share (%), by Export Market Analysis (Value & Volume) 2025 & 2033
- Figure 91: Germany Vanilla Bean Market Revenue (Million), by Price Trend Analysis 2025 & 2033
- Figure 92: Germany Vanilla Bean Market Volume (Kiloton), by Price Trend Analysis 2025 & 2033
- Figure 93: Germany Vanilla Bean Market Revenue Share (%), by Price Trend Analysis 2025 & 2033
- Figure 94: Germany Vanilla Bean Market Volume Share (%), by Price Trend Analysis 2025 & 2033
- Figure 95: Germany Vanilla Bean Market Revenue (Million), by Country 2025 & 2033
- Figure 96: Germany Vanilla Bean Market Volume (Kiloton), by Country 2025 & 2033
- Figure 97: Germany Vanilla Bean Market Revenue Share (%), by Country 2025 & 2033
- Figure 98: Germany Vanilla Bean Market Volume Share (%), by Country 2025 & 2033
- Figure 99: France Vanilla Bean Market Revenue (Million), by Production Analysis 2025 & 2033
- Figure 100: France Vanilla Bean Market Volume (Kiloton), by Production Analysis 2025 & 2033
- Figure 101: France Vanilla Bean Market Revenue Share (%), by Production Analysis 2025 & 2033
- Figure 102: France Vanilla Bean Market Volume Share (%), by Production Analysis 2025 & 2033
- Figure 103: France Vanilla Bean Market Revenue (Million), by Consumption Analysis 2025 & 2033
- Figure 104: France Vanilla Bean Market Volume (Kiloton), by Consumption Analysis 2025 & 2033
- Figure 105: France Vanilla Bean Market Revenue Share (%), by Consumption Analysis 2025 & 2033
- Figure 106: France Vanilla Bean Market Volume Share (%), by Consumption Analysis 2025 & 2033
- Figure 107: France Vanilla Bean Market Revenue (Million), by Import Market Analysis (Value & Volume) 2025 & 2033
- Figure 108: France Vanilla Bean Market Volume (Kiloton), by Import Market Analysis (Value & Volume) 2025 & 2033
- Figure 109: France Vanilla Bean Market Revenue Share (%), by Import Market Analysis (Value & Volume) 2025 & 2033
- Figure 110: France Vanilla Bean Market Volume Share (%), by Import Market Analysis (Value & Volume) 2025 & 2033
- Figure 111: France Vanilla Bean Market Revenue (Million), by Export Market Analysis (Value & Volume) 2025 & 2033
- Figure 112: France Vanilla Bean Market Volume (Kiloton), by Export Market Analysis (Value & Volume) 2025 & 2033
- Figure 113: France Vanilla Bean Market Revenue Share (%), by Export Market Analysis (Value & Volume) 2025 & 2033
- Figure 114: France Vanilla Bean Market Volume Share (%), by Export Market Analysis (Value & Volume) 2025 & 2033
- Figure 115: France Vanilla Bean Market Revenue (Million), by Price Trend Analysis 2025 & 2033
- Figure 116: France Vanilla Bean Market Volume (Kiloton), by Price Trend Analysis 2025 & 2033
- Figure 117: France Vanilla Bean Market Revenue Share (%), by Price Trend Analysis 2025 & 2033
- Figure 118: France Vanilla Bean Market Volume Share (%), by Price Trend Analysis 2025 & 2033
- Figure 119: France Vanilla Bean Market Revenue (Million), by Country 2025 & 2033
- Figure 120: France Vanilla Bean Market Volume (Kiloton), by Country 2025 & 2033
- Figure 121: France Vanilla Bean Market Revenue Share (%), by Country 2025 & 2033
- Figure 122: France Vanilla Bean Market Volume Share (%), by Country 2025 & 2033
- Figure 123: Netherlands Vanilla Bean Market Revenue (Million), by Production Analysis 2025 & 2033
- Figure 124: Netherlands Vanilla Bean Market Volume (Kiloton), by Production Analysis 2025 & 2033
- Figure 125: Netherlands Vanilla Bean Market Revenue Share (%), by Production Analysis 2025 & 2033
- Figure 126: Netherlands Vanilla Bean Market Volume Share (%), by Production Analysis 2025 & 2033
- Figure 127: Netherlands Vanilla Bean Market Revenue (Million), by Consumption Analysis 2025 & 2033
- Figure 128: Netherlands Vanilla Bean Market Volume (Kiloton), by Consumption Analysis 2025 & 2033
- Figure 129: Netherlands Vanilla Bean Market Revenue Share (%), by Consumption Analysis 2025 & 2033
- Figure 130: Netherlands Vanilla Bean Market Volume Share (%), by Consumption Analysis 2025 & 2033
- Figure 131: Netherlands Vanilla Bean Market Revenue (Million), by Import Market Analysis (Value & Volume) 2025 & 2033
- Figure 132: Netherlands Vanilla Bean Market Volume (Kiloton), by Import Market Analysis (Value & Volume) 2025 & 2033
- Figure 133: Netherlands Vanilla Bean Market Revenue Share (%), by Import Market Analysis (Value & Volume) 2025 & 2033
- Figure 134: Netherlands Vanilla Bean Market Volume Share (%), by Import Market Analysis (Value & Volume) 2025 & 2033
- Figure 135: Netherlands Vanilla Bean Market Revenue (Million), by Export Market Analysis (Value & Volume) 2025 & 2033
- Figure 136: Netherlands Vanilla Bean Market Volume (Kiloton), by Export Market Analysis (Value & Volume) 2025 & 2033
- Figure 137: Netherlands Vanilla Bean Market Revenue Share (%), by Export Market Analysis (Value & Volume) 2025 & 2033
- Figure 138: Netherlands Vanilla Bean Market Volume Share (%), by Export Market Analysis (Value & Volume) 2025 & 2033
- Figure 139: Netherlands Vanilla Bean Market Revenue (Million), by Price Trend Analysis 2025 & 2033
- Figure 140: Netherlands Vanilla Bean Market Volume (Kiloton), by Price Trend Analysis 2025 & 2033
- Figure 141: Netherlands Vanilla Bean Market Revenue Share (%), by Price Trend Analysis 2025 & 2033
- Figure 142: Netherlands Vanilla Bean Market Volume Share (%), by Price Trend Analysis 2025 & 2033
- Figure 143: Netherlands Vanilla Bean Market Revenue (Million), by Country 2025 & 2033
- Figure 144: Netherlands Vanilla Bean Market Volume (Kiloton), by Country 2025 & 2033
- Figure 145: Netherlands Vanilla Bean Market Revenue Share (%), by Country 2025 & 2033
- Figure 146: Netherlands Vanilla Bean Market Volume Share (%), by Country 2025 & 2033
- Figure 147: Japan Vanilla Bean Market Revenue (Million), by Production Analysis 2025 & 2033
- Figure 148: Japan Vanilla Bean Market Volume (Kiloton), by Production Analysis 2025 & 2033
- Figure 149: Japan Vanilla Bean Market Revenue Share (%), by Production Analysis 2025 & 2033
- Figure 150: Japan Vanilla Bean Market Volume Share (%), by Production Analysis 2025 & 2033
- Figure 151: Japan Vanilla Bean Market Revenue (Million), by Consumption Analysis 2025 & 2033
- Figure 152: Japan Vanilla Bean Market Volume (Kiloton), by Consumption Analysis 2025 & 2033
- Figure 153: Japan Vanilla Bean Market Revenue Share (%), by Consumption Analysis 2025 & 2033
- Figure 154: Japan Vanilla Bean Market Volume Share (%), by Consumption Analysis 2025 & 2033
- Figure 155: Japan Vanilla Bean Market Revenue (Million), by Import Market Analysis (Value & Volume) 2025 & 2033
- Figure 156: Japan Vanilla Bean Market Volume (Kiloton), by Import Market Analysis (Value & Volume) 2025 & 2033
- Figure 157: Japan Vanilla Bean Market Revenue Share (%), by Import Market Analysis (Value & Volume) 2025 & 2033
- Figure 158: Japan Vanilla Bean Market Volume Share (%), by Import Market Analysis (Value & Volume) 2025 & 2033
- Figure 159: Japan Vanilla Bean Market Revenue (Million), by Export Market Analysis (Value & Volume) 2025 & 2033
- Figure 160: Japan Vanilla Bean Market Volume (Kiloton), by Export Market Analysis (Value & Volume) 2025 & 2033
- Figure 161: Japan Vanilla Bean Market Revenue Share (%), by Export Market Analysis (Value & Volume) 2025 & 2033
- Figure 162: Japan Vanilla Bean Market Volume Share (%), by Export Market Analysis (Value & Volume) 2025 & 2033
- Figure 163: Japan Vanilla Bean Market Revenue (Million), by Price Trend Analysis 2025 & 2033
- Figure 164: Japan Vanilla Bean Market Volume (Kiloton), by Price Trend Analysis 2025 & 2033
- Figure 165: Japan Vanilla Bean Market Revenue Share (%), by Price Trend Analysis 2025 & 2033
- Figure 166: Japan Vanilla Bean Market Volume Share (%), by Price Trend Analysis 2025 & 2033
- Figure 167: Japan Vanilla Bean Market Revenue (Million), by Country 2025 & 2033
- Figure 168: Japan Vanilla Bean Market Volume (Kiloton), by Country 2025 & 2033
- Figure 169: Japan Vanilla Bean Market Revenue Share (%), by Country 2025 & 2033
- Figure 170: Japan Vanilla Bean Market Volume Share (%), by Country 2025 & 2033
- Figure 171: Indonesia Vanilla Bean Market Revenue (Million), by Production Analysis 2025 & 2033
- Figure 172: Indonesia Vanilla Bean Market Volume (Kiloton), by Production Analysis 2025 & 2033
- Figure 173: Indonesia Vanilla Bean Market Revenue Share (%), by Production Analysis 2025 & 2033
- Figure 174: Indonesia Vanilla Bean Market Volume Share (%), by Production Analysis 2025 & 2033
- Figure 175: Indonesia Vanilla Bean Market Revenue (Million), by Consumption Analysis 2025 & 2033
- Figure 176: Indonesia Vanilla Bean Market Volume (Kiloton), by Consumption Analysis 2025 & 2033
- Figure 177: Indonesia Vanilla Bean Market Revenue Share (%), by Consumption Analysis 2025 & 2033
- Figure 178: Indonesia Vanilla Bean Market Volume Share (%), by Consumption Analysis 2025 & 2033
- Figure 179: Indonesia Vanilla Bean Market Revenue (Million), by Import Market Analysis (Value & Volume) 2025 & 2033
- Figure 180: Indonesia Vanilla Bean Market Volume (Kiloton), by Import Market Analysis (Value & Volume) 2025 & 2033
- Figure 181: Indonesia Vanilla Bean Market Revenue Share (%), by Import Market Analysis (Value & Volume) 2025 & 2033
- Figure 182: Indonesia Vanilla Bean Market Volume Share (%), by Import Market Analysis (Value & Volume) 2025 & 2033
- Figure 183: Indonesia Vanilla Bean Market Revenue (Million), by Export Market Analysis (Value & Volume) 2025 & 2033
- Figure 184: Indonesia Vanilla Bean Market Volume (Kiloton), by Export Market Analysis (Value & Volume) 2025 & 2033
- Figure 185: Indonesia Vanilla Bean Market Revenue Share (%), by Export Market Analysis (Value & Volume) 2025 & 2033
- Figure 186: Indonesia Vanilla Bean Market Volume Share (%), by Export Market Analysis (Value & Volume) 2025 & 2033
- Figure 187: Indonesia Vanilla Bean Market Revenue (Million), by Price Trend Analysis 2025 & 2033
- Figure 188: Indonesia Vanilla Bean Market Volume (Kiloton), by Price Trend Analysis 2025 & 2033
- Figure 189: Indonesia Vanilla Bean Market Revenue Share (%), by Price Trend Analysis 2025 & 2033
- Figure 190: Indonesia Vanilla Bean Market Volume Share (%), by Price Trend Analysis 2025 & 2033
- Figure 191: Indonesia Vanilla Bean Market Revenue (Million), by Country 2025 & 2033
- Figure 192: Indonesia Vanilla Bean Market Volume (Kiloton), by Country 2025 & 2033
- Figure 193: Indonesia Vanilla Bean Market Revenue Share (%), by Country 2025 & 2033
- Figure 194: Indonesia Vanilla Bean Market Volume Share (%), by Country 2025 & 2033
- Figure 195: China Vanilla Bean Market Revenue (Million), by Production Analysis 2025 & 2033
- Figure 196: China Vanilla Bean Market Volume (Kiloton), by Production Analysis 2025 & 2033
- Figure 197: China Vanilla Bean Market Revenue Share (%), by Production Analysis 2025 & 2033
- Figure 198: China Vanilla Bean Market Volume Share (%), by Production Analysis 2025 & 2033
- Figure 199: China Vanilla Bean Market Revenue (Million), by Consumption Analysis 2025 & 2033
- Figure 200: China Vanilla Bean Market Volume (Kiloton), by Consumption Analysis 2025 & 2033
- Figure 201: China Vanilla Bean Market Revenue Share (%), by Consumption Analysis 2025 & 2033
- Figure 202: China Vanilla Bean Market Volume Share (%), by Consumption Analysis 2025 & 2033
- Figure 203: China Vanilla Bean Market Revenue (Million), by Import Market Analysis (Value & Volume) 2025 & 2033
- Figure 204: China Vanilla Bean Market Volume (Kiloton), by Import Market Analysis (Value & Volume) 2025 & 2033
- Figure 205: China Vanilla Bean Market Revenue Share (%), by Import Market Analysis (Value & Volume) 2025 & 2033
- Figure 206: China Vanilla Bean Market Volume Share (%), by Import Market Analysis (Value & Volume) 2025 & 2033
- Figure 207: China Vanilla Bean Market Revenue (Million), by Export Market Analysis (Value & Volume) 2025 & 2033
- Figure 208: China Vanilla Bean Market Volume (Kiloton), by Export Market Analysis (Value & Volume) 2025 & 2033
- Figure 209: China Vanilla Bean Market Revenue Share (%), by Export Market Analysis (Value & Volume) 2025 & 2033
- Figure 210: China Vanilla Bean Market Volume Share (%), by Export Market Analysis (Value & Volume) 2025 & 2033
- Figure 211: China Vanilla Bean Market Revenue (Million), by Price Trend Analysis 2025 & 2033
- Figure 212: China Vanilla Bean Market Volume (Kiloton), by Price Trend Analysis 2025 & 2033
- Figure 213: China Vanilla Bean Market Revenue Share (%), by Price Trend Analysis 2025 & 2033
- Figure 214: China Vanilla Bean Market Volume Share (%), by Price Trend Analysis 2025 & 2033
- Figure 215: China Vanilla Bean Market Revenue (Million), by Country 2025 & 2033
- Figure 216: China Vanilla Bean Market Volume (Kiloton), by Country 2025 & 2033
- Figure 217: China Vanilla Bean Market Revenue Share (%), by Country 2025 & 2033
- Figure 218: China Vanilla Bean Market Volume Share (%), by Country 2025 & 2033
- Figure 219: Madagascar Vanilla Bean Market Revenue (Million), by Production Analysis 2025 & 2033
- Figure 220: Madagascar Vanilla Bean Market Volume (Kiloton), by Production Analysis 2025 & 2033
- Figure 221: Madagascar Vanilla Bean Market Revenue Share (%), by Production Analysis 2025 & 2033
- Figure 222: Madagascar Vanilla Bean Market Volume Share (%), by Production Analysis 2025 & 2033
- Figure 223: Madagascar Vanilla Bean Market Revenue (Million), by Consumption Analysis 2025 & 2033
- Figure 224: Madagascar Vanilla Bean Market Volume (Kiloton), by Consumption Analysis 2025 & 2033
- Figure 225: Madagascar Vanilla Bean Market Revenue Share (%), by Consumption Analysis 2025 & 2033
- Figure 226: Madagascar Vanilla Bean Market Volume Share (%), by Consumption Analysis 2025 & 2033
- Figure 227: Madagascar Vanilla Bean Market Revenue (Million), by Import Market Analysis (Value & Volume) 2025 & 2033
- Figure 228: Madagascar Vanilla Bean Market Volume (Kiloton), by Import Market Analysis (Value & Volume) 2025 & 2033
- Figure 229: Madagascar Vanilla Bean Market Revenue Share (%), by Import Market Analysis (Value & Volume) 2025 & 2033
- Figure 230: Madagascar Vanilla Bean Market Volume Share (%), by Import Market Analysis (Value & Volume) 2025 & 2033
- Figure 231: Madagascar Vanilla Bean Market Revenue (Million), by Export Market Analysis (Value & Volume) 2025 & 2033
- Figure 232: Madagascar Vanilla Bean Market Volume (Kiloton), by Export Market Analysis (Value & Volume) 2025 & 2033
- Figure 233: Madagascar Vanilla Bean Market Revenue Share (%), by Export Market Analysis (Value & Volume) 2025 & 2033
- Figure 234: Madagascar Vanilla Bean Market Volume Share (%), by Export Market Analysis (Value & Volume) 2025 & 2033
- Figure 235: Madagascar Vanilla Bean Market Revenue (Million), by Price Trend Analysis 2025 & 2033
- Figure 236: Madagascar Vanilla Bean Market Volume (Kiloton), by Price Trend Analysis 2025 & 2033
- Figure 237: Madagascar Vanilla Bean Market Revenue Share (%), by Price Trend Analysis 2025 & 2033
- Figure 238: Madagascar Vanilla Bean Market Volume Share (%), by Price Trend Analysis 2025 & 2033
- Figure 239: Madagascar Vanilla Bean Market Revenue (Million), by Country 2025 & 2033
- Figure 240: Madagascar Vanilla Bean Market Volume (Kiloton), by Country 2025 & 2033
- Figure 241: Madagascar Vanilla Bean Market Revenue Share (%), by Country 2025 & 2033
- Figure 242: Madagascar Vanilla Bean Market Volume Share (%), by Country 2025 & 2033
- Figure 243: Papua New Guinea Vanilla Bean Market Revenue (Million), by Production Analysis 2025 & 2033
- Figure 244: Papua New Guinea Vanilla Bean Market Volume (Kiloton), by Production Analysis 2025 & 2033
- Figure 245: Papua New Guinea Vanilla Bean Market Revenue Share (%), by Production Analysis 2025 & 2033
- Figure 246: Papua New Guinea Vanilla Bean Market Volume Share (%), by Production Analysis 2025 & 2033
- Figure 247: Papua New Guinea Vanilla Bean Market Revenue (Million), by Consumption Analysis 2025 & 2033
- Figure 248: Papua New Guinea Vanilla Bean Market Volume (Kiloton), by Consumption Analysis 2025 & 2033
- Figure 249: Papua New Guinea Vanilla Bean Market Revenue Share (%), by Consumption Analysis 2025 & 2033
- Figure 250: Papua New Guinea Vanilla Bean Market Volume Share (%), by Consumption Analysis 2025 & 2033
- Figure 251: Papua New Guinea Vanilla Bean Market Revenue (Million), by Import Market Analysis (Value & Volume) 2025 & 2033
- Figure 252: Papua New Guinea Vanilla Bean Market Volume (Kiloton), by Import Market Analysis (Value & Volume) 2025 & 2033
- Figure 253: Papua New Guinea Vanilla Bean Market Revenue Share (%), by Import Market Analysis (Value & Volume) 2025 & 2033
- Figure 254: Papua New Guinea Vanilla Bean Market Volume Share (%), by Import Market Analysis (Value & Volume) 2025 & 2033
- Figure 255: Papua New Guinea Vanilla Bean Market Revenue (Million), by Export Market Analysis (Value & Volume) 2025 & 2033
- Figure 256: Papua New Guinea Vanilla Bean Market Volume (Kiloton), by Export Market Analysis (Value & Volume) 2025 & 2033
- Figure 257: Papua New Guinea Vanilla Bean Market Revenue Share (%), by Export Market Analysis (Value & Volume) 2025 & 2033
- Figure 258: Papua New Guinea Vanilla Bean Market Volume Share (%), by Export Market Analysis (Value & Volume) 2025 & 2033
- Figure 259: Papua New Guinea Vanilla Bean Market Revenue (Million), by Price Trend Analysis 2025 & 2033
- Figure 260: Papua New Guinea Vanilla Bean Market Volume (Kiloton), by Price Trend Analysis 2025 & 2033
- Figure 261: Papua New Guinea Vanilla Bean Market Revenue Share (%), by Price Trend Analysis 2025 & 2033
- Figure 262: Papua New Guinea Vanilla Bean Market Volume Share (%), by Price Trend Analysis 2025 & 2033
- Figure 263: Papua New Guinea Vanilla Bean Market Revenue (Million), by Country 2025 & 2033
- Figure 264: Papua New Guinea Vanilla Bean Market Volume (Kiloton), by Country 2025 & 2033
- Figure 265: Papua New Guinea Vanilla Bean Market Revenue Share (%), by Country 2025 & 2033
- Figure 266: Papua New Guinea Vanilla Bean Market Volume Share (%), by Country 2025 & 2033
- Figure 267: Uganda Vanilla Bean Market Revenue (Million), by Production Analysis 2025 & 2033
- Figure 268: Uganda Vanilla Bean Market Volume (Kiloton), by Production Analysis 2025 & 2033
- Figure 269: Uganda Vanilla Bean Market Revenue Share (%), by Production Analysis 2025 & 2033
- Figure 270: Uganda Vanilla Bean Market Volume Share (%), by Production Analysis 2025 & 2033
- Figure 271: Uganda Vanilla Bean Market Revenue (Million), by Consumption Analysis 2025 & 2033
- Figure 272: Uganda Vanilla Bean Market Volume (Kiloton), by Consumption Analysis 2025 & 2033
- Figure 273: Uganda Vanilla Bean Market Revenue Share (%), by Consumption Analysis 2025 & 2033
- Figure 274: Uganda Vanilla Bean Market Volume Share (%), by Consumption Analysis 2025 & 2033
- Figure 275: Uganda Vanilla Bean Market Revenue (Million), by Import Market Analysis (Value & Volume) 2025 & 2033
- Figure 276: Uganda Vanilla Bean Market Volume (Kiloton), by Import Market Analysis (Value & Volume) 2025 & 2033
- Figure 277: Uganda Vanilla Bean Market Revenue Share (%), by Import Market Analysis (Value & Volume) 2025 & 2033
- Figure 278: Uganda Vanilla Bean Market Volume Share (%), by Import Market Analysis (Value & Volume) 2025 & 2033
- Figure 279: Uganda Vanilla Bean Market Revenue (Million), by Export Market Analysis (Value & Volume) 2025 & 2033
- Figure 280: Uganda Vanilla Bean Market Volume (Kiloton), by Export Market Analysis (Value & Volume) 2025 & 2033
- Figure 281: Uganda Vanilla Bean Market Revenue Share (%), by Export Market Analysis (Value & Volume) 2025 & 2033
- Figure 282: Uganda Vanilla Bean Market Volume Share (%), by Export Market Analysis (Value & Volume) 2025 & 2033
- Figure 283: Uganda Vanilla Bean Market Revenue (Million), by Price Trend Analysis 2025 & 2033
- Figure 284: Uganda Vanilla Bean Market Volume (Kiloton), by Price Trend Analysis 2025 & 2033
- Figure 285: Uganda Vanilla Bean Market Revenue Share (%), by Price Trend Analysis 2025 & 2033
- Figure 286: Uganda Vanilla Bean Market Volume Share (%), by Price Trend Analysis 2025 & 2033
- Figure 287: Uganda Vanilla Bean Market Revenue (Million), by Country 2025 & 2033
- Figure 288: Uganda Vanilla Bean Market Volume (Kiloton), by Country 2025 & 2033
- Figure 289: Uganda Vanilla Bean Market Revenue Share (%), by Country 2025 & 2033
- Figure 290: Uganda Vanilla Bean Market Volume Share (%), by Country 2025 & 2033
List of Tables
- Table 1: Global Vanilla Bean Market Revenue Million Forecast, by Production Analysis 2020 & 2033
- Table 2: Global Vanilla Bean Market Volume Kiloton Forecast, by Production Analysis 2020 & 2033
- Table 3: Global Vanilla Bean Market Revenue Million Forecast, by Consumption Analysis 2020 & 2033
- Table 4: Global Vanilla Bean Market Volume Kiloton Forecast, by Consumption Analysis 2020 & 2033
- Table 5: Global Vanilla Bean Market Revenue Million Forecast, by Import Market Analysis (Value & Volume) 2020 & 2033
- Table 6: Global Vanilla Bean Market Volume Kiloton Forecast, by Import Market Analysis (Value & Volume) 2020 & 2033
- Table 7: Global Vanilla Bean Market Revenue Million Forecast, by Export Market Analysis (Value & Volume) 2020 & 2033
- Table 8: Global Vanilla Bean Market Volume Kiloton Forecast, by Export Market Analysis (Value & Volume) 2020 & 2033
- Table 9: Global Vanilla Bean Market Revenue Million Forecast, by Price Trend Analysis 2020 & 2033
- Table 10: Global Vanilla Bean Market Volume Kiloton Forecast, by Price Trend Analysis 2020 & 2033
- Table 11: Global Vanilla Bean Market Revenue Million Forecast, by Region 2020 & 2033
- Table 12: Global Vanilla Bean Market Volume Kiloton Forecast, by Region 2020 & 2033
- Table 13: Global Vanilla Bean Market Revenue Million Forecast, by Production Analysis 2020 & 2033
- Table 14: Global Vanilla Bean Market Volume Kiloton Forecast, by Production Analysis 2020 & 2033
- Table 15: Global Vanilla Bean Market Revenue Million Forecast, by Consumption Analysis 2020 & 2033
- Table 16: Global Vanilla Bean Market Volume Kiloton Forecast, by Consumption Analysis 2020 & 2033
- Table 17: Global Vanilla Bean Market Revenue Million Forecast, by Import Market Analysis (Value & Volume) 2020 & 2033
- Table 18: Global Vanilla Bean Market Volume Kiloton Forecast, by Import Market Analysis (Value & Volume) 2020 & 2033
- Table 19: Global Vanilla Bean Market Revenue Million Forecast, by Export Market Analysis (Value & Volume) 2020 & 2033
- Table 20: Global Vanilla Bean Market Volume Kiloton Forecast, by Export Market Analysis (Value & Volume) 2020 & 2033
- Table 21: Global Vanilla Bean Market Revenue Million Forecast, by Price Trend Analysis 2020 & 2033
- Table 22: Global Vanilla Bean Market Volume Kiloton Forecast, by Price Trend Analysis 2020 & 2033
- Table 23: Global Vanilla Bean Market Revenue Million Forecast, by Country 2020 & 2033
- Table 24: Global Vanilla Bean Market Volume Kiloton Forecast, by Country 2020 & 2033
- Table 25: Global Vanilla Bean Market Revenue Million Forecast, by Production Analysis 2020 & 2033
- Table 26: Global Vanilla Bean Market Volume Kiloton Forecast, by Production Analysis 2020 & 2033
- Table 27: Global Vanilla Bean Market Revenue Million Forecast, by Consumption Analysis 2020 & 2033
- Table 28: Global Vanilla Bean Market Volume Kiloton Forecast, by Consumption Analysis 2020 & 2033
- Table 29: Global Vanilla Bean Market Revenue Million Forecast, by Import Market Analysis (Value & Volume) 2020 & 2033
- Table 30: Global Vanilla Bean Market Volume Kiloton Forecast, by Import Market Analysis (Value & Volume) 2020 & 2033
- Table 31: Global Vanilla Bean Market Revenue Million Forecast, by Export Market Analysis (Value & Volume) 2020 & 2033
- Table 32: Global Vanilla Bean Market Volume Kiloton Forecast, by Export Market Analysis (Value & Volume) 2020 & 2033
- Table 33: Global Vanilla Bean Market Revenue Million Forecast, by Price Trend Analysis 2020 & 2033
- Table 34: Global Vanilla Bean Market Volume Kiloton Forecast, by Price Trend Analysis 2020 & 2033
- Table 35: Global Vanilla Bean Market Revenue Million Forecast, by Country 2020 & 2033
- Table 36: Global Vanilla Bean Market Volume Kiloton Forecast, by Country 2020 & 2033
- Table 37: Global Vanilla Bean Market Revenue Million Forecast, by Production Analysis 2020 & 2033
- Table 38: Global Vanilla Bean Market Volume Kiloton Forecast, by Production Analysis 2020 & 2033
- Table 39: Global Vanilla Bean Market Revenue Million Forecast, by Consumption Analysis 2020 & 2033
- Table 40: Global Vanilla Bean Market Volume Kiloton Forecast, by Consumption Analysis 2020 & 2033
- Table 41: Global Vanilla Bean Market Revenue Million Forecast, by Import Market Analysis (Value & Volume) 2020 & 2033
- Table 42: Global Vanilla Bean Market Volume Kiloton Forecast, by Import Market Analysis (Value & Volume) 2020 & 2033
- Table 43: Global Vanilla Bean Market Revenue Million Forecast, by Export Market Analysis (Value & Volume) 2020 & 2033
- Table 44: Global Vanilla Bean Market Volume Kiloton Forecast, by Export Market Analysis (Value & Volume) 2020 & 2033
- Table 45: Global Vanilla Bean Market Revenue Million Forecast, by Price Trend Analysis 2020 & 2033
- Table 46: Global Vanilla Bean Market Volume Kiloton Forecast, by Price Trend Analysis 2020 & 2033
- Table 47: Global Vanilla Bean Market Revenue Million Forecast, by Country 2020 & 2033
- Table 48: Global Vanilla Bean Market Volume Kiloton Forecast, by Country 2020 & 2033
- Table 49: Global Vanilla Bean Market Revenue Million Forecast, by Production Analysis 2020 & 2033
- Table 50: Global Vanilla Bean Market Volume Kiloton Forecast, by Production Analysis 2020 & 2033
- Table 51: Global Vanilla Bean Market Revenue Million Forecast, by Consumption Analysis 2020 & 2033
- Table 52: Global Vanilla Bean Market Volume Kiloton Forecast, by Consumption Analysis 2020 & 2033
- Table 53: Global Vanilla Bean Market Revenue Million Forecast, by Import Market Analysis (Value & Volume) 2020 & 2033
- Table 54: Global Vanilla Bean Market Volume Kiloton Forecast, by Import Market Analysis (Value & Volume) 2020 & 2033
- Table 55: Global Vanilla Bean Market Revenue Million Forecast, by Export Market Analysis (Value & Volume) 2020 & 2033
- Table 56: Global Vanilla Bean Market Volume Kiloton Forecast, by Export Market Analysis (Value & Volume) 2020 & 2033
- Table 57: Global Vanilla Bean Market Revenue Million Forecast, by Price Trend Analysis 2020 & 2033
- Table 58: Global Vanilla Bean Market Volume Kiloton Forecast, by Price Trend Analysis 2020 & 2033
- Table 59: Global Vanilla Bean Market Revenue Million Forecast, by Country 2020 & 2033
- Table 60: Global Vanilla Bean Market Volume Kiloton Forecast, by Country 2020 & 2033
- Table 61: Global Vanilla Bean Market Revenue Million Forecast, by Production Analysis 2020 & 2033
- Table 62: Global Vanilla Bean Market Volume Kiloton Forecast, by Production Analysis 2020 & 2033
- Table 63: Global Vanilla Bean Market Revenue Million Forecast, by Consumption Analysis 2020 & 2033
- Table 64: Global Vanilla Bean Market Volume Kiloton Forecast, by Consumption Analysis 2020 & 2033
- Table 65: Global Vanilla Bean Market Revenue Million Forecast, by Import Market Analysis (Value & Volume) 2020 & 2033
- Table 66: Global Vanilla Bean Market Volume Kiloton Forecast, by Import Market Analysis (Value & Volume) 2020 & 2033
- Table 67: Global Vanilla Bean Market Revenue Million Forecast, by Export Market Analysis (Value & Volume) 2020 & 2033
- Table 68: Global Vanilla Bean Market Volume Kiloton Forecast, by Export Market Analysis (Value & Volume) 2020 & 2033
- Table 69: Global Vanilla Bean Market Revenue Million Forecast, by Price Trend Analysis 2020 & 2033
- Table 70: Global Vanilla Bean Market Volume Kiloton Forecast, by Price Trend Analysis 2020 & 2033
- Table 71: Global Vanilla Bean Market Revenue Million Forecast, by Country 2020 & 2033
- Table 72: Global Vanilla Bean Market Volume Kiloton Forecast, by Country 2020 & 2033
- Table 73: Global Vanilla Bean Market Revenue Million Forecast, by Production Analysis 2020 & 2033
- Table 74: Global Vanilla Bean Market Volume Kiloton Forecast, by Production Analysis 2020 & 2033
- Table 75: Global Vanilla Bean Market Revenue Million Forecast, by Consumption Analysis 2020 & 2033
- Table 76: Global Vanilla Bean Market Volume Kiloton Forecast, by Consumption Analysis 2020 & 2033
- Table 77: Global Vanilla Bean Market Revenue Million Forecast, by Import Market Analysis (Value & Volume) 2020 & 2033
- Table 78: Global Vanilla Bean Market Volume Kiloton Forecast, by Import Market Analysis (Value & Volume) 2020 & 2033
- Table 79: Global Vanilla Bean Market Revenue Million Forecast, by Export Market Analysis (Value & Volume) 2020 & 2033
- Table 80: Global Vanilla Bean Market Volume Kiloton Forecast, by Export Market Analysis (Value & Volume) 2020 & 2033
- Table 81: Global Vanilla Bean Market Revenue Million Forecast, by Price Trend Analysis 2020 & 2033
- Table 82: Global Vanilla Bean Market Volume Kiloton Forecast, by Price Trend Analysis 2020 & 2033
- Table 83: Global Vanilla Bean Market Revenue Million Forecast, by Country 2020 & 2033
- Table 84: Global Vanilla Bean Market Volume Kiloton Forecast, by Country 2020 & 2033
- Table 85: Global Vanilla Bean Market Revenue Million Forecast, by Production Analysis 2020 & 2033
- Table 86: Global Vanilla Bean Market Volume Kiloton Forecast, by Production Analysis 2020 & 2033
- Table 87: Global Vanilla Bean Market Revenue Million Forecast, by Consumption Analysis 2020 & 2033
- Table 88: Global Vanilla Bean Market Volume Kiloton Forecast, by Consumption Analysis 2020 & 2033
- Table 89: Global Vanilla Bean Market Revenue Million Forecast, by Import Market Analysis (Value & Volume) 2020 & 2033
- Table 90: Global Vanilla Bean Market Volume Kiloton Forecast, by Import Market Analysis (Value & Volume) 2020 & 2033
- Table 91: Global Vanilla Bean Market Revenue Million Forecast, by Export Market Analysis (Value & Volume) 2020 & 2033
- Table 92: Global Vanilla Bean Market Volume Kiloton Forecast, by Export Market Analysis (Value & Volume) 2020 & 2033
- Table 93: Global Vanilla Bean Market Revenue Million Forecast, by Price Trend Analysis 2020 & 2033
- Table 94: Global Vanilla Bean Market Volume Kiloton Forecast, by Price Trend Analysis 2020 & 2033
- Table 95: Global Vanilla Bean Market Revenue Million Forecast, by Country 2020 & 2033
- Table 96: Global Vanilla Bean Market Volume Kiloton Forecast, by Country 2020 & 2033
- Table 97: Global Vanilla Bean Market Revenue Million Forecast, by Production Analysis 2020 & 2033
- Table 98: Global Vanilla Bean Market Volume Kiloton Forecast, by Production Analysis 2020 & 2033
- Table 99: Global Vanilla Bean Market Revenue Million Forecast, by Consumption Analysis 2020 & 2033
- Table 100: Global Vanilla Bean Market Volume Kiloton Forecast, by Consumption Analysis 2020 & 2033
- Table 101: Global Vanilla Bean Market Revenue Million Forecast, by Import Market Analysis (Value & Volume) 2020 & 2033
- Table 102: Global Vanilla Bean Market Volume Kiloton Forecast, by Import Market Analysis (Value & Volume) 2020 & 2033
- Table 103: Global Vanilla Bean Market Revenue Million Forecast, by Export Market Analysis (Value & Volume) 2020 & 2033
- Table 104: Global Vanilla Bean Market Volume Kiloton Forecast, by Export Market Analysis (Value & Volume) 2020 & 2033
- Table 105: Global Vanilla Bean Market Revenue Million Forecast, by Price Trend Analysis 2020 & 2033
- Table 106: Global Vanilla Bean Market Volume Kiloton Forecast, by Price Trend Analysis 2020 & 2033
- Table 107: Global Vanilla Bean Market Revenue Million Forecast, by Country 2020 & 2033
- Table 108: Global Vanilla Bean Market Volume Kiloton Forecast, by Country 2020 & 2033
- Table 109: Global Vanilla Bean Market Revenue Million Forecast, by Production Analysis 2020 & 2033
- Table 110: Global Vanilla Bean Market Volume Kiloton Forecast, by Production Analysis 2020 & 2033
- Table 111: Global Vanilla Bean Market Revenue Million Forecast, by Consumption Analysis 2020 & 2033
- Table 112: Global Vanilla Bean Market Volume Kiloton Forecast, by Consumption Analysis 2020 & 2033
- Table 113: Global Vanilla Bean Market Revenue Million Forecast, by Import Market Analysis (Value & Volume) 2020 & 2033
- Table 114: Global Vanilla Bean Market Volume Kiloton Forecast, by Import Market Analysis (Value & Volume) 2020 & 2033
- Table 115: Global Vanilla Bean Market Revenue Million Forecast, by Export Market Analysis (Value & Volume) 2020 & 2033
- Table 116: Global Vanilla Bean Market Volume Kiloton Forecast, by Export Market Analysis (Value & Volume) 2020 & 2033
- Table 117: Global Vanilla Bean Market Revenue Million Forecast, by Price Trend Analysis 2020 & 2033
- Table 118: Global Vanilla Bean Market Volume Kiloton Forecast, by Price Trend Analysis 2020 & 2033
- Table 119: Global Vanilla Bean Market Revenue Million Forecast, by Country 2020 & 2033
- Table 120: Global Vanilla Bean Market Volume Kiloton Forecast, by Country 2020 & 2033
- Table 121: Global Vanilla Bean Market Revenue Million Forecast, by Production Analysis 2020 & 2033
- Table 122: Global Vanilla Bean Market Volume Kiloton Forecast, by Production Analysis 2020 & 2033
- Table 123: Global Vanilla Bean Market Revenue Million Forecast, by Consumption Analysis 2020 & 2033
- Table 124: Global Vanilla Bean Market Volume Kiloton Forecast, by Consumption Analysis 2020 & 2033
- Table 125: Global Vanilla Bean Market Revenue Million Forecast, by Import Market Analysis (Value & Volume) 2020 & 2033
- Table 126: Global Vanilla Bean Market Volume Kiloton Forecast, by Import Market Analysis (Value & Volume) 2020 & 2033
- Table 127: Global Vanilla Bean Market Revenue Million Forecast, by Export Market Analysis (Value & Volume) 2020 & 2033
- Table 128: Global Vanilla Bean Market Volume Kiloton Forecast, by Export Market Analysis (Value & Volume) 2020 & 2033
- Table 129: Global Vanilla Bean Market Revenue Million Forecast, by Price Trend Analysis 2020 & 2033
- Table 130: Global Vanilla Bean Market Volume Kiloton Forecast, by Price Trend Analysis 2020 & 2033
- Table 131: Global Vanilla Bean Market Revenue Million Forecast, by Country 2020 & 2033
- Table 132: Global Vanilla Bean Market Volume Kiloton Forecast, by Country 2020 & 2033
- Table 133: Global Vanilla Bean Market Revenue Million Forecast, by Production Analysis 2020 & 2033
- Table 134: Global Vanilla Bean Market Volume Kiloton Forecast, by Production Analysis 2020 & 2033
- Table 135: Global Vanilla Bean Market Revenue Million Forecast, by Consumption Analysis 2020 & 2033
- Table 136: Global Vanilla Bean Market Volume Kiloton Forecast, by Consumption Analysis 2020 & 2033
- Table 137: Global Vanilla Bean Market Revenue Million Forecast, by Import Market Analysis (Value & Volume) 2020 & 2033
- Table 138: Global Vanilla Bean Market Volume Kiloton Forecast, by Import Market Analysis (Value & Volume) 2020 & 2033
- Table 139: Global Vanilla Bean Market Revenue Million Forecast, by Export Market Analysis (Value & Volume) 2020 & 2033
- Table 140: Global Vanilla Bean Market Volume Kiloton Forecast, by Export Market Analysis (Value & Volume) 2020 & 2033
- Table 141: Global Vanilla Bean Market Revenue Million Forecast, by Price Trend Analysis 2020 & 2033
- Table 142: Global Vanilla Bean Market Volume Kiloton Forecast, by Price Trend Analysis 2020 & 2033
- Table 143: Global Vanilla Bean Market Revenue Million Forecast, by Country 2020 & 2033
- Table 144: Global Vanilla Bean Market Volume Kiloton Forecast, by Country 2020 & 2033
- Table 145: Global Vanilla Bean Market Revenue Million Forecast, by Production Analysis 2020 & 2033
- Table 146: Global Vanilla Bean Market Volume Kiloton Forecast, by Production Analysis 2020 & 2033
- Table 147: Global Vanilla Bean Market Revenue Million Forecast, by Consumption Analysis 2020 & 2033
- Table 148: Global Vanilla Bean Market Volume Kiloton Forecast, by Consumption Analysis 2020 & 2033
- Table 149: Global Vanilla Bean Market Revenue Million Forecast, by Import Market Analysis (Value & Volume) 2020 & 2033
- Table 150: Global Vanilla Bean Market Volume Kiloton Forecast, by Import Market Analysis (Value & Volume) 2020 & 2033
- Table 151: Global Vanilla Bean Market Revenue Million Forecast, by Export Market Analysis (Value & Volume) 2020 & 2033
- Table 152: Global Vanilla Bean Market Volume Kiloton Forecast, by Export Market Analysis (Value & Volume) 2020 & 2033
- Table 153: Global Vanilla Bean Market Revenue Million Forecast, by Price Trend Analysis 2020 & 2033
- Table 154: Global Vanilla Bean Market Volume Kiloton Forecast, by Price Trend Analysis 2020 & 2033
- Table 155: Global Vanilla Bean Market Revenue Million Forecast, by Country 2020 & 2033
- Table 156: Global Vanilla Bean Market Volume Kiloton Forecast, by Country 2020 & 2033
Frequently Asked Questions
1. What is the projected Compound Annual Growth Rate (CAGR) of the Vanilla Bean Market?
The projected CAGR is approximately 2.60%.
2. Which companies are prominent players in the Vanilla Bean Market?
Key companies in the market include E. Guittard & Co., Beanilla, McCormick & Company , Madagascar Gourmet, Indriani, VanillaVida, Nielsen-Massey Vanillas .
3. What are the main segments of the Vanilla Bean Market?
The market segments include Production Analysis, Consumption Analysis, Import Market Analysis (Value & Volume), Export Market Analysis (Value & Volume), Price Trend Analysis.
4. Can you provide details about the market size?
The market size is estimated to be USD 2.16 Million as of 2022.
5. What are some drivers contributing to market growth?
; Awareness About Health Benefits Associated With Pecan Consumption; Wide Application of Pecan.
6. What are the notable trends driving market growth?
Application in Food and Pharmaceutical Industry is Driving the Market.
7. Are there any restraints impacting market growth?
; Volatility in the Prices; Adverse Weather Conditions Affecting Yield.
8. Can you provide examples of recent developments in the market?
June 2022: As of June 2022, around 25,000 hectares of land in Madagascar is dedicated to vanilla cultivation, engaging as many as 80,000 farmers. The majority of the world's finest beans come from the northeastern Sava region. Madagascan vanilla is mainly used in the chocolates, cakes, and ice creams sold to consumers around the globe.
9. What pricing options are available for accessing the report?
Pricing options include single-user, multi-user, and enterprise licenses priced at USD 4750, USD 5250, and USD 8750 respectively.
10. Is the market size provided in terms of value or volume?
The market size is provided in terms of value, measured in Million and volume, measured in Kiloton.
11. Are there any specific market keywords associated with the report?
Yes, the market keyword associated with the report is "Vanilla Bean Market," which aids in identifying and referencing the specific market segment covered.
12. How do I determine which pricing option suits my needs best?
The pricing options vary based on user requirements and access needs. Individual users may opt for single-user licenses, while businesses requiring broader access may choose multi-user or enterprise licenses for cost-effective access to the report.
13. Are there any additional resources or data provided in the Vanilla Bean Market report?
While the report offers comprehensive insights, it's advisable to review the specific contents or supplementary materials provided to ascertain if additional resources or data are available.
14. How can I stay updated on further developments or reports in the Vanilla Bean Market?
To stay informed about further developments, trends, and reports in the Vanilla Bean Market, consider subscribing to industry newsletters, following relevant companies and organizations, or regularly checking reputable industry news sources and publications.
Methodology
Step 1 - Identification of Relevant Samples Size from Population Database


Step 2 - Approaches for Defining Global Market Size (Value, Volume* & Price*)

Note*: In applicable scenarios
Step 3 - Data Sources
Primary Research
- Web Analytics
- Survey Reports
- Research Institute
- Latest Research Reports
- Opinion Leaders
Secondary Research
- Annual Reports
- White Paper
- Latest Press Release
- Industry Association
- Paid Database
- Investor Presentations

Step 4 - Data Triangulation
Involves using different sources of information in order to increase the validity of a study
These sources are likely to be stakeholders in a program - participants, other researchers, program staff, other community members, and so on.
Then we put all data in single framework & apply various statistical tools to find out the dynamic on the market.
During the analysis stage, feedback from the stakeholder groups would be compared to determine areas of agreement as well as areas of divergence