

Key Insights
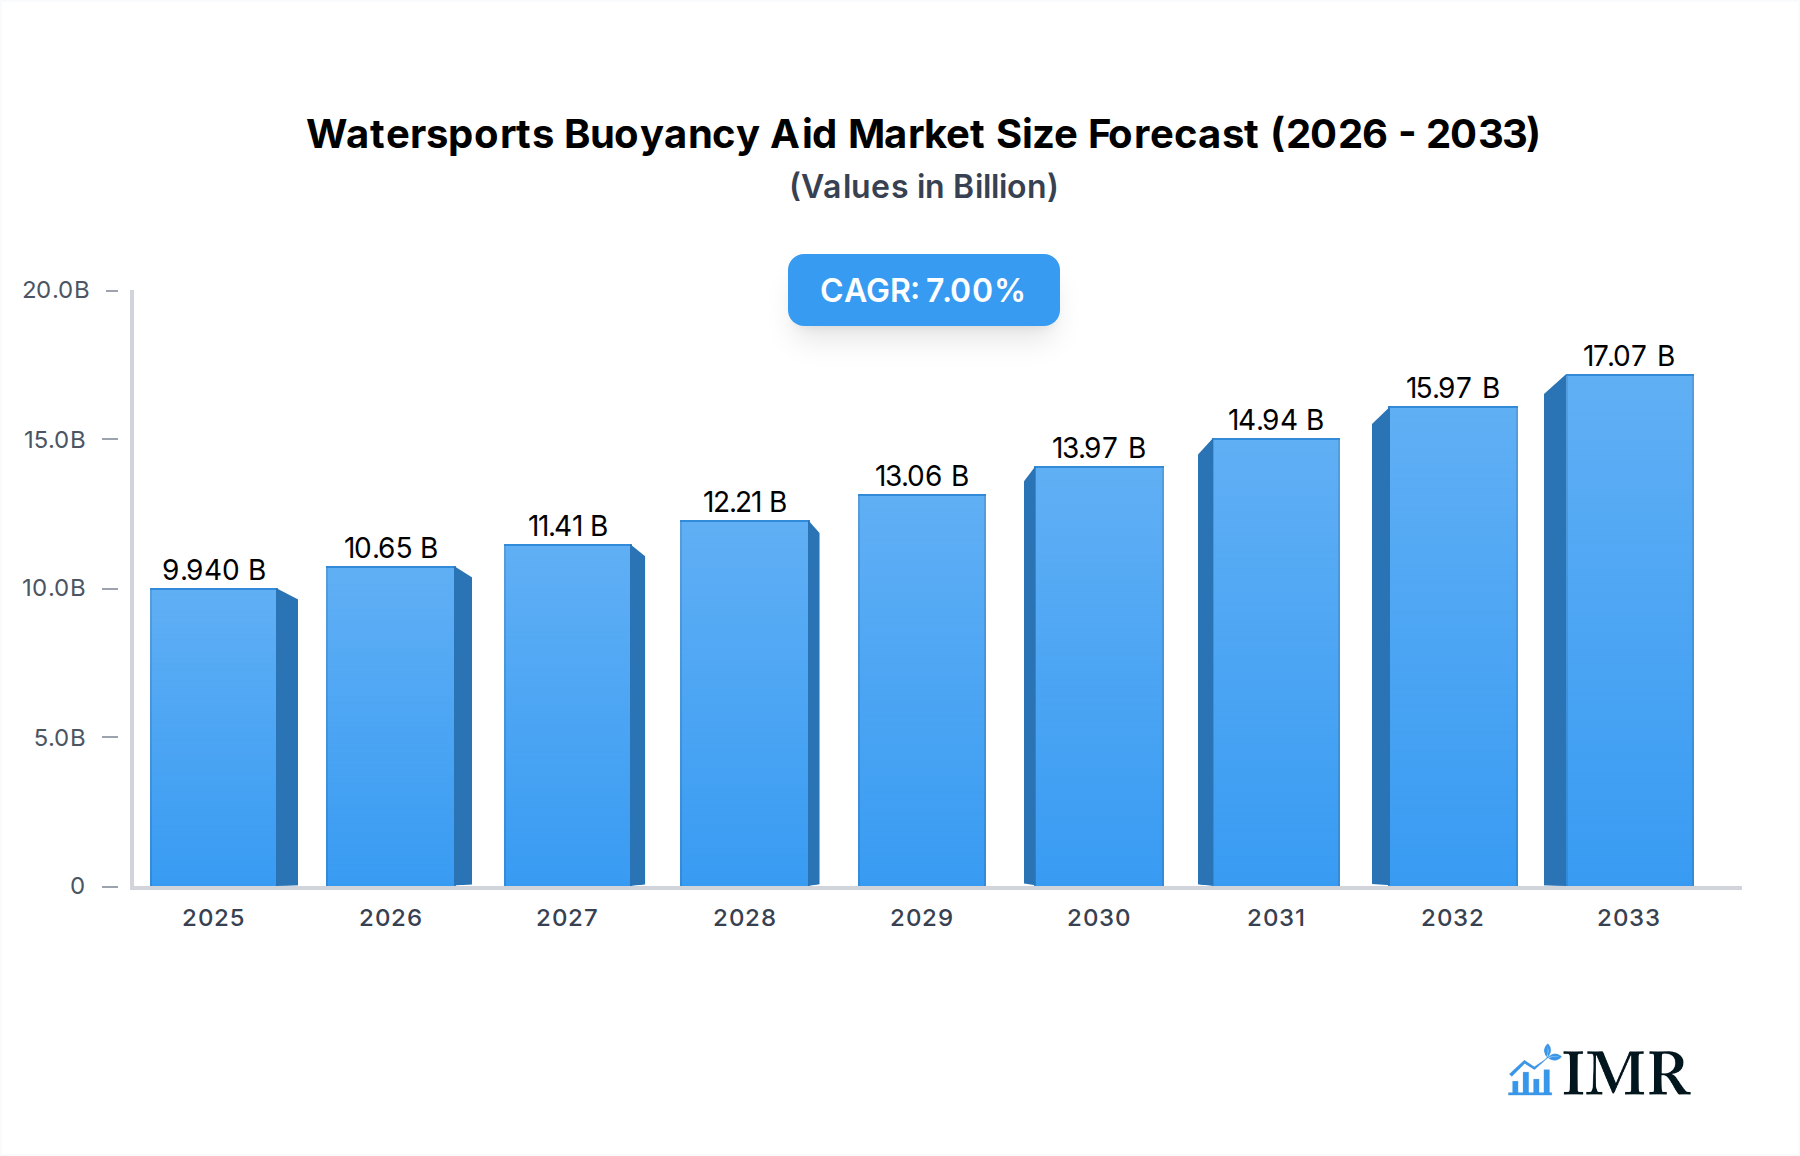
The global Watersports Buoyancy Aid market is poised for substantial growth, projected to reach an estimated $9.94 billion in 2025, driven by a robust CAGR of 7.08% through the forecast period. This expansion is fueled by an increasing global participation in recreational water activities, a rising awareness of water safety, and the continuous innovation in product design and materials leading to more comfortable and performance-oriented buoyancy aids. The growing emphasis on adventure tourism and the accessibility of water sports across various demographics further contribute to this positive market trajectory. Demand is particularly strong from the private boat ownership segment, which is experiencing a resurgence, and the expanding commercial maritime sector, including cruise lines and tour operators prioritizing passenger safety. The increasing disposable income of consumers in emerging economies also plays a significant role, enabling broader adoption of water sports and related safety equipment.

Watersports Buoyancy Aid Market Size (In Billion)
Looking ahead, the market is characterized by evolving trends such as the development of lightweight, ergonomic, and eco-friendly buoyancy aids, alongside the integration of smart technologies for enhanced safety features. The rising popularity of niche water sports like paddleboarding, kayaking, and wakeboarding is also creating new avenues for market growth, with manufacturers catering to specific performance needs. Despite the positive outlook, the market faces some restraints, including the initial cost of high-performance buoyancy aids and potential regulatory hurdles in certain regions that might impact product standardization. However, the overarching trend towards enhanced safety consciousness and the recreational allure of water-based activities are expected to largely overshadow these challenges, ensuring a dynamic and expanding market for watersports buoyancy aids.
Watersports Buoyancy Aid Company Market Share
This in-depth report provides a critical analysis of the global Watersports Buoyancy Aid market, offering precise forecasts and actionable insights for industry stakeholders. Covering the historical period from 2019 to 2024, the base year of 2025, and a comprehensive forecast period extending to 2033, this report delves into market dynamics, growth drivers, regional dominance, product innovation, and competitive landscapes. We analyze both the parent market (overall buoyancy aids) and the child market (specifically watersports applications), providing a dual perspective crucial for strategic decision-making. High-traffic keywords such as "watersports safety equipment," "PFD market size," "life jacket trends," "kayaking buoyancy aid," "wakeboarding vest," "sailing life vest," and "commercial marine safety" are integrated throughout to ensure maximum search engine visibility.
Watersports Buoyancy Aid Market Dynamics & Structure
The global Watersports Buoyancy Aid market exhibits a moderate level of concentration, with a few key players holding significant market share. Technological innovation plays a pivotal role, driven by advancements in materials science for lighter, more durable, and comfortable designs, alongside the integration of smart features for enhanced safety. Regulatory frameworks, particularly those related to maritime safety and personal flotation devices (PFDs), significantly influence market entry and product development. Competitive product substitutes, such as inflatable life rafts and advanced personal safety devices, pose a consideration, although the inherent simplicity and reliability of buoyancy aids maintain their dominance in many watersports. End-user demographics are increasingly diverse, encompassing recreational enthusiasts, professional athletes, and commercial maritime operators. Mergers and acquisitions (M&A) trends indicate strategic consolidation, aiming to expand product portfolios and market reach. For instance, the M&A volume in the broader marine safety equipment sector is estimated to be in the range of 0.5 to 1.2 billion units of deal value over the study period. Key innovation barriers include the cost of advanced materials and the rigorous testing required for safety certifications.
- Market Concentration: Moderate to High, with leading brands dominating.
- Technological Innovation Drivers: Advanced material science, ergonomic design, smart safety features.
- Regulatory Frameworks: ISO, CE, Coast Guard certifications are critical.
- Competitive Substitutes: Inflatable rafts, advanced personal beacons.
- End-User Demographics: Recreational users, professional athletes, commercial operators.
- M&A Trends: Strategic acquisitions for market share and portfolio expansion.
Watersports Buoyancy Aid Growth Trends & Insights
The global Watersports Buoyancy Aid market is projected to experience robust growth, with an estimated Compound Annual Growth Rate (CAGR) of 4.5% between 2025 and 2033. The market size, estimated at a current value of approximately 1.8 billion units in 2025, is expected to reach over 2.5 billion units by the end of the forecast period. This growth is fueled by increasing participation in watersports globally, rising awareness of water safety, and advancements in product technology. Adoption rates are particularly high among younger demographics and in regions with a strong coastal presence and well-developed water tourism infrastructure. Technological disruptions are leading to the development of more specialized buoyancy aids, catering to specific activities like wakeboarding, kitesurfing, and paddleboarding, offering enhanced mobility and performance. Consumer behavior shifts are also notable, with a growing preference for lightweight, comfortable, and aesthetically pleasing buoyancy aids that do not impede movement. The market penetration for certified buoyancy aids in recreational watersports is anticipated to grow from 70% in 2025 to 85% by 2033. Furthermore, the commercial vessel segment is seeing increased investment in safety equipment, driven by stringent international maritime regulations and a focus on crew welfare. The integration of advanced materials like neoprene and specialized foam is enhancing buoyancy and durability, leading to higher consumer satisfaction and repeat purchases. The development of eco-friendly and sustainable buoyancy aids is also emerging as a significant trend, appealing to environmentally conscious consumers.
Dominant Regions, Countries, or Segments in Watersports Buoyancy Aid
North America and Europe are currently the dominant regions driving the Watersports Buoyancy Aid market, collectively accounting for over 60% of the global market share. Within these regions, countries like the United States, Canada, Germany, the United Kingdom, and France are leading the charge, fueled by well-established watersports cultures, significant disposable income, and robust tourism sectors. The Application: Private Ships segment, encompassing recreational boating and personal watercraft, represents the largest end-user segment, driven by increased leisure time and a growing fleet of private vessels. This segment alone is estimated to contribute 55% to the total market value in 2025. In terms of Types, the Men's buoyancy aids represent the largest share, owing to historically higher participation rates in many watersports, though the Women's segment is experiencing a faster growth rate due to increasing female participation and specialized product offerings. The Commercial Vessels segment, while smaller in unit volume compared to private ships, represents a significant market value due to the requirement for certified, high-durability PFDs for all crew members and passengers. Key drivers for dominance include strong economic policies supporting outdoor recreation, continuous investment in water sports infrastructure, and effective marketing campaigns by leading manufacturers. The market share in North America is projected to be around 35% in 2025, with a CAGR of 4.2%, while Europe is expected to hold 30% with a CAGR of 4.0%. Emerging markets in Asia-Pacific, particularly in Southeast Asia and Australia, are showing promising growth trajectories, driven by expanding tourism and a rising middle class with increasing disposable income for recreational activities.
- Leading Regions: North America and Europe.
- Key Dominant Countries: USA, Canada, Germany, UK, France.
- Dominant Application Segment: Private Ships (55% market share in 2025).
- Dominant Type Segment: Men's Buoyancy Aids (growing, but Women's segment showing faster growth).
- Growth Potential: Significant expansion in Asia-Pacific.
Watersports Buoyancy Aid Product Landscape
The Watersports Buoyancy Aid product landscape is characterized by continuous innovation focused on enhancing user comfort, safety, and performance. Modern buoyancy aids utilize advanced, lightweight, and quick-drying materials like neoprene and specialized closed-cell foams, providing superior flotation without restricting movement. Unique selling propositions often revolve around ergonomic designs tailored for specific activities such as kayaking, paddleboarding, wakeboarding, and sailing. Technological advancements include the integration of multiple adjustment points for a secure fit, larger armholes for enhanced mobility, and reflective elements for increased visibility. Performance metrics are increasingly being scrutinized, with an emphasis on buoyancy ratings (e.g., ISO standards), durability against abrasion and UV exposure, and ease of donning and doffing. Innovations are also emerging in the form of hybrid buoyancy aids, combining foam with inflatable chambers for adaptable buoyancy levels.
Key Drivers, Barriers & Challenges in Watersports Buoyancy Aid
Key Drivers: The primary forces propelling the Watersports Buoyancy Aid market are the escalating global participation in recreational and professional watersports, a growing emphasis on water safety awareness among consumers, and continuous technological advancements leading to more comfortable, functional, and specialized buoyancy aids. Government initiatives promoting water safety and the expansion of marine tourism infrastructure also contribute significantly.
Key Barriers & Challenges: Supply chain disruptions, particularly concerning raw material availability and logistics, pose a significant challenge, impacting production timelines and costs. Stringent and evolving regulatory hurdles for safety certifications can also act as a barrier to entry for new players. Intense competitive pressures from both established brands and emerging manufacturers, coupled with the threat of counterfeit products, necessitate constant innovation and competitive pricing strategies. The cost of advanced materials can also be a barrier for some consumers.
Emerging Opportunities in Watersports Buoyancy Aid
Emerging opportunities lie in the development of highly specialized buoyancy aids catering to niche watersports such as wing foiling and freediving, requiring unique design features. The increasing demand for sustainable and eco-friendly products presents a significant avenue, with brands exploring recycled materials and reduced manufacturing footprints. Untapped markets in developing economies with growing interest in outdoor recreation and watersports also offer substantial growth potential. Furthermore, the integration of IoT technology for enhanced safety monitoring and communication features in advanced buoyancy aids represents a future innovation frontier. The expansion of rental services for watersports equipment, including buoyancy aids, in tourist destinations is another promising area.
Growth Accelerators in the Watersports Buoyancy Aid Industry
Catalysts driving long-term growth in the Watersports Buoyancy Aid industry include sustained investments in research and development for next-generation materials and safety technologies. Strategic partnerships between buoyancy aid manufacturers and watersports event organizers or governing bodies can accelerate market penetration and brand visibility. Market expansion strategies, such as the development of region-specific product lines and effective distribution networks in emerging economies, will be crucial. The growing trend of "staycations" and increased investment in personal outdoor equipment by consumers are also significant growth accelerators.
Key Players Shaping the Watersports Buoyancy Aid Market
- Veleria San Giorgio
- Aquadesign
- Grabner GmbH
- Spinera
- KOLIBRI
- Regatta
- Forward WIP
- Ordana
- RTM kayaks
- LALIZAS
- Eval
- O'Brien
- GILL
- Helly Hansen
- Hyperlite Wakeboards
- Stearns
- Goode
- Crewsaver
Notable Milestones in Watersports Buoyancy Aid Sector
- 2019: Launch of new eco-friendly buoyancy aid lines by several key manufacturers.
- 2020: Increased demand for personal safety equipment due to a surge in domestic recreational activities.
- 2021: Introduction of advanced ergonomic designs for improved flexibility in competitive watersports.
- 2022: Several acquisitions within the marine safety equipment sector, consolidating market positions.
- 2023: Focus on smart buoyancy aid technology with integrated GPS and communication features.
- 2024: Growing adoption of recycled materials and sustainable manufacturing processes.
In-Depth Watersports Buoyancy Aid Market Outlook
The future outlook for the Watersports Buoyancy Aid market remains exceptionally positive, driven by sustained global interest in watersports and an unwavering commitment to safety. Growth accelerators, including continuous technological innovation in materials and design, strategic market expansions into underserved regions, and the increasing consumer preference for specialized and performance-oriented gear, will continue to fuel expansion. The market is poised to benefit from a growing awareness of the importance of certified safety equipment, particularly among new entrants to watersports. Strategic partnerships and a focus on sustainability will further solidify market leadership. The overall market potential is substantial, indicating a period of consistent growth and innovation in the coming years.
Watersports Buoyancy Aid Segmentation
-
1. Application
- 1.1. Private Ships
- 1.2. Commercial Vessels
-
2. Types
- 2.1. Men
- 2.2. Women
Watersports Buoyancy Aid Segmentation By Geography
-
1. North America
- 1.1. United States
- 1.2. Canada
- 1.3. Mexico
-
2. South America
- 2.1. Brazil
- 2.2. Argentina
- 2.3. Rest of South America
-
3. Europe
- 3.1. United Kingdom
- 3.2. Germany
- 3.3. France
- 3.4. Italy
- 3.5. Spain
- 3.6. Russia
- 3.7. Benelux
- 3.8. Nordics
- 3.9. Rest of Europe
-
4. Middle East & Africa
- 4.1. Turkey
- 4.2. Israel
- 4.3. GCC
- 4.4. North Africa
- 4.5. South Africa
- 4.6. Rest of Middle East & Africa
-
5. Asia Pacific
- 5.1. China
- 5.2. India
- 5.3. Japan
- 5.4. South Korea
- 5.5. ASEAN
- 5.6. Oceania
- 5.7. Rest of Asia Pacific
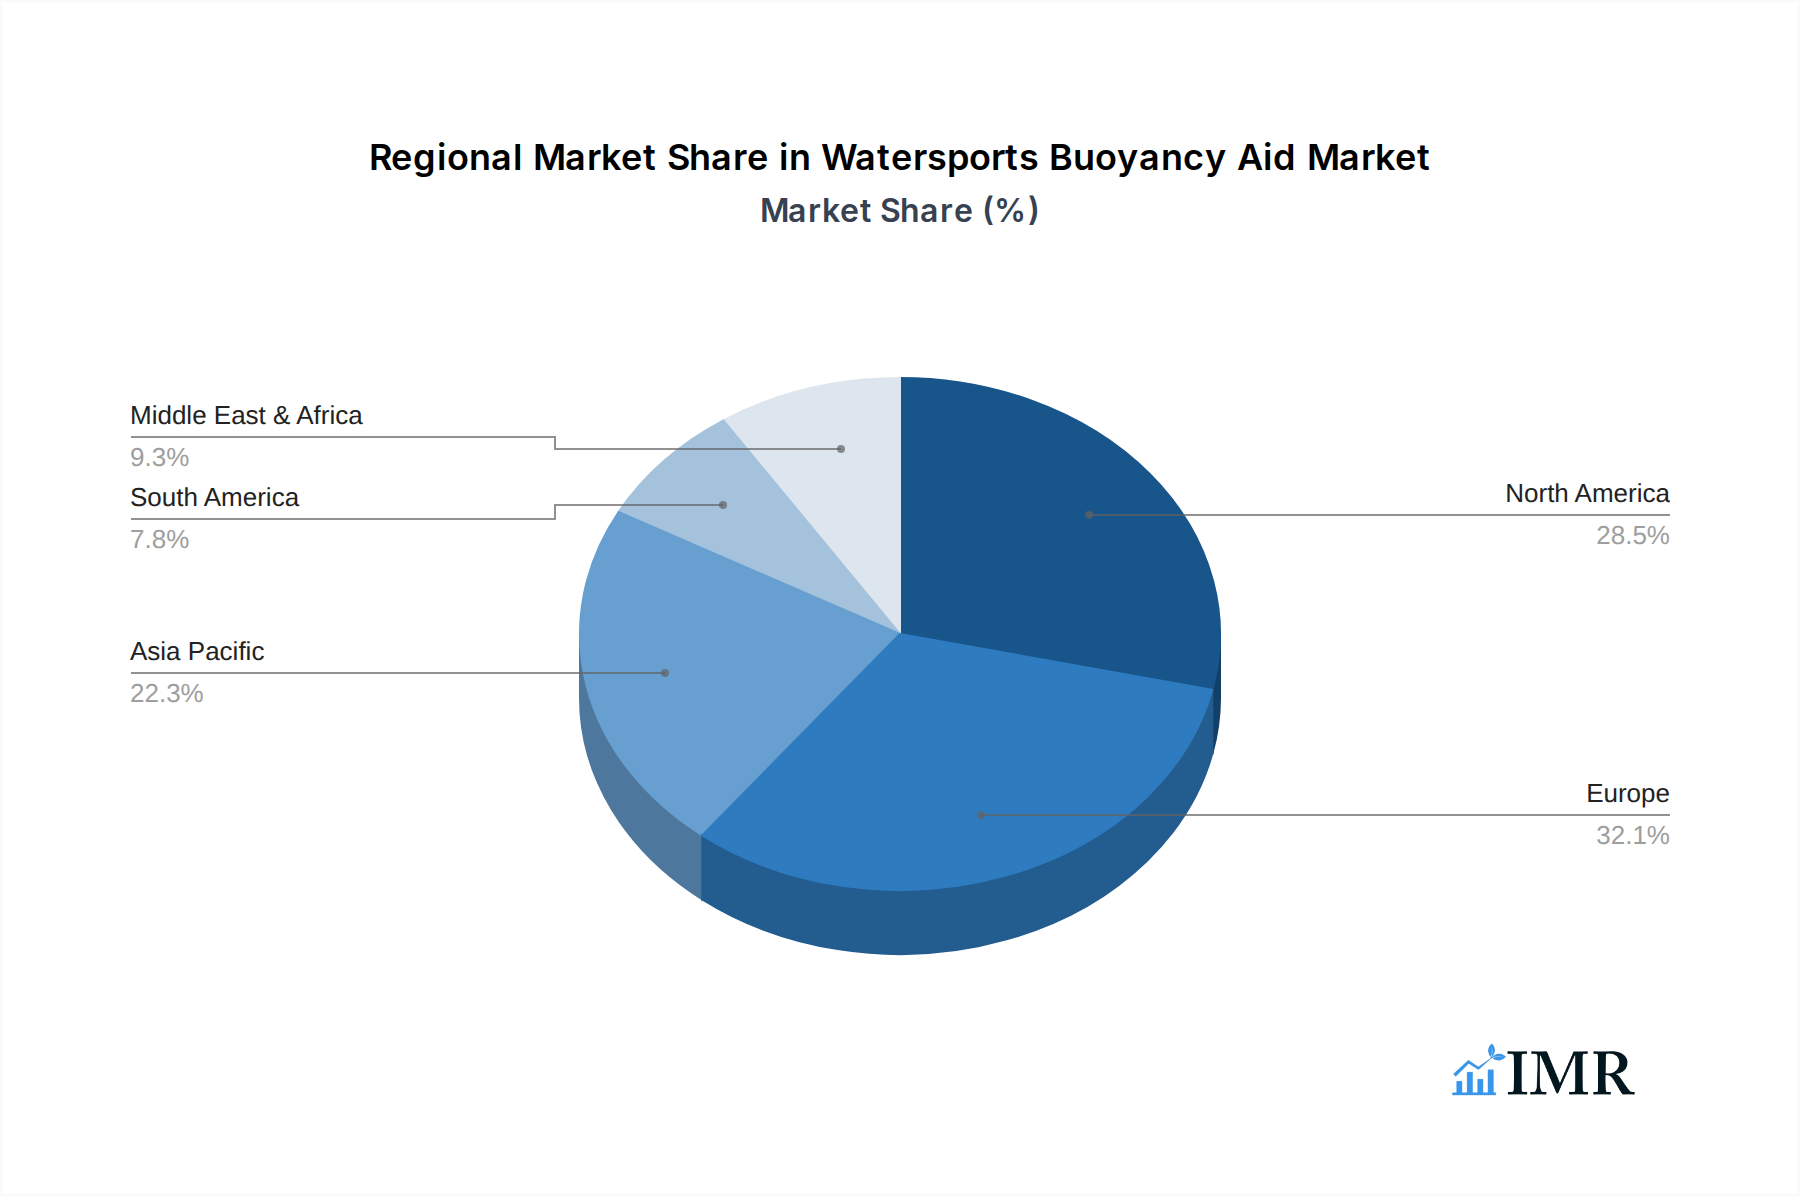
Watersports Buoyancy Aid Regional Market Share
Geographic Coverage of Watersports Buoyancy Aid
Watersports Buoyancy Aid REPORT HIGHLIGHTS
| Aspects | Details |
|---|---|
| Study Period | 2020-2034 |
| Base Year | 2025 |
| Estimated Year | 2026 |
| Forecast Period | 2026-2034 |
| Historical Period | 2020-2025 |
| Growth Rate | CAGR of 7.08% from 2020-2034 |
| Segmentation |
|
Table of Contents
- 1. Introduction
- 1.1. Research Scope
- 1.2. Market Segmentation
- 1.3. Research Methodology
- 1.4. Definitions and Assumptions
- 2. Executive Summary
- 2.1. Introduction
- 3. Market Dynamics
- 3.1. Introduction
- 3.2. Market Drivers
- 3.3. Market Restrains
- 3.4. Market Trends
- 4. Market Factor Analysis
- 4.1. Porters Five Forces
- 4.2. Supply/Value Chain
- 4.3. PESTEL analysis
- 4.4. Market Entropy
- 4.5. Patent/Trademark Analysis
- 5. Global Watersports Buoyancy Aid Analysis, Insights and Forecast, 2020-2032
- 5.1. Market Analysis, Insights and Forecast - by Application
- 5.1.1. Private Ships
- 5.1.2. Commercial Vessels
- 5.2. Market Analysis, Insights and Forecast - by Types
- 5.2.1. Men
- 5.2.2. Women
- 5.3. Market Analysis, Insights and Forecast - by Region
- 5.3.1. North America
- 5.3.2. South America
- 5.3.3. Europe
- 5.3.4. Middle East & Africa
- 5.3.5. Asia Pacific
- 5.1. Market Analysis, Insights and Forecast - by Application
- 6. North America Watersports Buoyancy Aid Analysis, Insights and Forecast, 2020-2032
- 6.1. Market Analysis, Insights and Forecast - by Application
- 6.1.1. Private Ships
- 6.1.2. Commercial Vessels
- 6.2. Market Analysis, Insights and Forecast - by Types
- 6.2.1. Men
- 6.2.2. Women
- 6.1. Market Analysis, Insights and Forecast - by Application
- 7. South America Watersports Buoyancy Aid Analysis, Insights and Forecast, 2020-2032
- 7.1. Market Analysis, Insights and Forecast - by Application
- 7.1.1. Private Ships
- 7.1.2. Commercial Vessels
- 7.2. Market Analysis, Insights and Forecast - by Types
- 7.2.1. Men
- 7.2.2. Women
- 7.1. Market Analysis, Insights and Forecast - by Application
- 8. Europe Watersports Buoyancy Aid Analysis, Insights and Forecast, 2020-2032
- 8.1. Market Analysis, Insights and Forecast - by Application
- 8.1.1. Private Ships
- 8.1.2. Commercial Vessels
- 8.2. Market Analysis, Insights and Forecast - by Types
- 8.2.1. Men
- 8.2.2. Women
- 8.1. Market Analysis, Insights and Forecast - by Application
- 9. Middle East & Africa Watersports Buoyancy Aid Analysis, Insights and Forecast, 2020-2032
- 9.1. Market Analysis, Insights and Forecast - by Application
- 9.1.1. Private Ships
- 9.1.2. Commercial Vessels
- 9.2. Market Analysis, Insights and Forecast - by Types
- 9.2.1. Men
- 9.2.2. Women
- 9.1. Market Analysis, Insights and Forecast - by Application
- 10. Asia Pacific Watersports Buoyancy Aid Analysis, Insights and Forecast, 2020-2032
- 10.1. Market Analysis, Insights and Forecast - by Application
- 10.1.1. Private Ships
- 10.1.2. Commercial Vessels
- 10.2. Market Analysis, Insights and Forecast - by Types
- 10.2.1. Men
- 10.2.2. Women
- 10.1. Market Analysis, Insights and Forecast - by Application
- 11. Competitive Analysis
- 11.1. Global Market Share Analysis 2025
- 11.2. Company Profiles
- 11.2.1 Veleria San Giorgio
- 11.2.1.1. Overview
- 11.2.1.2. Products
- 11.2.1.3. SWOT Analysis
- 11.2.1.4. Recent Developments
- 11.2.1.5. Financials (Based on Availability)
- 11.2.2 Aquadesign
- 11.2.2.1. Overview
- 11.2.2.2. Products
- 11.2.2.3. SWOT Analysis
- 11.2.2.4. Recent Developments
- 11.2.2.5. Financials (Based on Availability)
- 11.2.3 Grabner GmbH
- 11.2.3.1. Overview
- 11.2.3.2. Products
- 11.2.3.3. SWOT Analysis
- 11.2.3.4. Recent Developments
- 11.2.3.5. Financials (Based on Availability)
- 11.2.4 Spinera
- 11.2.4.1. Overview
- 11.2.4.2. Products
- 11.2.4.3. SWOT Analysis
- 11.2.4.4. Recent Developments
- 11.2.4.5. Financials (Based on Availability)
- 11.2.5 KOLIBRI
- 11.2.5.1. Overview
- 11.2.5.2. Products
- 11.2.5.3. SWOT Analysis
- 11.2.5.4. Recent Developments
- 11.2.5.5. Financials (Based on Availability)
- 11.2.6 Regatta
- 11.2.6.1. Overview
- 11.2.6.2. Products
- 11.2.6.3. SWOT Analysis
- 11.2.6.4. Recent Developments
- 11.2.6.5. Financials (Based on Availability)
- 11.2.7 Forward WIP
- 11.2.7.1. Overview
- 11.2.7.2. Products
- 11.2.7.3. SWOT Analysis
- 11.2.7.4. Recent Developments
- 11.2.7.5. Financials (Based on Availability)
- 11.2.8 Ordana
- 11.2.8.1. Overview
- 11.2.8.2. Products
- 11.2.8.3. SWOT Analysis
- 11.2.8.4. Recent Developments
- 11.2.8.5. Financials (Based on Availability)
- 11.2.9 RTM kayaks
- 11.2.9.1. Overview
- 11.2.9.2. Products
- 11.2.9.3. SWOT Analysis
- 11.2.9.4. Recent Developments
- 11.2.9.5. Financials (Based on Availability)
- 11.2.10 LALIZAS
- 11.2.10.1. Overview
- 11.2.10.2. Products
- 11.2.10.3. SWOT Analysis
- 11.2.10.4. Recent Developments
- 11.2.10.5. Financials (Based on Availability)
- 11.2.11 Eval
- 11.2.11.1. Overview
- 11.2.11.2. Products
- 11.2.11.3. SWOT Analysis
- 11.2.11.4. Recent Developments
- 11.2.11.5. Financials (Based on Availability)
- 11.2.12 O'Brien
- 11.2.12.1. Overview
- 11.2.12.2. Products
- 11.2.12.3. SWOT Analysis
- 11.2.12.4. Recent Developments
- 11.2.12.5. Financials (Based on Availability)
- 11.2.13 GILL
- 11.2.13.1. Overview
- 11.2.13.2. Products
- 11.2.13.3. SWOT Analysis
- 11.2.13.4. Recent Developments
- 11.2.13.5. Financials (Based on Availability)
- 11.2.14 Helly Hansen
- 11.2.14.1. Overview
- 11.2.14.2. Products
- 11.2.14.3. SWOT Analysis
- 11.2.14.4. Recent Developments
- 11.2.14.5. Financials (Based on Availability)
- 11.2.15 Hyperlite Wakeboards
- 11.2.15.1. Overview
- 11.2.15.2. Products
- 11.2.15.3. SWOT Analysis
- 11.2.15.4. Recent Developments
- 11.2.15.5. Financials (Based on Availability)
- 11.2.16 Stearns
- 11.2.16.1. Overview
- 11.2.16.2. Products
- 11.2.16.3. SWOT Analysis
- 11.2.16.4. Recent Developments
- 11.2.16.5. Financials (Based on Availability)
- 11.2.17 Goode
- 11.2.17.1. Overview
- 11.2.17.2. Products
- 11.2.17.3. SWOT Analysis
- 11.2.17.4. Recent Developments
- 11.2.17.5. Financials (Based on Availability)
- 11.2.18 Crewsaver
- 11.2.18.1. Overview
- 11.2.18.2. Products
- 11.2.18.3. SWOT Analysis
- 11.2.18.4. Recent Developments
- 11.2.18.5. Financials (Based on Availability)
- 11.2.1 Veleria San Giorgio
List of Figures
- Figure 1: Global Watersports Buoyancy Aid Revenue Breakdown (billion, %) by Region 2025 & 2033
- Figure 2: North America Watersports Buoyancy Aid Revenue (billion), by Application 2025 & 2033
- Figure 3: North America Watersports Buoyancy Aid Revenue Share (%), by Application 2025 & 2033
- Figure 4: North America Watersports Buoyancy Aid Revenue (billion), by Types 2025 & 2033
- Figure 5: North America Watersports Buoyancy Aid Revenue Share (%), by Types 2025 & 2033
- Figure 6: North America Watersports Buoyancy Aid Revenue (billion), by Country 2025 & 2033
- Figure 7: North America Watersports Buoyancy Aid Revenue Share (%), by Country 2025 & 2033
- Figure 8: South America Watersports Buoyancy Aid Revenue (billion), by Application 2025 & 2033
- Figure 9: South America Watersports Buoyancy Aid Revenue Share (%), by Application 2025 & 2033
- Figure 10: South America Watersports Buoyancy Aid Revenue (billion), by Types 2025 & 2033
- Figure 11: South America Watersports Buoyancy Aid Revenue Share (%), by Types 2025 & 2033
- Figure 12: South America Watersports Buoyancy Aid Revenue (billion), by Country 2025 & 2033
- Figure 13: South America Watersports Buoyancy Aid Revenue Share (%), by Country 2025 & 2033
- Figure 14: Europe Watersports Buoyancy Aid Revenue (billion), by Application 2025 & 2033
- Figure 15: Europe Watersports Buoyancy Aid Revenue Share (%), by Application 2025 & 2033
- Figure 16: Europe Watersports Buoyancy Aid Revenue (billion), by Types 2025 & 2033
- Figure 17: Europe Watersports Buoyancy Aid Revenue Share (%), by Types 2025 & 2033
- Figure 18: Europe Watersports Buoyancy Aid Revenue (billion), by Country 2025 & 2033
- Figure 19: Europe Watersports Buoyancy Aid Revenue Share (%), by Country 2025 & 2033
- Figure 20: Middle East & Africa Watersports Buoyancy Aid Revenue (billion), by Application 2025 & 2033
- Figure 21: Middle East & Africa Watersports Buoyancy Aid Revenue Share (%), by Application 2025 & 2033
- Figure 22: Middle East & Africa Watersports Buoyancy Aid Revenue (billion), by Types 2025 & 2033
- Figure 23: Middle East & Africa Watersports Buoyancy Aid Revenue Share (%), by Types 2025 & 2033
- Figure 24: Middle East & Africa Watersports Buoyancy Aid Revenue (billion), by Country 2025 & 2033
- Figure 25: Middle East & Africa Watersports Buoyancy Aid Revenue Share (%), by Country 2025 & 2033
- Figure 26: Asia Pacific Watersports Buoyancy Aid Revenue (billion), by Application 2025 & 2033
- Figure 27: Asia Pacific Watersports Buoyancy Aid Revenue Share (%), by Application 2025 & 2033
- Figure 28: Asia Pacific Watersports Buoyancy Aid Revenue (billion), by Types 2025 & 2033
- Figure 29: Asia Pacific Watersports Buoyancy Aid Revenue Share (%), by Types 2025 & 2033
- Figure 30: Asia Pacific Watersports Buoyancy Aid Revenue (billion), by Country 2025 & 2033
- Figure 31: Asia Pacific Watersports Buoyancy Aid Revenue Share (%), by Country 2025 & 2033
List of Tables
- Table 1: Global Watersports Buoyancy Aid Revenue billion Forecast, by Application 2020 & 2033
- Table 2: Global Watersports Buoyancy Aid Revenue billion Forecast, by Types 2020 & 2033
- Table 3: Global Watersports Buoyancy Aid Revenue billion Forecast, by Region 2020 & 2033
- Table 4: Global Watersports Buoyancy Aid Revenue billion Forecast, by Application 2020 & 2033
- Table 5: Global Watersports Buoyancy Aid Revenue billion Forecast, by Types 2020 & 2033
- Table 6: Global Watersports Buoyancy Aid Revenue billion Forecast, by Country 2020 & 2033
- Table 7: United States Watersports Buoyancy Aid Revenue (billion) Forecast, by Application 2020 & 2033
- Table 8: Canada Watersports Buoyancy Aid Revenue (billion) Forecast, by Application 2020 & 2033
- Table 9: Mexico Watersports Buoyancy Aid Revenue (billion) Forecast, by Application 2020 & 2033
- Table 10: Global Watersports Buoyancy Aid Revenue billion Forecast, by Application 2020 & 2033
- Table 11: Global Watersports Buoyancy Aid Revenue billion Forecast, by Types 2020 & 2033
- Table 12: Global Watersports Buoyancy Aid Revenue billion Forecast, by Country 2020 & 2033
- Table 13: Brazil Watersports Buoyancy Aid Revenue (billion) Forecast, by Application 2020 & 2033
- Table 14: Argentina Watersports Buoyancy Aid Revenue (billion) Forecast, by Application 2020 & 2033
- Table 15: Rest of South America Watersports Buoyancy Aid Revenue (billion) Forecast, by Application 2020 & 2033
- Table 16: Global Watersports Buoyancy Aid Revenue billion Forecast, by Application 2020 & 2033
- Table 17: Global Watersports Buoyancy Aid Revenue billion Forecast, by Types 2020 & 2033
- Table 18: Global Watersports Buoyancy Aid Revenue billion Forecast, by Country 2020 & 2033
- Table 19: United Kingdom Watersports Buoyancy Aid Revenue (billion) Forecast, by Application 2020 & 2033
- Table 20: Germany Watersports Buoyancy Aid Revenue (billion) Forecast, by Application 2020 & 2033
- Table 21: France Watersports Buoyancy Aid Revenue (billion) Forecast, by Application 2020 & 2033
- Table 22: Italy Watersports Buoyancy Aid Revenue (billion) Forecast, by Application 2020 & 2033
- Table 23: Spain Watersports Buoyancy Aid Revenue (billion) Forecast, by Application 2020 & 2033
- Table 24: Russia Watersports Buoyancy Aid Revenue (billion) Forecast, by Application 2020 & 2033
- Table 25: Benelux Watersports Buoyancy Aid Revenue (billion) Forecast, by Application 2020 & 2033
- Table 26: Nordics Watersports Buoyancy Aid Revenue (billion) Forecast, by Application 2020 & 2033
- Table 27: Rest of Europe Watersports Buoyancy Aid Revenue (billion) Forecast, by Application 2020 & 2033
- Table 28: Global Watersports Buoyancy Aid Revenue billion Forecast, by Application 2020 & 2033
- Table 29: Global Watersports Buoyancy Aid Revenue billion Forecast, by Types 2020 & 2033
- Table 30: Global Watersports Buoyancy Aid Revenue billion Forecast, by Country 2020 & 2033
- Table 31: Turkey Watersports Buoyancy Aid Revenue (billion) Forecast, by Application 2020 & 2033
- Table 32: Israel Watersports Buoyancy Aid Revenue (billion) Forecast, by Application 2020 & 2033
- Table 33: GCC Watersports Buoyancy Aid Revenue (billion) Forecast, by Application 2020 & 2033
- Table 34: North Africa Watersports Buoyancy Aid Revenue (billion) Forecast, by Application 2020 & 2033
- Table 35: South Africa Watersports Buoyancy Aid Revenue (billion) Forecast, by Application 2020 & 2033
- Table 36: Rest of Middle East & Africa Watersports Buoyancy Aid Revenue (billion) Forecast, by Application 2020 & 2033
- Table 37: Global Watersports Buoyancy Aid Revenue billion Forecast, by Application 2020 & 2033
- Table 38: Global Watersports Buoyancy Aid Revenue billion Forecast, by Types 2020 & 2033
- Table 39: Global Watersports Buoyancy Aid Revenue billion Forecast, by Country 2020 & 2033
- Table 40: China Watersports Buoyancy Aid Revenue (billion) Forecast, by Application 2020 & 2033
- Table 41: India Watersports Buoyancy Aid Revenue (billion) Forecast, by Application 2020 & 2033
- Table 42: Japan Watersports Buoyancy Aid Revenue (billion) Forecast, by Application 2020 & 2033
- Table 43: South Korea Watersports Buoyancy Aid Revenue (billion) Forecast, by Application 2020 & 2033
- Table 44: ASEAN Watersports Buoyancy Aid Revenue (billion) Forecast, by Application 2020 & 2033
- Table 45: Oceania Watersports Buoyancy Aid Revenue (billion) Forecast, by Application 2020 & 2033
- Table 46: Rest of Asia Pacific Watersports Buoyancy Aid Revenue (billion) Forecast, by Application 2020 & 2033
Frequently Asked Questions
1. What is the projected Compound Annual Growth Rate (CAGR) of the Watersports Buoyancy Aid?
The projected CAGR is approximately 7.08%.
2. Which companies are prominent players in the Watersports Buoyancy Aid?
Key companies in the market include Veleria San Giorgio, Aquadesign, Grabner GmbH, Spinera, KOLIBRI, Regatta, Forward WIP, Ordana, RTM kayaks, LALIZAS, Eval, O'Brien, GILL, Helly Hansen, Hyperlite Wakeboards, Stearns, Goode, Crewsaver.
3. What are the main segments of the Watersports Buoyancy Aid?
The market segments include Application, Types.
4. Can you provide details about the market size?
The market size is estimated to be USD 9.94 billion as of 2022.
5. What are some drivers contributing to market growth?
N/A
6. What are the notable trends driving market growth?
N/A
7. Are there any restraints impacting market growth?
N/A
8. Can you provide examples of recent developments in the market?
N/A
9. What pricing options are available for accessing the report?
Pricing options include single-user, multi-user, and enterprise licenses priced at USD 2900.00, USD 4350.00, and USD 5800.00 respectively.
10. Is the market size provided in terms of value or volume?
The market size is provided in terms of value, measured in billion.
11. Are there any specific market keywords associated with the report?
Yes, the market keyword associated with the report is "Watersports Buoyancy Aid," which aids in identifying and referencing the specific market segment covered.
12. How do I determine which pricing option suits my needs best?
The pricing options vary based on user requirements and access needs. Individual users may opt for single-user licenses, while businesses requiring broader access may choose multi-user or enterprise licenses for cost-effective access to the report.
13. Are there any additional resources or data provided in the Watersports Buoyancy Aid report?
While the report offers comprehensive insights, it's advisable to review the specific contents or supplementary materials provided to ascertain if additional resources or data are available.
14. How can I stay updated on further developments or reports in the Watersports Buoyancy Aid?
To stay informed about further developments, trends, and reports in the Watersports Buoyancy Aid, consider subscribing to industry newsletters, following relevant companies and organizations, or regularly checking reputable industry news sources and publications.
Methodology
Step 1 - Identification of Relevant Samples Size from Population Database


Step 2 - Approaches for Defining Global Market Size (Value, Volume* & Price*)

Note*: In applicable scenarios
Step 3 - Data Sources
Primary Research
- Web Analytics
- Survey Reports
- Research Institute
- Latest Research Reports
- Opinion Leaders
Secondary Research
- Annual Reports
- White Paper
- Latest Press Release
- Industry Association
- Paid Database
- Investor Presentations

Step 4 - Data Triangulation
Involves using different sources of information in order to increase the validity of a study
These sources are likely to be stakeholders in a program - participants, other researchers, program staff, other community members, and so on.
Then we put all data in single framework & apply various statistical tools to find out the dynamic on the market.
During the analysis stage, feedback from the stakeholder groups would be compared to determine areas of agreement as well as areas of divergence