

Key Insights
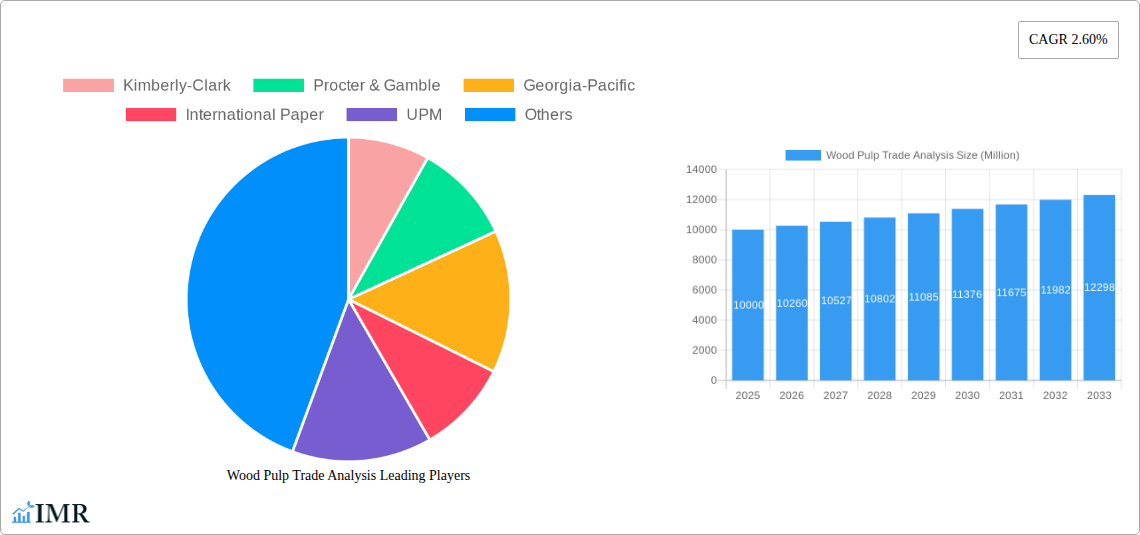
The global wood pulp market, valued at approximately 166.65 billion in 2025, is projected for steady expansion, exhibiting a compound annual growth rate (CAGR) of 2.7% from 2025 to 2033. This growth is propelled by escalating demand from pivotal sectors including packaging and paper manufacturing, directly correlated with rising global consumption and the expansion of e-commerce. The consistent demand for essential hygiene products like tissues and diapers also significantly bolsters market growth. Furthermore, sustained investments in sustainable forestry practices and advancements in pulp production technologies designed to enhance efficiency and minimize environmental impact are anticipated to drive further expansion. Nevertheless, market growth may face headwinds from volatile raw material pricing and increasingly stringent environmental regulations. The market is segmented by product type (chemical pulp, mechanical pulp, dissolving pulp) and end-use industry (packaging, paper manufacturing, textiles), with packaging leading market share due to its extensive application across diverse consumer goods. Key industry participants, including Kimberly-Clark, Procter & Gamble, Georgia-Pacific, International Paper, and UPM, are actively shaping market dynamics through strategic investments, product innovation, and acquisitions. Regional analysis indicates substantial growth potential in the Asia Pacific region, fueled by burgeoning economies and population expansion, while North America and Europe remain significant markets with more mature growth trajectories.
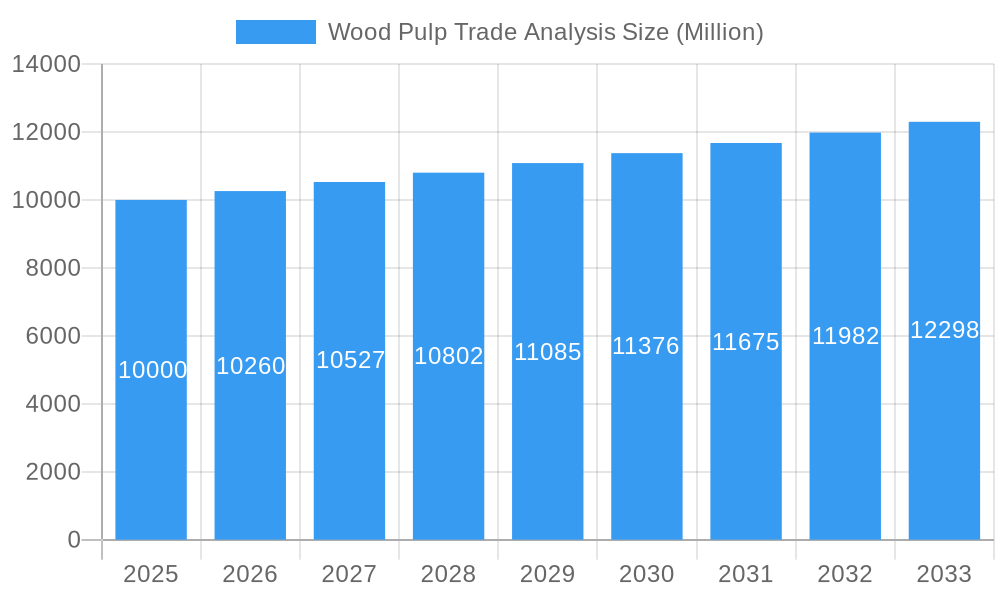
Wood Pulp Trade Analysis Market Size (In Billion)
The market's future evolution will be influenced by several key dynamics. The growing emphasis on sustainable and eco-friendly packaging solutions is set to increase demand for responsibly sourced wood pulp. Technological innovations yielding higher-quality pulp with enhanced properties for specialized applications will also contribute to market growth. Intensified competition among leading players is anticipated, potentially leading to mergers and acquisitions that will impact market share and pricing structures. Moreover, shifts in global economic conditions and evolving government policies pertaining to forestry and environmental regulations will critically shape the market landscape throughout the forecast period. A comprehensive understanding of these dynamic forces is imperative for stakeholders to formulate informed strategic decisions.
Wood Pulp Trade Analysis Company Market Share
Wood Pulp Trade Analysis: A Comprehensive Market Report (2019-2033)
This in-depth report provides a comprehensive analysis of the wood pulp trade market, encompassing market dynamics, growth trends, regional dominance, product landscape, key challenges, emerging opportunities, and key players. The study covers the historical period (2019-2024), base year (2025), and forecast period (2025-2033), offering valuable insights for industry professionals, investors, and strategic decision-makers. The report segments the market by product type (Chemical Pulp, Mechanical Pulp, Dissolving Pulp) and end-use industry (Packaging, Paper Manufacturing, Textiles), providing granular data for informed strategic planning. The total market size is projected to reach xx Million units by 2033.
Wood Pulp Trade Analysis Market Dynamics & Structure
This section analyzes the market's competitive landscape, technological advancements, regulatory environment, and market consolidation trends. We examine the market concentration, highlighting the market share held by key players like Kimberly-Clark, Procter & Gamble, Georgia-Pacific, International Paper, and UPM. The analysis also explores M&A activities within the sector, quantifying deal volumes during the study period and assessing their impact on market structure.
- Market Concentration: The global wood pulp market exhibits a moderately concentrated structure with the top 5 players holding approximately xx% of the market share in 2024.
- Technological Innovation: Advancements in pulping technologies (e.g., improved efficiency, reduced environmental impact) are driving market growth. However, high capital investment required for technology upgrades poses a barrier for smaller players.
- Regulatory Framework: Stringent environmental regulations regarding deforestation and effluent discharge are shaping industry practices and influencing investment decisions.
- Competitive Product Substitutes: The market faces competition from alternative materials, particularly in packaging, but wood pulp maintains a strong position due to its renewability and versatility.
- End-User Demographics: Growth in the packaging and hygiene sectors is a key driver of demand for wood pulp, especially in developing economies with rising populations and disposable incomes.
- M&A Trends: The number of M&A deals in the wood pulp sector averaged xx deals annually between 2019 and 2024, primarily driven by strategies to expand market share and access new technologies.
Wood Pulp Trade Analysis Growth Trends & Insights
This section provides a detailed analysis of the wood pulp market's growth trajectory, considering factors like market size evolution, adoption rates across different segments, technological disruptions, and evolving consumer preferences. The analysis leverages comprehensive data to project a Compound Annual Growth Rate (CAGR) of xx% for the forecast period (2025-2033). This growth is driven by factors such as increasing demand for packaging materials from e-commerce and FMCG sectors and the rising global population. The market penetration rate of wood pulp in various applications is also analyzed to provide a holistic understanding of market dynamics.
(Detailed 600-word analysis of market size evolution, adoption rates, technological disruptions, and consumer behavior shifts will be provided in the full report, including specific CAGR and penetration rate figures).
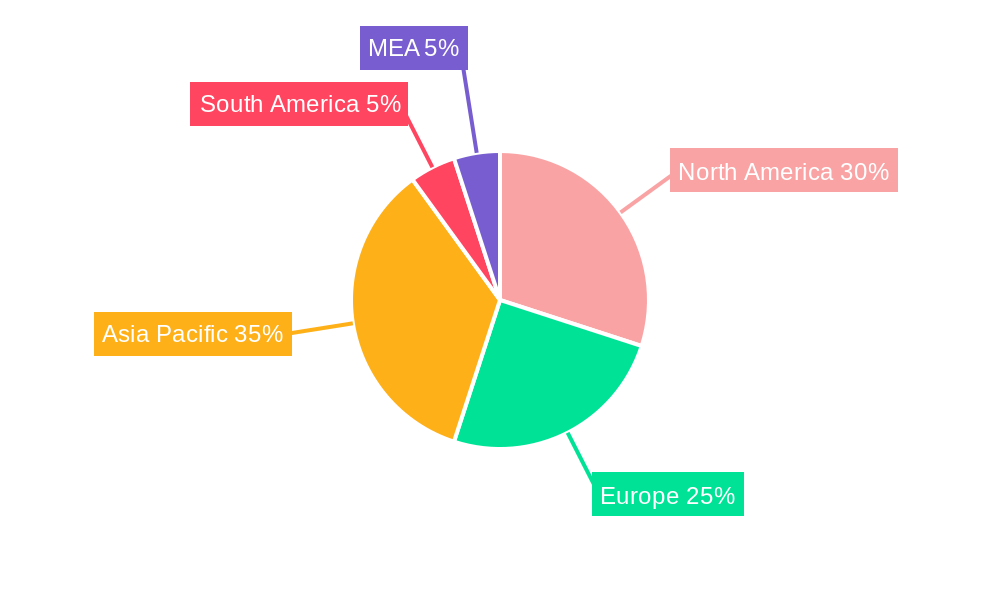
Dominant Regions, Countries, or Segments in Wood Pulp Trade Analysis
This section identifies the leading regions, countries, and segments within the wood pulp market driving overall growth. We analyze market share and growth potential for each segment (Chemical Pulp, Mechanical Pulp, Dissolving Pulp) and end-use industry (Packaging, Paper Manufacturing, Textiles). The report pinpoints key geographical markets exhibiting significant growth and explores the underlying factors.
- Dominant Region: Asia-Pacific is projected to be the leading region, driven by rapid economic growth and rising demand from packaging and paper manufacturing sectors.
- Key Country Drivers: China and India are expected to be the leading countries driving market growth in Asia-Pacific, primarily due to the expansion of their manufacturing and packaging sectors.
- Dominant Segment: Packaging is predicted to remain the largest end-use segment, driven by the burgeoning e-commerce industry and rising demand for consumer goods.
(Detailed 600-word analysis of dominant regions, countries, and segments, including detailed breakdowns of market share and growth potential, along with key drivers such as economic policies and infrastructure developments, will be provided in the full report).
Wood Pulp Trade Analysis Product Landscape
The wood pulp market offers a range of products, each catering to specific end-use applications. Recent innovations focus on enhancing pulp properties like strength, brightness, and absorbency, to meet evolving industry needs. Technological advancements, such as improved pulping processes and the development of sustainable pulp sources, are further enhancing product quality and efficiency. Unique selling propositions (USPs) for different products are also analyzed, providing a comparative landscape.
(100-150 word detailed description of product innovations, applications, and performance metrics will be included in the full report).
Key Drivers, Barriers & Challenges in Wood Pulp Trade Analysis
Key Drivers:
- Growing Packaging Demand: The expansion of the e-commerce sector and the rising demand for packaged goods are major drivers.
- Technological Advancements: Innovations in pulping and processing enhance efficiency and product quality.
- Favorable Government Policies: Policies promoting sustainable forestry and renewable resources boost market growth.
(Detailed 150-word analysis of key drivers and examples will be included in the full report).
Key Challenges & Restraints:
- Fluctuating Raw Material Prices: Wood prices and energy costs directly impact production costs.
- Environmental Concerns: Stringent environmental regulations increase operational costs and complexity.
- Competition from Substitutes: The market faces competition from alternative packaging materials (e.g., plastics).
(Detailed 150-word analysis of challenges and restraints with quantifiable impacts will be included in the full report).
Emerging Opportunities in Wood Pulp Trade Analysis
- Bio-based Materials: Developing wood pulp-based bioplastics and other sustainable materials opens new market avenues.
- Specialized Pulp Grades: Meeting the increasing demand for high-performance pulp in niche applications.
- Expansion in Developing Markets: Untapped potential exists in regions with growing consumer demand.
(Detailed 150-word analysis of emerging opportunities will be included in the full report).
Growth Accelerators in the Wood Pulp Trade Analysis Industry
The long-term growth of the wood pulp market is fueled by several factors, including technological innovations leading to more efficient and sustainable pulping processes. Strategic partnerships between pulp producers and downstream manufacturers facilitate product development and market expansion. Moreover, investments in research and development contribute to the creation of new applications and improved product properties, thus accelerating growth in the industry.
(Detailed 150-word analysis of growth accelerators will be included in the full report).
Key Players Shaping the Wood Pulp Trade Analysis Market
Notable Milestones in Wood Pulp Trade Analysis Sector
- December 2022: IIT Roorkee and Shah Paper Mills launched a project to develop advanced packaging research and skill development programs, boosting innovation in the Indian paper industry.
- April 2022: ICRA reported a paradigm shift in India's paper industry, with declining demand for newsprint and printing papers, and increased demand for packaging papers driven by e-commerce growth.
In-Depth Wood Pulp Trade Analysis Market Outlook
The wood pulp market is poised for continued growth, driven by strong demand from packaging, hygiene, and other end-use sectors. Strategic investments in sustainable practices, technological advancements, and market expansion will shape future market dynamics. The long-term outlook remains positive, offering significant opportunities for established players and new entrants alike. Further detailed analysis on this will be provided in the full report.
Wood Pulp Trade Analysis Segmentation
- 1. Production Analysis
- 2. Consumption Analysis
- 3. Import Market Analysis (Value & Volume)
- 4. Export Market Analysis (Value & Volume)
- 5. Price Trend Analysis
Wood Pulp Trade Analysis Segmentation By Geography
-
1. North America
- 1.1. United States
- 1.2. Canada
- 1.3. Mexico
-
2. Europe
- 2.1. Germany
- 2.2. United Kingdom
- 2.3. Italy
- 2.4. France
- 2.5. Netherlands
- 2.6. Sweden
- 2.7. Russia
-
3. Asia Pacific
- 3.1. China
- 3.2. Australia
- 3.3. India
- 3.4. South Korea
- 3.5. Japan
- 3.6. Indonesia
-
4. South America
- 4.1. Brazil
- 4.2. Chile
-
5. Africa
- 5.1. South Africa
Wood Pulp Trade Analysis Regional Market Share
Geographic Coverage of Wood Pulp Trade Analysis
Wood Pulp Trade Analysis REPORT HIGHLIGHTS
| Aspects | Details |
|---|---|
| Study Period | 2020-2034 |
| Base Year | 2025 |
| Estimated Year | 2026 |
| Forecast Period | 2026-2034 |
| Historical Period | 2020-2025 |
| Growth Rate | CAGR of 2.7% from 2020-2034 |
| Segmentation |
|
Table of Contents
- 1. Introduction
- 1.1. Research Scope
- 1.2. Market Segmentation
- 1.3. Research Objective
- 1.4. Definitions and Assumptions
- 2. Executive Summary
- 2.1. Market Snapshot
- 3. Market Dynamics
- 3.1. Market Drivers
- 3.2. Market Restrains
- 3.3. Market Trends
- 3.4. Market Opportunities
- 4. Market Factor Analysis
- 4.1. Porters Five Forces
- 4.1.1. Bargaining Power of Suppliers
- 4.1.2. Bargaining Power of Buyers
- 4.1.3. Threat of New Entrants
- 4.1.4. Threat of Substitutes
- 4.1.5. Competitive Rivalry
- 4.2. PESTEL analysis
- 4.3. BCG Analysis
- 4.3.1. Stars (High Growth, High Market Share)
- 4.3.2. Cash Cows (Low Growth, High Market Share)
- 4.3.3. Question Mark (High Growth, Low Market Share)
- 4.3.4. Dogs (Low Growth, Low Market Share)
- 4.4. Ansoff Matrix Analysis
- 4.5. Supply Chain Analysis
- 4.6. Regulatory Landscape
- 4.7. Current Market Potential and Opportunity Assessment (TAM–SAM–SOM Framework)
- 4.8. IMR Analyst Note
- 4.1. Porters Five Forces
- 5. Market Analysis, Insights and Forecast 2021-2033
- 5.1. Market Analysis, Insights and Forecast - by Production Analysis
- 5.2. Market Analysis, Insights and Forecast - by Consumption Analysis
- 5.3. Market Analysis, Insights and Forecast - by Import Market Analysis (Value & Volume)
- 5.4. Market Analysis, Insights and Forecast - by Export Market Analysis (Value & Volume)
- 5.5. Market Analysis, Insights and Forecast - by Price Trend Analysis
- 5.6. Market Analysis, Insights and Forecast - by Region
- 5.6.1. North America
- 5.6.2. Europe
- 5.6.3. Asia Pacific
- 5.6.4. South America
- 5.6.5. Africa
- 6. Global Wood Pulp Trade Analysis Analysis, Insights and Forecast, 2021-2033
- 6.1. Market Analysis, Insights and Forecast - by Production Analysis
- 6.2. Market Analysis, Insights and Forecast - by Consumption Analysis
- 6.3. Market Analysis, Insights and Forecast - by Import Market Analysis (Value & Volume)
- 6.4. Market Analysis, Insights and Forecast - by Export Market Analysis (Value & Volume)
- 6.5. Market Analysis, Insights and Forecast - by Price Trend Analysis
- 7. North America Wood Pulp Trade Analysis Analysis, Insights and Forecast, 2020-2032
- 7.1. Market Analysis, Insights and Forecast - by Production Analysis
- 7.2. Market Analysis, Insights and Forecast - by Consumption Analysis
- 7.3. Market Analysis, Insights and Forecast - by Import Market Analysis (Value & Volume)
- 7.4. Market Analysis, Insights and Forecast - by Export Market Analysis (Value & Volume)
- 7.5. Market Analysis, Insights and Forecast - by Price Trend Analysis
- 8. Europe Wood Pulp Trade Analysis Analysis, Insights and Forecast, 2020-2032
- 8.1. Market Analysis, Insights and Forecast - by Production Analysis
- 8.2. Market Analysis, Insights and Forecast - by Consumption Analysis
- 8.3. Market Analysis, Insights and Forecast - by Import Market Analysis (Value & Volume)
- 8.4. Market Analysis, Insights and Forecast - by Export Market Analysis (Value & Volume)
- 8.5. Market Analysis, Insights and Forecast - by Price Trend Analysis
- 9. Asia Pacific Wood Pulp Trade Analysis Analysis, Insights and Forecast, 2020-2032
- 9.1. Market Analysis, Insights and Forecast - by Production Analysis
- 9.2. Market Analysis, Insights and Forecast - by Consumption Analysis
- 9.3. Market Analysis, Insights and Forecast - by Import Market Analysis (Value & Volume)
- 9.4. Market Analysis, Insights and Forecast - by Export Market Analysis (Value & Volume)
- 9.5. Market Analysis, Insights and Forecast - by Price Trend Analysis
- 10. South America Wood Pulp Trade Analysis Analysis, Insights and Forecast, 2020-2032
- 10.1. Market Analysis, Insights and Forecast - by Production Analysis
- 10.2. Market Analysis, Insights and Forecast - by Consumption Analysis
- 10.3. Market Analysis, Insights and Forecast - by Import Market Analysis (Value & Volume)
- 10.4. Market Analysis, Insights and Forecast - by Export Market Analysis (Value & Volume)
- 10.5. Market Analysis, Insights and Forecast - by Price Trend Analysis
- 11. Africa Wood Pulp Trade Analysis Analysis, Insights and Forecast, 2020-2032
- 11.1. Market Analysis, Insights and Forecast - by Production Analysis
- 11.2. Market Analysis, Insights and Forecast - by Consumption Analysis
- 11.3. Market Analysis, Insights and Forecast - by Import Market Analysis (Value & Volume)
- 11.4. Market Analysis, Insights and Forecast - by Export Market Analysis (Value & Volume)
- 11.5. Market Analysis, Insights and Forecast - by Price Trend Analysis
- 12. Competitive Analysis
- 12.1. Company Profiles
- 12.1.1 Kimberly-Clark
- 12.1.1.1. Company Overview
- 12.1.1.2. Products
- 12.1.1.3. Company Financials
- 12.1.1.4. SWOT Analysis
- 12.1.2 Procter & Gamble
- 12.1.2.1. Company Overview
- 12.1.2.2. Products
- 12.1.2.3. Company Financials
- 12.1.2.4. SWOT Analysis
- 12.1.3 Georgia-Pacific
- 12.1.3.1. Company Overview
- 12.1.3.2. Products
- 12.1.3.3. Company Financials
- 12.1.3.4. SWOT Analysis
- 12.1.4 International Paper
- 12.1.4.1. Company Overview
- 12.1.4.2. Products
- 12.1.4.3. Company Financials
- 12.1.4.4. SWOT Analysis
- 12.1.5 UPM
- 12.1.5.1. Company Overview
- 12.1.5.2. Products
- 12.1.5.3. Company Financials
- 12.1.5.4. SWOT Analysis
- 12.1.1 Kimberly-Clark
- 12.2. Market Entropy
- 12.2.1 Company's Key Areas Served
- 12.2.2 Recent Developments
- 12.3. Company Market Share Analysis 2025
- 12.3.1 Top 5 Companies Market Share Analysis
- 12.3.2 Top 3 Companies Market Share Analysis
- 12.4. List of Potential Customers
- 13. Research Methodology
List of Figures
- Figure 1: Global Wood Pulp Trade Analysis Revenue Breakdown (billion, %) by Region 2025 & 2033
- Figure 2: North America Wood Pulp Trade Analysis Revenue (billion), by Production Analysis 2025 & 2033
- Figure 3: North America Wood Pulp Trade Analysis Revenue Share (%), by Production Analysis 2025 & 2033
- Figure 4: North America Wood Pulp Trade Analysis Revenue (billion), by Consumption Analysis 2025 & 2033
- Figure 5: North America Wood Pulp Trade Analysis Revenue Share (%), by Consumption Analysis 2025 & 2033
- Figure 6: North America Wood Pulp Trade Analysis Revenue (billion), by Import Market Analysis (Value & Volume) 2025 & 2033
- Figure 7: North America Wood Pulp Trade Analysis Revenue Share (%), by Import Market Analysis (Value & Volume) 2025 & 2033
- Figure 8: North America Wood Pulp Trade Analysis Revenue (billion), by Export Market Analysis (Value & Volume) 2025 & 2033
- Figure 9: North America Wood Pulp Trade Analysis Revenue Share (%), by Export Market Analysis (Value & Volume) 2025 & 2033
- Figure 10: North America Wood Pulp Trade Analysis Revenue (billion), by Price Trend Analysis 2025 & 2033
- Figure 11: North America Wood Pulp Trade Analysis Revenue Share (%), by Price Trend Analysis 2025 & 2033
- Figure 12: North America Wood Pulp Trade Analysis Revenue (billion), by Country 2025 & 2033
- Figure 13: North America Wood Pulp Trade Analysis Revenue Share (%), by Country 2025 & 2033
- Figure 14: Europe Wood Pulp Trade Analysis Revenue (billion), by Production Analysis 2025 & 2033
- Figure 15: Europe Wood Pulp Trade Analysis Revenue Share (%), by Production Analysis 2025 & 2033
- Figure 16: Europe Wood Pulp Trade Analysis Revenue (billion), by Consumption Analysis 2025 & 2033
- Figure 17: Europe Wood Pulp Trade Analysis Revenue Share (%), by Consumption Analysis 2025 & 2033
- Figure 18: Europe Wood Pulp Trade Analysis Revenue (billion), by Import Market Analysis (Value & Volume) 2025 & 2033
- Figure 19: Europe Wood Pulp Trade Analysis Revenue Share (%), by Import Market Analysis (Value & Volume) 2025 & 2033
- Figure 20: Europe Wood Pulp Trade Analysis Revenue (billion), by Export Market Analysis (Value & Volume) 2025 & 2033
- Figure 21: Europe Wood Pulp Trade Analysis Revenue Share (%), by Export Market Analysis (Value & Volume) 2025 & 2033
- Figure 22: Europe Wood Pulp Trade Analysis Revenue (billion), by Price Trend Analysis 2025 & 2033
- Figure 23: Europe Wood Pulp Trade Analysis Revenue Share (%), by Price Trend Analysis 2025 & 2033
- Figure 24: Europe Wood Pulp Trade Analysis Revenue (billion), by Country 2025 & 2033
- Figure 25: Europe Wood Pulp Trade Analysis Revenue Share (%), by Country 2025 & 2033
- Figure 26: Asia Pacific Wood Pulp Trade Analysis Revenue (billion), by Production Analysis 2025 & 2033
- Figure 27: Asia Pacific Wood Pulp Trade Analysis Revenue Share (%), by Production Analysis 2025 & 2033
- Figure 28: Asia Pacific Wood Pulp Trade Analysis Revenue (billion), by Consumption Analysis 2025 & 2033
- Figure 29: Asia Pacific Wood Pulp Trade Analysis Revenue Share (%), by Consumption Analysis 2025 & 2033
- Figure 30: Asia Pacific Wood Pulp Trade Analysis Revenue (billion), by Import Market Analysis (Value & Volume) 2025 & 2033
- Figure 31: Asia Pacific Wood Pulp Trade Analysis Revenue Share (%), by Import Market Analysis (Value & Volume) 2025 & 2033
- Figure 32: Asia Pacific Wood Pulp Trade Analysis Revenue (billion), by Export Market Analysis (Value & Volume) 2025 & 2033
- Figure 33: Asia Pacific Wood Pulp Trade Analysis Revenue Share (%), by Export Market Analysis (Value & Volume) 2025 & 2033
- Figure 34: Asia Pacific Wood Pulp Trade Analysis Revenue (billion), by Price Trend Analysis 2025 & 2033
- Figure 35: Asia Pacific Wood Pulp Trade Analysis Revenue Share (%), by Price Trend Analysis 2025 & 2033
- Figure 36: Asia Pacific Wood Pulp Trade Analysis Revenue (billion), by Country 2025 & 2033
- Figure 37: Asia Pacific Wood Pulp Trade Analysis Revenue Share (%), by Country 2025 & 2033
- Figure 38: South America Wood Pulp Trade Analysis Revenue (billion), by Production Analysis 2025 & 2033
- Figure 39: South America Wood Pulp Trade Analysis Revenue Share (%), by Production Analysis 2025 & 2033
- Figure 40: South America Wood Pulp Trade Analysis Revenue (billion), by Consumption Analysis 2025 & 2033
- Figure 41: South America Wood Pulp Trade Analysis Revenue Share (%), by Consumption Analysis 2025 & 2033
- Figure 42: South America Wood Pulp Trade Analysis Revenue (billion), by Import Market Analysis (Value & Volume) 2025 & 2033
- Figure 43: South America Wood Pulp Trade Analysis Revenue Share (%), by Import Market Analysis (Value & Volume) 2025 & 2033
- Figure 44: South America Wood Pulp Trade Analysis Revenue (billion), by Export Market Analysis (Value & Volume) 2025 & 2033
- Figure 45: South America Wood Pulp Trade Analysis Revenue Share (%), by Export Market Analysis (Value & Volume) 2025 & 2033
- Figure 46: South America Wood Pulp Trade Analysis Revenue (billion), by Price Trend Analysis 2025 & 2033
- Figure 47: South America Wood Pulp Trade Analysis Revenue Share (%), by Price Trend Analysis 2025 & 2033
- Figure 48: South America Wood Pulp Trade Analysis Revenue (billion), by Country 2025 & 2033
- Figure 49: South America Wood Pulp Trade Analysis Revenue Share (%), by Country 2025 & 2033
- Figure 50: Africa Wood Pulp Trade Analysis Revenue (billion), by Production Analysis 2025 & 2033
- Figure 51: Africa Wood Pulp Trade Analysis Revenue Share (%), by Production Analysis 2025 & 2033
- Figure 52: Africa Wood Pulp Trade Analysis Revenue (billion), by Consumption Analysis 2025 & 2033
- Figure 53: Africa Wood Pulp Trade Analysis Revenue Share (%), by Consumption Analysis 2025 & 2033
- Figure 54: Africa Wood Pulp Trade Analysis Revenue (billion), by Import Market Analysis (Value & Volume) 2025 & 2033
- Figure 55: Africa Wood Pulp Trade Analysis Revenue Share (%), by Import Market Analysis (Value & Volume) 2025 & 2033
- Figure 56: Africa Wood Pulp Trade Analysis Revenue (billion), by Export Market Analysis (Value & Volume) 2025 & 2033
- Figure 57: Africa Wood Pulp Trade Analysis Revenue Share (%), by Export Market Analysis (Value & Volume) 2025 & 2033
- Figure 58: Africa Wood Pulp Trade Analysis Revenue (billion), by Price Trend Analysis 2025 & 2033
- Figure 59: Africa Wood Pulp Trade Analysis Revenue Share (%), by Price Trend Analysis 2025 & 2033
- Figure 60: Africa Wood Pulp Trade Analysis Revenue (billion), by Country 2025 & 2033
- Figure 61: Africa Wood Pulp Trade Analysis Revenue Share (%), by Country 2025 & 2033
List of Tables
- Table 1: Global Wood Pulp Trade Analysis Revenue billion Forecast, by Production Analysis 2020 & 2033
- Table 2: Global Wood Pulp Trade Analysis Revenue billion Forecast, by Consumption Analysis 2020 & 2033
- Table 3: Global Wood Pulp Trade Analysis Revenue billion Forecast, by Import Market Analysis (Value & Volume) 2020 & 2033
- Table 4: Global Wood Pulp Trade Analysis Revenue billion Forecast, by Export Market Analysis (Value & Volume) 2020 & 2033
- Table 5: Global Wood Pulp Trade Analysis Revenue billion Forecast, by Price Trend Analysis 2020 & 2033
- Table 6: Global Wood Pulp Trade Analysis Revenue billion Forecast, by Region 2020 & 2033
- Table 7: Global Wood Pulp Trade Analysis Revenue billion Forecast, by Production Analysis 2020 & 2033
- Table 8: Global Wood Pulp Trade Analysis Revenue billion Forecast, by Consumption Analysis 2020 & 2033
- Table 9: Global Wood Pulp Trade Analysis Revenue billion Forecast, by Import Market Analysis (Value & Volume) 2020 & 2033
- Table 10: Global Wood Pulp Trade Analysis Revenue billion Forecast, by Export Market Analysis (Value & Volume) 2020 & 2033
- Table 11: Global Wood Pulp Trade Analysis Revenue billion Forecast, by Price Trend Analysis 2020 & 2033
- Table 12: Global Wood Pulp Trade Analysis Revenue billion Forecast, by Country 2020 & 2033
- Table 13: United States Wood Pulp Trade Analysis Revenue (billion) Forecast, by Application 2020 & 2033
- Table 14: Canada Wood Pulp Trade Analysis Revenue (billion) Forecast, by Application 2020 & 2033
- Table 15: Mexico Wood Pulp Trade Analysis Revenue (billion) Forecast, by Application 2020 & 2033
- Table 16: Global Wood Pulp Trade Analysis Revenue billion Forecast, by Production Analysis 2020 & 2033
- Table 17: Global Wood Pulp Trade Analysis Revenue billion Forecast, by Consumption Analysis 2020 & 2033
- Table 18: Global Wood Pulp Trade Analysis Revenue billion Forecast, by Import Market Analysis (Value & Volume) 2020 & 2033
- Table 19: Global Wood Pulp Trade Analysis Revenue billion Forecast, by Export Market Analysis (Value & Volume) 2020 & 2033
- Table 20: Global Wood Pulp Trade Analysis Revenue billion Forecast, by Price Trend Analysis 2020 & 2033
- Table 21: Global Wood Pulp Trade Analysis Revenue billion Forecast, by Country 2020 & 2033
- Table 22: Germany Wood Pulp Trade Analysis Revenue (billion) Forecast, by Application 2020 & 2033
- Table 23: United Kingdom Wood Pulp Trade Analysis Revenue (billion) Forecast, by Application 2020 & 2033
- Table 24: Italy Wood Pulp Trade Analysis Revenue (billion) Forecast, by Application 2020 & 2033
- Table 25: France Wood Pulp Trade Analysis Revenue (billion) Forecast, by Application 2020 & 2033
- Table 26: Netherlands Wood Pulp Trade Analysis Revenue (billion) Forecast, by Application 2020 & 2033
- Table 27: Sweden Wood Pulp Trade Analysis Revenue (billion) Forecast, by Application 2020 & 2033
- Table 28: Russia Wood Pulp Trade Analysis Revenue (billion) Forecast, by Application 2020 & 2033
- Table 29: Global Wood Pulp Trade Analysis Revenue billion Forecast, by Production Analysis 2020 & 2033
- Table 30: Global Wood Pulp Trade Analysis Revenue billion Forecast, by Consumption Analysis 2020 & 2033
- Table 31: Global Wood Pulp Trade Analysis Revenue billion Forecast, by Import Market Analysis (Value & Volume) 2020 & 2033
- Table 32: Global Wood Pulp Trade Analysis Revenue billion Forecast, by Export Market Analysis (Value & Volume) 2020 & 2033
- Table 33: Global Wood Pulp Trade Analysis Revenue billion Forecast, by Price Trend Analysis 2020 & 2033
- Table 34: Global Wood Pulp Trade Analysis Revenue billion Forecast, by Country 2020 & 2033
- Table 35: China Wood Pulp Trade Analysis Revenue (billion) Forecast, by Application 2020 & 2033
- Table 36: Australia Wood Pulp Trade Analysis Revenue (billion) Forecast, by Application 2020 & 2033
- Table 37: India Wood Pulp Trade Analysis Revenue (billion) Forecast, by Application 2020 & 2033
- Table 38: South Korea Wood Pulp Trade Analysis Revenue (billion) Forecast, by Application 2020 & 2033
- Table 39: Japan Wood Pulp Trade Analysis Revenue (billion) Forecast, by Application 2020 & 2033
- Table 40: Indonesia Wood Pulp Trade Analysis Revenue (billion) Forecast, by Application 2020 & 2033
- Table 41: Global Wood Pulp Trade Analysis Revenue billion Forecast, by Production Analysis 2020 & 2033
- Table 42: Global Wood Pulp Trade Analysis Revenue billion Forecast, by Consumption Analysis 2020 & 2033
- Table 43: Global Wood Pulp Trade Analysis Revenue billion Forecast, by Import Market Analysis (Value & Volume) 2020 & 2033
- Table 44: Global Wood Pulp Trade Analysis Revenue billion Forecast, by Export Market Analysis (Value & Volume) 2020 & 2033
- Table 45: Global Wood Pulp Trade Analysis Revenue billion Forecast, by Price Trend Analysis 2020 & 2033
- Table 46: Global Wood Pulp Trade Analysis Revenue billion Forecast, by Country 2020 & 2033
- Table 47: Brazil Wood Pulp Trade Analysis Revenue (billion) Forecast, by Application 2020 & 2033
- Table 48: Chile Wood Pulp Trade Analysis Revenue (billion) Forecast, by Application 2020 & 2033
- Table 49: Global Wood Pulp Trade Analysis Revenue billion Forecast, by Production Analysis 2020 & 2033
- Table 50: Global Wood Pulp Trade Analysis Revenue billion Forecast, by Consumption Analysis 2020 & 2033
- Table 51: Global Wood Pulp Trade Analysis Revenue billion Forecast, by Import Market Analysis (Value & Volume) 2020 & 2033
- Table 52: Global Wood Pulp Trade Analysis Revenue billion Forecast, by Export Market Analysis (Value & Volume) 2020 & 2033
- Table 53: Global Wood Pulp Trade Analysis Revenue billion Forecast, by Price Trend Analysis 2020 & 2033
- Table 54: Global Wood Pulp Trade Analysis Revenue billion Forecast, by Country 2020 & 2033
- Table 55: South Africa Wood Pulp Trade Analysis Revenue (billion) Forecast, by Application 2020 & 2033
Frequently Asked Questions
1. What is the projected Compound Annual Growth Rate (CAGR) of the Wood Pulp Trade Analysis?
The projected CAGR is approximately 2.7%.
2. Which companies are prominent players in the Wood Pulp Trade Analysis?
Key companies in the market include Kimberly-Clark , Procter & Gamble , Georgia-Pacific, International Paper , UPM .
3. What are the main segments of the Wood Pulp Trade Analysis?
The market segments include Production Analysis, Consumption Analysis, Import Market Analysis (Value & Volume), Export Market Analysis (Value & Volume), Price Trend Analysis.
4. Can you provide details about the market size?
The market size is estimated to be USD 166.65 billion as of 2022.
5. What are some drivers contributing to market growth?
; Increasing Food Security Concerns; Inclination Toward a Healthy Lifestyle.
6. What are the notable trends driving market growth?
Huge Demand in Packaging and Industrial Papers.
7. Are there any restraints impacting market growth?
; Unfavorable Climatic Conditions; Higher Market Entry Cost.
8. Can you provide examples of recent developments in the market?
December 2022: The Indian Institute of Technology (IIT) Roorkee, in association with Shah Paper Mills Limited, launched a new project to develop the advanced packaging research laboratory and skill development program at the Department of Paper Technology, Saharanpur Campus. The institute has been fostering collaboration with paper industries from India, focusing on providing cutting-edge innovation research and skill development globally.
9. What pricing options are available for accessing the report?
Pricing options include single-user, multi-user, and enterprise licenses priced at USD 4750, USD 5250, and USD 8750 respectively.
10. Is the market size provided in terms of value or volume?
The market size is provided in terms of value, measured in billion.
11. Are there any specific market keywords associated with the report?
Yes, the market keyword associated with the report is "Wood Pulp Trade Analysis," which aids in identifying and referencing the specific market segment covered.
12. How do I determine which pricing option suits my needs best?
The pricing options vary based on user requirements and access needs. Individual users may opt for single-user licenses, while businesses requiring broader access may choose multi-user or enterprise licenses for cost-effective access to the report.
13. Are there any additional resources or data provided in the Wood Pulp Trade Analysis report?
While the report offers comprehensive insights, it's advisable to review the specific contents or supplementary materials provided to ascertain if additional resources or data are available.
14. How can I stay updated on further developments or reports in the Wood Pulp Trade Analysis?
To stay informed about further developments, trends, and reports in the Wood Pulp Trade Analysis, consider subscribing to industry newsletters, following relevant companies and organizations, or regularly checking reputable industry news sources and publications.
Methodology
Step 1 - Identification of Relevant Samples Size from Population Database


Step 2 - Approaches for Defining Global Market Size (Value, Volume* & Price*)

Note*: In applicable scenarios
Step 3 - Data Sources
Primary Research
- Web Analytics
- Survey Reports
- Research Institute
- Latest Research Reports
- Opinion Leaders
Secondary Research
- Annual Reports
- White Paper
- Latest Press Release
- Industry Association
- Paid Database
- Investor Presentations

Step 4 - Data Triangulation
Involves using different sources of information in order to increase the validity of a study
These sources are likely to be stakeholders in a program - participants, other researchers, program staff, other community members, and so on.
Then we put all data in single framework & apply various statistical tools to find out the dynamic on the market.
During the analysis stage, feedback from the stakeholder groups would be compared to determine areas of agreement as well as areas of divergence