

Key Insights
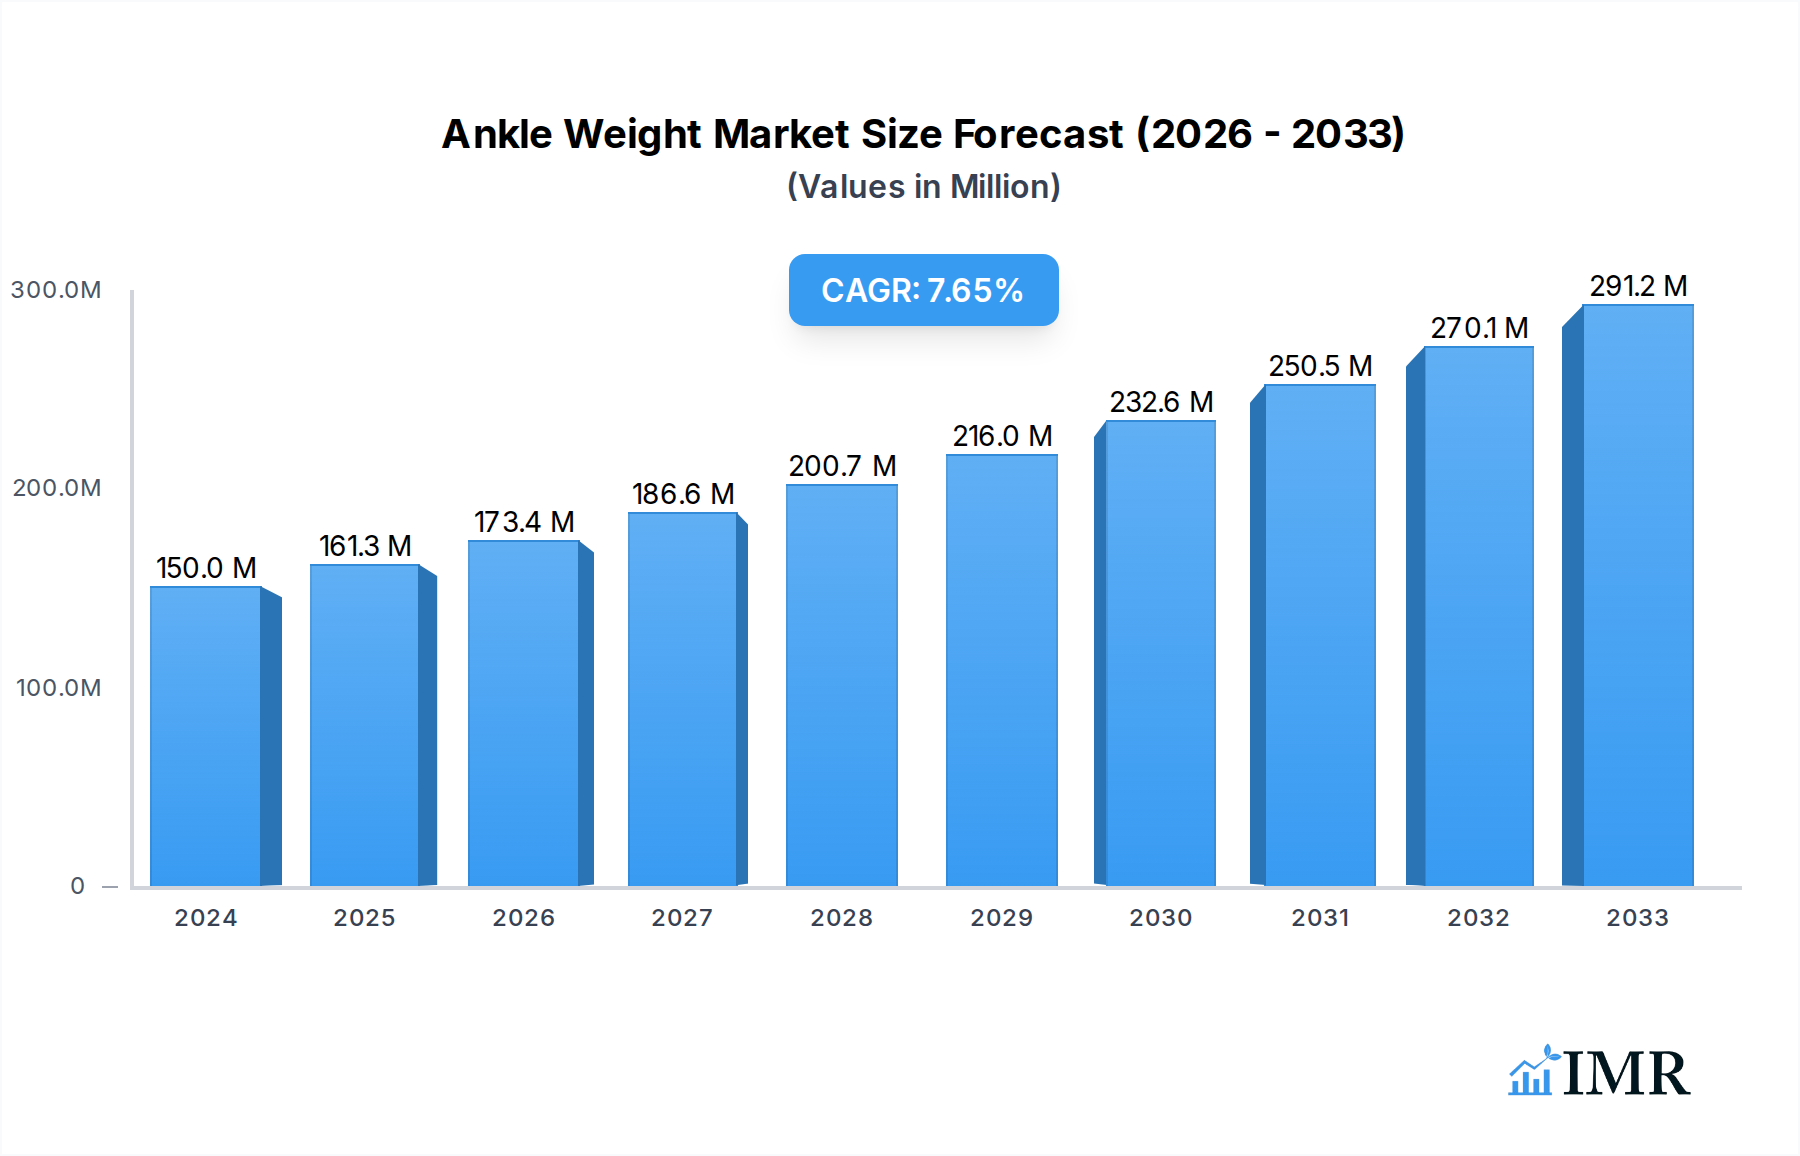
The global Ankle Weight market is projected to experience robust growth, driven by increasing consumer focus on fitness and specialized training. The market was valued at approximately USD 150 million in 2024, and is anticipated to expand at a Compound Annual Growth Rate (CAGR) of 7.5% from 2025 to 2033. This upward trajectory is fueled by a rising participation in various sports and fitness activities, where ankle weights are integral for enhancing lower body strength, endurance, and rehabilitation. The growing awareness surrounding the benefits of incorporating resistance training into daily routines, particularly among adults seeking to improve athletic performance or recover from injuries, is a significant catalyst. Furthermore, the development of innovative, comfortable, and adjustable ankle weight designs catering to diverse fitness levels and applications, including therapeutic use for children and adults, is contributing to market expansion. Emerging trends such as the integration of smart technology for performance tracking and the rise of home-based fitness solutions are also expected to positively influence market dynamics.

Ankle Weight Market Size (In Million)
The market segmentation reveals a diverse landscape, with significant potential across different weight categories, from lighter options suitable for rehabilitation and children's exercises to heavier weights for advanced athletes. The application segment is predominantly driven by adult users, though the children's segment is seeing a steady rise due to specialized physical therapy and sports training programs. Geographically, North America and Europe currently dominate the market, owing to established fitness cultures and higher disposable incomes. However, the Asia Pacific region, particularly China and India, presents substantial growth opportunities due to a rapidly expanding middle class, increasing health consciousness, and a growing number of fitness facilities. While the market demonstrates strong growth potential, factors such as the availability of alternative resistance training equipment and potential over-reliance on ankle weights without proper guidance could pose minor challenges.
Ankle Weight Company Market Share
This comprehensive Ankle Weight market report offers an in-depth analysis of the global market, covering historical performance, current trends, and future projections from 2019 to 2033. With a base year of 2025 and a forecast period extending to 2033, this report is designed to equip industry professionals, manufacturers, and stakeholders with critical insights into market dynamics, growth drivers, competitive strategies, and emerging opportunities. We delve into the parent market and child market segments, providing a granular understanding of market penetration and future potential.
Ankle Weight Market Dynamics & Structure
The global ankle weight market exhibits moderate concentration, with key players like Hausmann, All Pro, Sea Pearls, SPRI, TKO, and Adidas holding significant shares. Technological innovation is a crucial driver, with advancements focusing on improved ergonomics, adjustable weight systems, and enhanced durability. Regulatory frameworks are relatively stable, primarily revolving around product safety standards. Competitive product substitutes include hand weights, resistance bands, and other fitness accessories, which present a challenge by offering alternative training solutions. End-user demographics are diverse, encompassing athletes, fitness enthusiasts, and individuals undergoing rehabilitation, with a growing emphasis on the adult segment. Mergers and acquisitions (M&A) activity has been modest, signaling a mature market but also presenting opportunities for consolidation and strategic expansion for smaller entities. The market share of the top 5 companies is estimated to be around 45 million units. M&A deal volumes are predicted to be around 3 million units in the forecast period. Innovation barriers include the high cost of specialized materials and the need for extensive product testing to ensure safety and efficacy, estimated at 5 million units in R&D investment.
- Market Concentration: Moderate, with established brands dominating.
- Technological Innovation: Focus on comfort, adjustability, and durability.
- Regulatory Frameworks: Primarily product safety and compliance.
- Competitive Substitutes: Resistance bands, dumbbells, kettlebells.
- End-User Demographics: Athletes, fitness enthusiasts, rehabilitation patients, adults, children.
- M&A Trends: Modest activity, potential for consolidation.
- Top 5 Companies Market Share: Approximately 45 million units.
- M&A Deal Volume (Forecast): Around 3 million units.
- R&D Investment (Estimated): 5 million units.
Ankle Weight Growth Trends & Insights
The ankle weight market is poised for steady growth, driven by an escalating global emphasis on health and fitness. The market size is projected to expand from approximately 100 million units in 2019 to an estimated 250 million units by 2033, exhibiting a Compound Annual Growth Rate (CAGR) of roughly 8.5% during the forecast period. Adoption rates are particularly high among the adult demographic, who are increasingly incorporating ankle weights into their strength training, cardio, and physical therapy routines. Technological disruptions, while not revolutionary, are steadily improving product design and user experience. Innovations such as breathable materials, secure fastening systems, and integrated weight adjustment mechanisms are enhancing comfort and versatility. Consumer behavior shifts are evident, with a growing demand for portable, multi-functional fitness equipment that can be used at home or on the go. The rise of online fitness platforms and influencer marketing further fuels this trend, showcasing the effectiveness and accessibility of ankle weights for various fitness goals. Market penetration is expected to reach 70% in developed economies by 2033. The projected market size in 2025 is 175 million units, with an estimated market size of 250 million units by 2033. The CAGR from 2025 to 2033 is predicted to be 8.5%.
- Market Size Evolution: Projected growth from 100 million units (2019) to 250 million units (2033).
- CAGR (2019-2033): Approximately 8.5%.
- Adoption Rates: High, particularly in the adult segment.
- Technological Disruptions: Enhancements in ergonomics, materials, and adjustability.
- Consumer Behavior Shifts: Increased demand for home fitness, portability, and multi-functionality.
- Market Penetration (Developed Economies by 2033): Expected to reach 70%.
- Market Size (2025): 175 million units.
- Market Size (2033): 250 million units.
- CAGR (2025-2033): 8.5%.
Dominant Regions, Countries, or Segments in Ankle Weight
The adult segment is the undisputed dominant force in the global ankle weight market, driven by a widespread adoption in fitness and rehabilitation practices. This dominance is further amplified by the demand for weights in the 6-9.9 Pounds and 10-11.9 Pounds categories, which offer a balanced resistance for a wide range of exercises. North America currently leads market growth, propelled by high disposable incomes, a strong fitness culture, and significant investment in health and wellness infrastructure. The United States, in particular, represents a substantial market share due to its large population and the prevalence of gyms and fitness studios. Economic policies encouraging healthy lifestyles and government initiatives promoting physical activity contribute to this regional dominance. Key drivers in this segment include the rising prevalence of sedentary lifestyles, leading to an increased need for targeted strength training, and the growing awareness of the benefits of ankle weights in physical therapy for injury recovery and prevention. The market share of the adult segment is approximately 75 million units in 2025, and the 6-9.9 Pounds category holds a market share of 40 million units. The 10-11.9 Pounds category is projected to reach 35 million units by 2033.
- Dominant Segment: Adult.
- Dominant Weight Categories: 6-9.9 Pounds and 10-11.9 Pounds.
- Leading Region: North America.
- Key Country: United States.
- Dominance Factors (North America): High disposable income, strong fitness culture, health & wellness investment.
- Growth Drivers (Adult Segment): Sedentary lifestyles, rehabilitation needs, injury prevention.
- Adult Segment Market Share (2025): Approximately 75 million units.
- 6-9.9 Pounds Category Market Share (2025): Approximately 40 million units.
- 10-11.9 Pounds Category Market Share (2033): Projected to reach 35 million units.
Ankle Weight Product Landscape
The ankle weight product landscape is characterized by continuous innovation aimed at enhancing user comfort, functionality, and safety. Manufacturers are focusing on advanced materials like neoprene and breathable fabrics for improved comfort during prolonged use. Adjustable weight systems, featuring modular plates or sand-filled compartments, are gaining prominence, allowing users to customize resistance levels for progressive training. Ergonomic designs with secure, non-slip fastenings ensure stability and prevent chafing. Applications span across various fitness disciplines, including running, yoga, Pilates, and physical therapy, where they aid in building lower body strength, improving balance, and accelerating recovery from injuries. Performance metrics are often evaluated based on weight accuracy, durability, and the effectiveness of the fastening mechanism, with companies like Adidas and SPRI leading in offering high-quality, performance-driven products.
Key Drivers, Barriers & Challenges in Ankle Weight
The ankle weight market is propelled by a confluence of factors including the escalating global focus on personal fitness and well-being, the increasing popularity of home-based workouts, and the recognized benefits of ankle weights in physical therapy and rehabilitation. Technological advancements that enhance comfort and adjustability, such as secure fastening systems and breathable materials, also act as significant drivers. The rising awareness of the role of targeted strength training in improving athletic performance and preventing injuries further fuels demand. Market value driven by these factors is estimated at 150 million units in 2025.
However, the market faces certain barriers and challenges. The availability of numerous competitive substitutes, including resistance bands and dumbbells, can limit market penetration. High-quality ankle weights can also be relatively expensive, posing a price barrier for some consumers. Supply chain disruptions, particularly those related to raw material sourcing and manufacturing, can impact production and availability. Intense competition among established and emerging players necessitates continuous innovation and competitive pricing strategies. Regulatory hurdles, though minimal, primarily revolve around product safety standards, which require adherence and certification. The impact of these challenges on market growth is estimated at 20 million units annually.
- Key Drivers:
- Growing health and fitness consciousness.
- Rise of home-based workouts.
- Therapeutic benefits in rehabilitation.
- Technological advancements in comfort and adjustability.
- Increased demand for targeted strength training.
- Market Value (2025): 150 million units.
- Barriers & Challenges:
- Availability of competitive substitutes.
- Price sensitivity for premium products.
- Supply chain vulnerabilities.
- Intense market competition.
- Adherence to product safety regulations.
- Impact of Challenges: 20 million units annually.
Emerging Opportunities in Ankle Weight
Emerging opportunities in the ankle weight market lie in the development of smart ankle weights integrated with sensor technology for real-time performance tracking and personalized training feedback. The growing elder care market presents a significant untapped segment for specialized, low-weight, easy-to-use ankle weights designed for balance improvement and fall prevention. Furthermore, collaborations with telehealth platforms and physical therapy providers can open new distribution channels and application areas, particularly for therapeutic use. The increasing demand for eco-friendly fitness products also presents an opportunity for manufacturers to develop ankle weights using sustainable materials. The market potential for these emerging opportunities is estimated at 30 million units by 2033.
Growth Accelerators in the Ankle Weight Industry
Growth accelerators in the ankle weight industry are primarily driven by ongoing technological breakthroughs that enhance user experience and product efficacy. The increasing adoption of wearable technology in fitness is paving the way for "smart" ankle weights that offer data-driven insights into workouts. Strategic partnerships between ankle weight manufacturers and fitness app developers are creating integrated ecosystems that foster user engagement and loyalty. Market expansion into emerging economies with a burgeoning middle class and a growing interest in health and fitness also presents a significant growth catalyst. The growing trend of personalized fitness solutions and the demand for specialized equipment for specific sports and activities will continue to fuel innovation and market penetration.
Key Players Shaping the Ankle Weight Market
- Hausmann
- All Pro
- Sea Pearls
- SPRI
- TKO
- Adidas
Notable Milestones in Ankle Weight Sector
- 2019: Introduction of breathable, moisture-wicking fabrics in premium ankle weights.
- 2020: Increased demand for home-fitness equipment, boosting ankle weight sales.
- 2021: Launch of adjustable ankle weights with interchangeable weight plates.
- 2022: Growing focus on ergonomic designs for enhanced comfort and reduced chafing.
- 2023: Emergence of smart ankle weight prototypes with basic sensor integration.
- 2024: Increased adoption in physical therapy for post-injury rehabilitation programs.
In-Depth Ankle Weight Market Outlook
The future outlook for the ankle weight market is exceptionally promising, driven by sustained growth in the global health and fitness sector. Future market potential is significantly bolstered by the integration of smart technology, offering personalized training data and enhanced user engagement, estimated to add 20 million units to the market. The expanding elder care demographic represents a substantial untapped market, with the development of specialized ankle weights for balance and mobility. Strategic alliances with fitness technology companies and healthcare providers will further unlock new avenues for product application and distribution. The increasing consumer preference for sustainable and eco-friendly products also presents a significant opportunity for manufacturers to innovate in material sourcing and production processes. The overall market is projected to witness robust expansion through 2033, driven by these key strategic opportunities.
Ankle Weight Segmentation
-
1. Application
- 1.1. Children
- 1.2. Adult
-
2. Types
- 2.1. Under 6 Pounds
- 2.2. 6-9.9 Pounds
- 2.3. 10-11.9 Pounds
- 2.4. Above 12 Pounds
Ankle Weight Segmentation By Geography
-
1. North America
- 1.1. United States
- 1.2. Canada
- 1.3. Mexico
-
2. South America
- 2.1. Brazil
- 2.2. Argentina
- 2.3. Rest of South America
-
3. Europe
- 3.1. United Kingdom
- 3.2. Germany
- 3.3. France
- 3.4. Italy
- 3.5. Spain
- 3.6. Russia
- 3.7. Benelux
- 3.8. Nordics
- 3.9. Rest of Europe
-
4. Middle East & Africa
- 4.1. Turkey
- 4.2. Israel
- 4.3. GCC
- 4.4. North Africa
- 4.5. South Africa
- 4.6. Rest of Middle East & Africa
-
5. Asia Pacific
- 5.1. China
- 5.2. India
- 5.3. Japan
- 5.4. South Korea
- 5.5. ASEAN
- 5.6. Oceania
- 5.7. Rest of Asia Pacific

Ankle Weight Regional Market Share
Geographic Coverage of Ankle Weight
Ankle Weight REPORT HIGHLIGHTS
| Aspects | Details |
|---|---|
| Study Period | 2020-2034 |
| Base Year | 2025 |
| Estimated Year | 2026 |
| Forecast Period | 2026-2034 |
| Historical Period | 2020-2025 |
| Growth Rate | CAGR of 7.5% from 2020-2034 |
| Segmentation |
|
Table of Contents
- 1. Introduction
- 1.1. Research Scope
- 1.2. Market Segmentation
- 1.3. Research Methodology
- 1.4. Definitions and Assumptions
- 2. Executive Summary
- 2.1. Introduction
- 3. Market Dynamics
- 3.1. Introduction
- 3.2. Market Drivers
- 3.3. Market Restrains
- 3.4. Market Trends
- 4. Market Factor Analysis
- 4.1. Porters Five Forces
- 4.2. Supply/Value Chain
- 4.3. PESTEL analysis
- 4.4. Market Entropy
- 4.5. Patent/Trademark Analysis
- 5. Global Ankle Weight Analysis, Insights and Forecast, 2020-2032
- 5.1. Market Analysis, Insights and Forecast - by Application
- 5.1.1. Children
- 5.1.2. Adult
- 5.2. Market Analysis, Insights and Forecast - by Types
- 5.2.1. Under 6 Pounds
- 5.2.2. 6-9.9 Pounds
- 5.2.3. 10-11.9 Pounds
- 5.2.4. Above 12 Pounds
- 5.3. Market Analysis, Insights and Forecast - by Region
- 5.3.1. North America
- 5.3.2. South America
- 5.3.3. Europe
- 5.3.4. Middle East & Africa
- 5.3.5. Asia Pacific
- 5.1. Market Analysis, Insights and Forecast - by Application
- 6. North America Ankle Weight Analysis, Insights and Forecast, 2020-2032
- 6.1. Market Analysis, Insights and Forecast - by Application
- 6.1.1. Children
- 6.1.2. Adult
- 6.2. Market Analysis, Insights and Forecast - by Types
- 6.2.1. Under 6 Pounds
- 6.2.2. 6-9.9 Pounds
- 6.2.3. 10-11.9 Pounds
- 6.2.4. Above 12 Pounds
- 6.1. Market Analysis, Insights and Forecast - by Application
- 7. South America Ankle Weight Analysis, Insights and Forecast, 2020-2032
- 7.1. Market Analysis, Insights and Forecast - by Application
- 7.1.1. Children
- 7.1.2. Adult
- 7.2. Market Analysis, Insights and Forecast - by Types
- 7.2.1. Under 6 Pounds
- 7.2.2. 6-9.9 Pounds
- 7.2.3. 10-11.9 Pounds
- 7.2.4. Above 12 Pounds
- 7.1. Market Analysis, Insights and Forecast - by Application
- 8. Europe Ankle Weight Analysis, Insights and Forecast, 2020-2032
- 8.1. Market Analysis, Insights and Forecast - by Application
- 8.1.1. Children
- 8.1.2. Adult
- 8.2. Market Analysis, Insights and Forecast - by Types
- 8.2.1. Under 6 Pounds
- 8.2.2. 6-9.9 Pounds
- 8.2.3. 10-11.9 Pounds
- 8.2.4. Above 12 Pounds
- 8.1. Market Analysis, Insights and Forecast - by Application
- 9. Middle East & Africa Ankle Weight Analysis, Insights and Forecast, 2020-2032
- 9.1. Market Analysis, Insights and Forecast - by Application
- 9.1.1. Children
- 9.1.2. Adult
- 9.2. Market Analysis, Insights and Forecast - by Types
- 9.2.1. Under 6 Pounds
- 9.2.2. 6-9.9 Pounds
- 9.2.3. 10-11.9 Pounds
- 9.2.4. Above 12 Pounds
- 9.1. Market Analysis, Insights and Forecast - by Application
- 10. Asia Pacific Ankle Weight Analysis, Insights and Forecast, 2020-2032
- 10.1. Market Analysis, Insights and Forecast - by Application
- 10.1.1. Children
- 10.1.2. Adult
- 10.2. Market Analysis, Insights and Forecast - by Types
- 10.2.1. Under 6 Pounds
- 10.2.2. 6-9.9 Pounds
- 10.2.3. 10-11.9 Pounds
- 10.2.4. Above 12 Pounds
- 10.1. Market Analysis, Insights and Forecast - by Application
- 11. Competitive Analysis
- 11.1. Global Market Share Analysis 2025
- 11.2. Company Profiles
- 11.2.1 Hausmann
- 11.2.1.1. Overview
- 11.2.1.2. Products
- 11.2.1.3. SWOT Analysis
- 11.2.1.4. Recent Developments
- 11.2.1.5. Financials (Based on Availability)
- 11.2.2 All Pro
- 11.2.2.1. Overview
- 11.2.2.2. Products
- 11.2.2.3. SWOT Analysis
- 11.2.2.4. Recent Developments
- 11.2.2.5. Financials (Based on Availability)
- 11.2.3 Sea Pearls
- 11.2.3.1. Overview
- 11.2.3.2. Products
- 11.2.3.3. SWOT Analysis
- 11.2.3.4. Recent Developments
- 11.2.3.5. Financials (Based on Availability)
- 11.2.4 SPRI
- 11.2.4.1. Overview
- 11.2.4.2. Products
- 11.2.4.3. SWOT Analysis
- 11.2.4.4. Recent Developments
- 11.2.4.5. Financials (Based on Availability)
- 11.2.5 TKO
- 11.2.5.1. Overview
- 11.2.5.2. Products
- 11.2.5.3. SWOT Analysis
- 11.2.5.4. Recent Developments
- 11.2.5.5. Financials (Based on Availability)
- 11.2.6 Adidas
- 11.2.6.1. Overview
- 11.2.6.2. Products
- 11.2.6.3. SWOT Analysis
- 11.2.6.4. Recent Developments
- 11.2.6.5. Financials (Based on Availability)
- 11.2.1 Hausmann
List of Figures
- Figure 1: Global Ankle Weight Revenue Breakdown (undefined, %) by Region 2025 & 2033
- Figure 2: Global Ankle Weight Volume Breakdown (K, %) by Region 2025 & 2033
- Figure 3: North America Ankle Weight Revenue (undefined), by Application 2025 & 2033
- Figure 4: North America Ankle Weight Volume (K), by Application 2025 & 2033
- Figure 5: North America Ankle Weight Revenue Share (%), by Application 2025 & 2033
- Figure 6: North America Ankle Weight Volume Share (%), by Application 2025 & 2033
- Figure 7: North America Ankle Weight Revenue (undefined), by Types 2025 & 2033
- Figure 8: North America Ankle Weight Volume (K), by Types 2025 & 2033
- Figure 9: North America Ankle Weight Revenue Share (%), by Types 2025 & 2033
- Figure 10: North America Ankle Weight Volume Share (%), by Types 2025 & 2033
- Figure 11: North America Ankle Weight Revenue (undefined), by Country 2025 & 2033
- Figure 12: North America Ankle Weight Volume (K), by Country 2025 & 2033
- Figure 13: North America Ankle Weight Revenue Share (%), by Country 2025 & 2033
- Figure 14: North America Ankle Weight Volume Share (%), by Country 2025 & 2033
- Figure 15: South America Ankle Weight Revenue (undefined), by Application 2025 & 2033
- Figure 16: South America Ankle Weight Volume (K), by Application 2025 & 2033
- Figure 17: South America Ankle Weight Revenue Share (%), by Application 2025 & 2033
- Figure 18: South America Ankle Weight Volume Share (%), by Application 2025 & 2033
- Figure 19: South America Ankle Weight Revenue (undefined), by Types 2025 & 2033
- Figure 20: South America Ankle Weight Volume (K), by Types 2025 & 2033
- Figure 21: South America Ankle Weight Revenue Share (%), by Types 2025 & 2033
- Figure 22: South America Ankle Weight Volume Share (%), by Types 2025 & 2033
- Figure 23: South America Ankle Weight Revenue (undefined), by Country 2025 & 2033
- Figure 24: South America Ankle Weight Volume (K), by Country 2025 & 2033
- Figure 25: South America Ankle Weight Revenue Share (%), by Country 2025 & 2033
- Figure 26: South America Ankle Weight Volume Share (%), by Country 2025 & 2033
- Figure 27: Europe Ankle Weight Revenue (undefined), by Application 2025 & 2033
- Figure 28: Europe Ankle Weight Volume (K), by Application 2025 & 2033
- Figure 29: Europe Ankle Weight Revenue Share (%), by Application 2025 & 2033
- Figure 30: Europe Ankle Weight Volume Share (%), by Application 2025 & 2033
- Figure 31: Europe Ankle Weight Revenue (undefined), by Types 2025 & 2033
- Figure 32: Europe Ankle Weight Volume (K), by Types 2025 & 2033
- Figure 33: Europe Ankle Weight Revenue Share (%), by Types 2025 & 2033
- Figure 34: Europe Ankle Weight Volume Share (%), by Types 2025 & 2033
- Figure 35: Europe Ankle Weight Revenue (undefined), by Country 2025 & 2033
- Figure 36: Europe Ankle Weight Volume (K), by Country 2025 & 2033
- Figure 37: Europe Ankle Weight Revenue Share (%), by Country 2025 & 2033
- Figure 38: Europe Ankle Weight Volume Share (%), by Country 2025 & 2033
- Figure 39: Middle East & Africa Ankle Weight Revenue (undefined), by Application 2025 & 2033
- Figure 40: Middle East & Africa Ankle Weight Volume (K), by Application 2025 & 2033
- Figure 41: Middle East & Africa Ankle Weight Revenue Share (%), by Application 2025 & 2033
- Figure 42: Middle East & Africa Ankle Weight Volume Share (%), by Application 2025 & 2033
- Figure 43: Middle East & Africa Ankle Weight Revenue (undefined), by Types 2025 & 2033
- Figure 44: Middle East & Africa Ankle Weight Volume (K), by Types 2025 & 2033
- Figure 45: Middle East & Africa Ankle Weight Revenue Share (%), by Types 2025 & 2033
- Figure 46: Middle East & Africa Ankle Weight Volume Share (%), by Types 2025 & 2033
- Figure 47: Middle East & Africa Ankle Weight Revenue (undefined), by Country 2025 & 2033
- Figure 48: Middle East & Africa Ankle Weight Volume (K), by Country 2025 & 2033
- Figure 49: Middle East & Africa Ankle Weight Revenue Share (%), by Country 2025 & 2033
- Figure 50: Middle East & Africa Ankle Weight Volume Share (%), by Country 2025 & 2033
- Figure 51: Asia Pacific Ankle Weight Revenue (undefined), by Application 2025 & 2033
- Figure 52: Asia Pacific Ankle Weight Volume (K), by Application 2025 & 2033
- Figure 53: Asia Pacific Ankle Weight Revenue Share (%), by Application 2025 & 2033
- Figure 54: Asia Pacific Ankle Weight Volume Share (%), by Application 2025 & 2033
- Figure 55: Asia Pacific Ankle Weight Revenue (undefined), by Types 2025 & 2033
- Figure 56: Asia Pacific Ankle Weight Volume (K), by Types 2025 & 2033
- Figure 57: Asia Pacific Ankle Weight Revenue Share (%), by Types 2025 & 2033
- Figure 58: Asia Pacific Ankle Weight Volume Share (%), by Types 2025 & 2033
- Figure 59: Asia Pacific Ankle Weight Revenue (undefined), by Country 2025 & 2033
- Figure 60: Asia Pacific Ankle Weight Volume (K), by Country 2025 & 2033
- Figure 61: Asia Pacific Ankle Weight Revenue Share (%), by Country 2025 & 2033
- Figure 62: Asia Pacific Ankle Weight Volume Share (%), by Country 2025 & 2033
List of Tables
- Table 1: Global Ankle Weight Revenue undefined Forecast, by Application 2020 & 2033
- Table 2: Global Ankle Weight Volume K Forecast, by Application 2020 & 2033
- Table 3: Global Ankle Weight Revenue undefined Forecast, by Types 2020 & 2033
- Table 4: Global Ankle Weight Volume K Forecast, by Types 2020 & 2033
- Table 5: Global Ankle Weight Revenue undefined Forecast, by Region 2020 & 2033
- Table 6: Global Ankle Weight Volume K Forecast, by Region 2020 & 2033
- Table 7: Global Ankle Weight Revenue undefined Forecast, by Application 2020 & 2033
- Table 8: Global Ankle Weight Volume K Forecast, by Application 2020 & 2033
- Table 9: Global Ankle Weight Revenue undefined Forecast, by Types 2020 & 2033
- Table 10: Global Ankle Weight Volume K Forecast, by Types 2020 & 2033
- Table 11: Global Ankle Weight Revenue undefined Forecast, by Country 2020 & 2033
- Table 12: Global Ankle Weight Volume K Forecast, by Country 2020 & 2033
- Table 13: United States Ankle Weight Revenue (undefined) Forecast, by Application 2020 & 2033
- Table 14: United States Ankle Weight Volume (K) Forecast, by Application 2020 & 2033
- Table 15: Canada Ankle Weight Revenue (undefined) Forecast, by Application 2020 & 2033
- Table 16: Canada Ankle Weight Volume (K) Forecast, by Application 2020 & 2033
- Table 17: Mexico Ankle Weight Revenue (undefined) Forecast, by Application 2020 & 2033
- Table 18: Mexico Ankle Weight Volume (K) Forecast, by Application 2020 & 2033
- Table 19: Global Ankle Weight Revenue undefined Forecast, by Application 2020 & 2033
- Table 20: Global Ankle Weight Volume K Forecast, by Application 2020 & 2033
- Table 21: Global Ankle Weight Revenue undefined Forecast, by Types 2020 & 2033
- Table 22: Global Ankle Weight Volume K Forecast, by Types 2020 & 2033
- Table 23: Global Ankle Weight Revenue undefined Forecast, by Country 2020 & 2033
- Table 24: Global Ankle Weight Volume K Forecast, by Country 2020 & 2033
- Table 25: Brazil Ankle Weight Revenue (undefined) Forecast, by Application 2020 & 2033
- Table 26: Brazil Ankle Weight Volume (K) Forecast, by Application 2020 & 2033
- Table 27: Argentina Ankle Weight Revenue (undefined) Forecast, by Application 2020 & 2033
- Table 28: Argentina Ankle Weight Volume (K) Forecast, by Application 2020 & 2033
- Table 29: Rest of South America Ankle Weight Revenue (undefined) Forecast, by Application 2020 & 2033
- Table 30: Rest of South America Ankle Weight Volume (K) Forecast, by Application 2020 & 2033
- Table 31: Global Ankle Weight Revenue undefined Forecast, by Application 2020 & 2033
- Table 32: Global Ankle Weight Volume K Forecast, by Application 2020 & 2033
- Table 33: Global Ankle Weight Revenue undefined Forecast, by Types 2020 & 2033
- Table 34: Global Ankle Weight Volume K Forecast, by Types 2020 & 2033
- Table 35: Global Ankle Weight Revenue undefined Forecast, by Country 2020 & 2033
- Table 36: Global Ankle Weight Volume K Forecast, by Country 2020 & 2033
- Table 37: United Kingdom Ankle Weight Revenue (undefined) Forecast, by Application 2020 & 2033
- Table 38: United Kingdom Ankle Weight Volume (K) Forecast, by Application 2020 & 2033
- Table 39: Germany Ankle Weight Revenue (undefined) Forecast, by Application 2020 & 2033
- Table 40: Germany Ankle Weight Volume (K) Forecast, by Application 2020 & 2033
- Table 41: France Ankle Weight Revenue (undefined) Forecast, by Application 2020 & 2033
- Table 42: France Ankle Weight Volume (K) Forecast, by Application 2020 & 2033
- Table 43: Italy Ankle Weight Revenue (undefined) Forecast, by Application 2020 & 2033
- Table 44: Italy Ankle Weight Volume (K) Forecast, by Application 2020 & 2033
- Table 45: Spain Ankle Weight Revenue (undefined) Forecast, by Application 2020 & 2033
- Table 46: Spain Ankle Weight Volume (K) Forecast, by Application 2020 & 2033
- Table 47: Russia Ankle Weight Revenue (undefined) Forecast, by Application 2020 & 2033
- Table 48: Russia Ankle Weight Volume (K) Forecast, by Application 2020 & 2033
- Table 49: Benelux Ankle Weight Revenue (undefined) Forecast, by Application 2020 & 2033
- Table 50: Benelux Ankle Weight Volume (K) Forecast, by Application 2020 & 2033
- Table 51: Nordics Ankle Weight Revenue (undefined) Forecast, by Application 2020 & 2033
- Table 52: Nordics Ankle Weight Volume (K) Forecast, by Application 2020 & 2033
- Table 53: Rest of Europe Ankle Weight Revenue (undefined) Forecast, by Application 2020 & 2033
- Table 54: Rest of Europe Ankle Weight Volume (K) Forecast, by Application 2020 & 2033
- Table 55: Global Ankle Weight Revenue undefined Forecast, by Application 2020 & 2033
- Table 56: Global Ankle Weight Volume K Forecast, by Application 2020 & 2033
- Table 57: Global Ankle Weight Revenue undefined Forecast, by Types 2020 & 2033
- Table 58: Global Ankle Weight Volume K Forecast, by Types 2020 & 2033
- Table 59: Global Ankle Weight Revenue undefined Forecast, by Country 2020 & 2033
- Table 60: Global Ankle Weight Volume K Forecast, by Country 2020 & 2033
- Table 61: Turkey Ankle Weight Revenue (undefined) Forecast, by Application 2020 & 2033
- Table 62: Turkey Ankle Weight Volume (K) Forecast, by Application 2020 & 2033
- Table 63: Israel Ankle Weight Revenue (undefined) Forecast, by Application 2020 & 2033
- Table 64: Israel Ankle Weight Volume (K) Forecast, by Application 2020 & 2033
- Table 65: GCC Ankle Weight Revenue (undefined) Forecast, by Application 2020 & 2033
- Table 66: GCC Ankle Weight Volume (K) Forecast, by Application 2020 & 2033
- Table 67: North Africa Ankle Weight Revenue (undefined) Forecast, by Application 2020 & 2033
- Table 68: North Africa Ankle Weight Volume (K) Forecast, by Application 2020 & 2033
- Table 69: South Africa Ankle Weight Revenue (undefined) Forecast, by Application 2020 & 2033
- Table 70: South Africa Ankle Weight Volume (K) Forecast, by Application 2020 & 2033
- Table 71: Rest of Middle East & Africa Ankle Weight Revenue (undefined) Forecast, by Application 2020 & 2033
- Table 72: Rest of Middle East & Africa Ankle Weight Volume (K) Forecast, by Application 2020 & 2033
- Table 73: Global Ankle Weight Revenue undefined Forecast, by Application 2020 & 2033
- Table 74: Global Ankle Weight Volume K Forecast, by Application 2020 & 2033
- Table 75: Global Ankle Weight Revenue undefined Forecast, by Types 2020 & 2033
- Table 76: Global Ankle Weight Volume K Forecast, by Types 2020 & 2033
- Table 77: Global Ankle Weight Revenue undefined Forecast, by Country 2020 & 2033
- Table 78: Global Ankle Weight Volume K Forecast, by Country 2020 & 2033
- Table 79: China Ankle Weight Revenue (undefined) Forecast, by Application 2020 & 2033
- Table 80: China Ankle Weight Volume (K) Forecast, by Application 2020 & 2033
- Table 81: India Ankle Weight Revenue (undefined) Forecast, by Application 2020 & 2033
- Table 82: India Ankle Weight Volume (K) Forecast, by Application 2020 & 2033
- Table 83: Japan Ankle Weight Revenue (undefined) Forecast, by Application 2020 & 2033
- Table 84: Japan Ankle Weight Volume (K) Forecast, by Application 2020 & 2033
- Table 85: South Korea Ankle Weight Revenue (undefined) Forecast, by Application 2020 & 2033
- Table 86: South Korea Ankle Weight Volume (K) Forecast, by Application 2020 & 2033
- Table 87: ASEAN Ankle Weight Revenue (undefined) Forecast, by Application 2020 & 2033
- Table 88: ASEAN Ankle Weight Volume (K) Forecast, by Application 2020 & 2033
- Table 89: Oceania Ankle Weight Revenue (undefined) Forecast, by Application 2020 & 2033
- Table 90: Oceania Ankle Weight Volume (K) Forecast, by Application 2020 & 2033
- Table 91: Rest of Asia Pacific Ankle Weight Revenue (undefined) Forecast, by Application 2020 & 2033
- Table 92: Rest of Asia Pacific Ankle Weight Volume (K) Forecast, by Application 2020 & 2033
Frequently Asked Questions
1. What is the projected Compound Annual Growth Rate (CAGR) of the Ankle Weight?
The projected CAGR is approximately 7.5%.
2. Which companies are prominent players in the Ankle Weight?
Key companies in the market include Hausmann, All Pro, Sea Pearls, SPRI, TKO, Adidas.
3. What are the main segments of the Ankle Weight?
The market segments include Application, Types.
4. Can you provide details about the market size?
The market size is estimated to be USD XXX N/A as of 2022.
5. What are some drivers contributing to market growth?
N/A
6. What are the notable trends driving market growth?
N/A
7. Are there any restraints impacting market growth?
N/A
8. Can you provide examples of recent developments in the market?
N/A
9. What pricing options are available for accessing the report?
Pricing options include single-user, multi-user, and enterprise licenses priced at USD 3950.00, USD 5925.00, and USD 7900.00 respectively.
10. Is the market size provided in terms of value or volume?
The market size is provided in terms of value, measured in N/A and volume, measured in K.
11. Are there any specific market keywords associated with the report?
Yes, the market keyword associated with the report is "Ankle Weight," which aids in identifying and referencing the specific market segment covered.
12. How do I determine which pricing option suits my needs best?
The pricing options vary based on user requirements and access needs. Individual users may opt for single-user licenses, while businesses requiring broader access may choose multi-user or enterprise licenses for cost-effective access to the report.
13. Are there any additional resources or data provided in the Ankle Weight report?
While the report offers comprehensive insights, it's advisable to review the specific contents or supplementary materials provided to ascertain if additional resources or data are available.
14. How can I stay updated on further developments or reports in the Ankle Weight?
To stay informed about further developments, trends, and reports in the Ankle Weight, consider subscribing to industry newsletters, following relevant companies and organizations, or regularly checking reputable industry news sources and publications.
Methodology
Step 1 - Identification of Relevant Samples Size from Population Database


Step 2 - Approaches for Defining Global Market Size (Value, Volume* & Price*)

Note*: In applicable scenarios
Step 3 - Data Sources
Primary Research
- Web Analytics
- Survey Reports
- Research Institute
- Latest Research Reports
- Opinion Leaders
Secondary Research
- Annual Reports
- White Paper
- Latest Press Release
- Industry Association
- Paid Database
- Investor Presentations

Step 4 - Data Triangulation
Involves using different sources of information in order to increase the validity of a study
These sources are likely to be stakeholders in a program - participants, other researchers, program staff, other community members, and so on.
Then we put all data in single framework & apply various statistical tools to find out the dynamic on the market.
During the analysis stage, feedback from the stakeholder groups would be compared to determine areas of agreement as well as areas of divergence