

Key Insights
The Automotive Mechanical Lidar market is poised for explosive growth, projected to reach USD 1.25 billion in 2025 and expand at a remarkable Compound Annual Growth Rate (CAGR) of 34.2% through 2033. This surge is primarily driven by the escalating demand for advanced driver-assistance systems (ADAS) and the accelerating adoption of autonomous driving technologies across both passenger and commercial vehicles. As regulatory frameworks become more supportive and consumer awareness of safety benefits increases, the integration of mechanical lidar sensors is becoming a critical component for enhanced perception, object detection, and precise environmental mapping, crucial for navigating complex traffic scenarios and ensuring a higher level of vehicle safety.
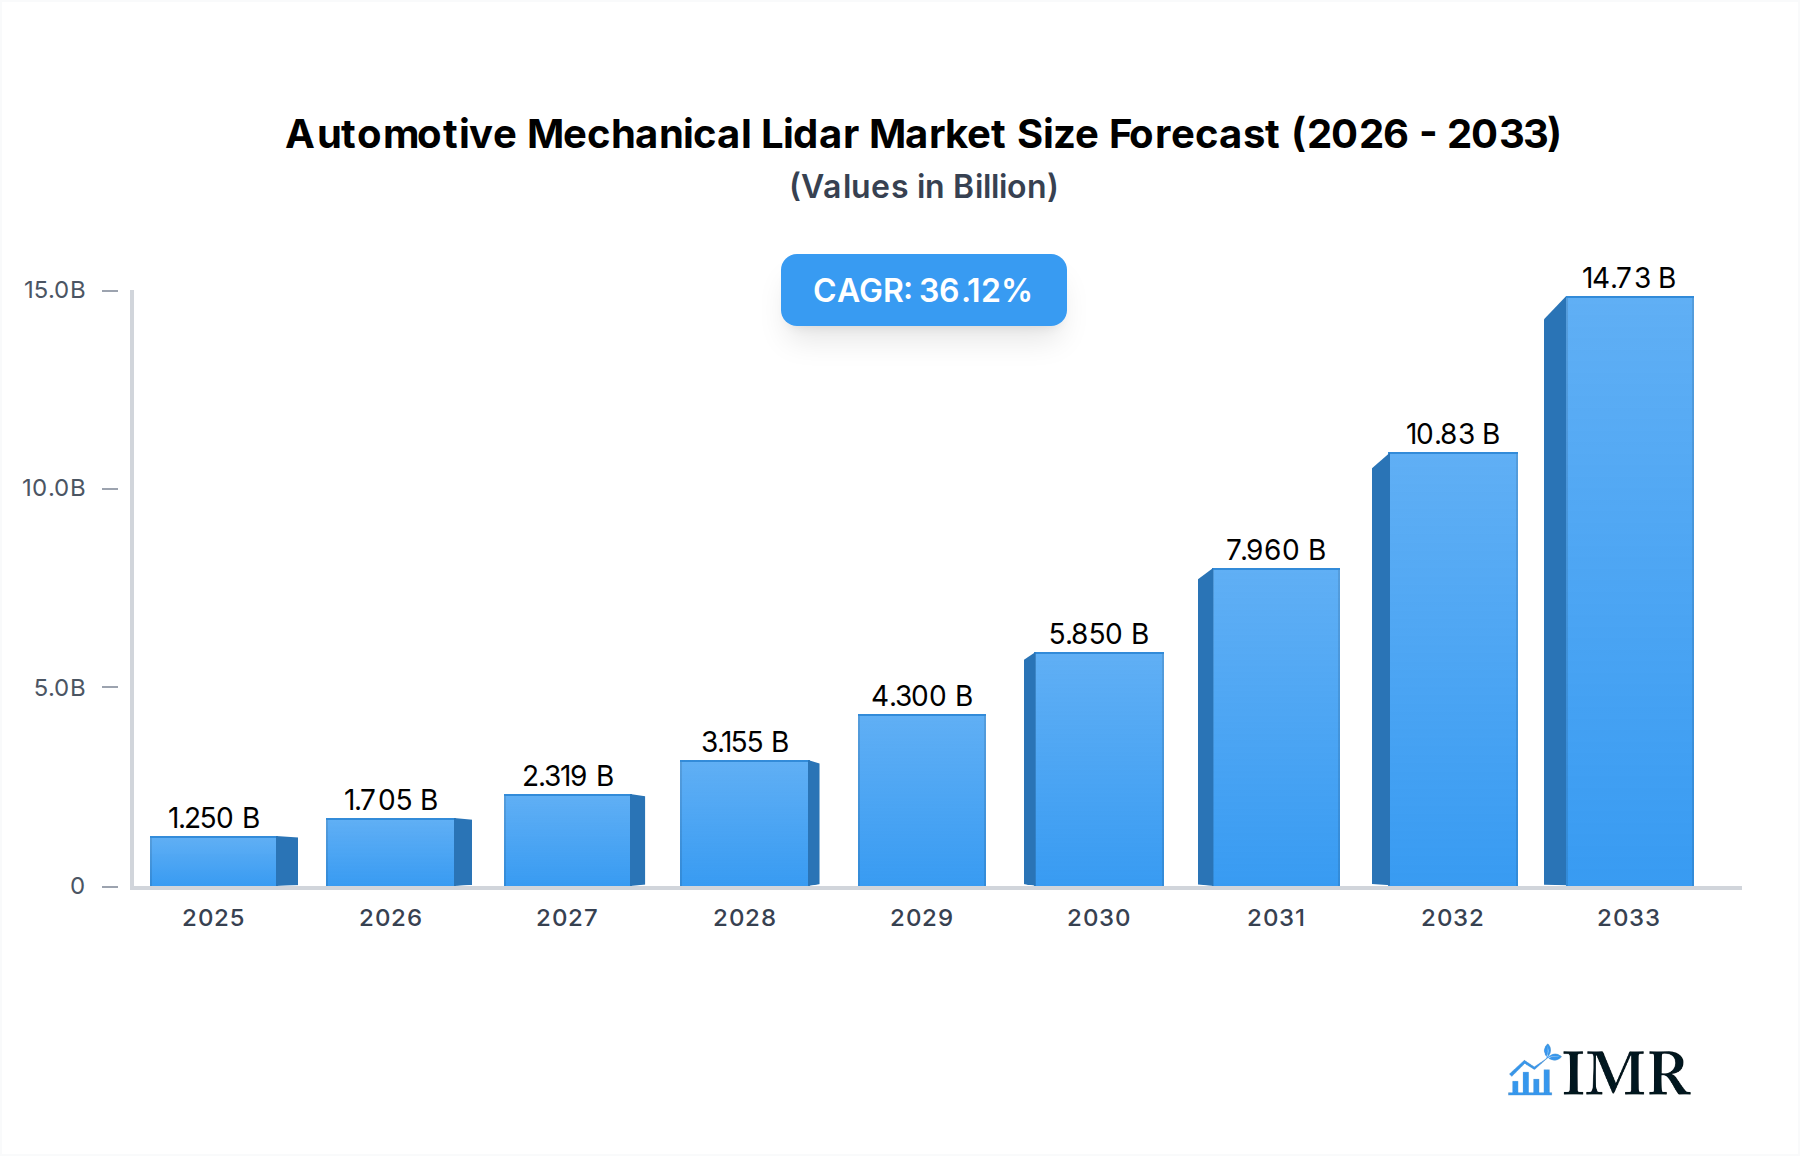
Automotive Mechanical Lidar Market Size (In Billion)
The market's dynamism is further fueled by continuous innovation in lidar technology, leading to more cost-effective, robust, and high-performance solutions. Trends such as the development of solid-state lidar and advancements in data processing algorithms are paving the way for wider integration. While the substantial investment in research and development and the inherent complexity of sensor integration can pose challenges, the overwhelming strategic imperative for enhanced automotive safety and the pursuit of autonomous mobility are powerful tailwinds. Major industry players are actively investing in R&D and strategic partnerships to capture a significant share of this rapidly expanding market, with North America, Europe, and Asia Pacific expected to be key regional hubs for adoption and innovation.

Automotive Mechanical Lidar Company Market Share
Automotive Mechanical Lidar Market Dynamics & Structure
The global automotive mechanical lidar market is characterized by a dynamic interplay of technological innovation, stringent regulatory evolution, and a robust competitive landscape. Market concentration is moderately high, with key players investing heavily in research and development to enhance sensor performance, reduce costs, and improve integration into vehicle architectures. Major drivers include the escalating demand for advanced driver-assistance systems (ADAS) and the inevitable progression towards autonomous driving, necessitating precise environmental perception. Regulatory frameworks, particularly those promoting vehicle safety standards and autonomous driving mandates, are crucial in shaping market adoption. Competitive product substitutes, primarily advanced camera systems and radar, exert pressure, pushing lidar manufacturers to demonstrate superior performance, especially in adverse weather conditions and challenging lighting. End-user demographics lean towards tech-savvy consumers and fleet operators prioritizing safety and efficiency. Mergers and acquisitions (M&A) are significant, driven by the need for consolidated expertise, expanded product portfolios, and accelerated market penetration.
- Market Concentration: Moderate to high, with significant investments from Tier-1 suppliers and specialized lidar companies.
- Technological Innovation Drivers: Miniaturization of components, improved resolution, enhanced range, cost reduction through mass production, and the development of solid-state lidar solutions.
- Regulatory Frameworks: Evolving safety standards (e.g., NCAP ratings), legislation for autonomous vehicle testing and deployment, and data privacy concerns related to sensor data.
- Competitive Product Substitutes: Advanced vision systems, radar, ultrasonic sensors, and emerging sensor fusion technologies.
- End-User Demographics: Early adopters of advanced automotive technology, commercial vehicle fleets seeking operational efficiency and safety enhancements, and ride-sharing services.
- M&A Trends: Driven by the need for vertical integration, access to intellectual property, and scaling production capabilities. Recent M&A activity indicates a consolidation phase, aiming to create comprehensive ADAS and autonomous driving solutions.
Automotive Mechanical Lidar Growth Trends & Insights
The automotive mechanical lidar market is poised for substantial expansion, driven by an accelerating adoption rate as automakers increasingly integrate these sophisticated sensors into their vehicle platforms. The global market size, projected to reach an estimated $8.50 billion by 2025, is on a trajectory for robust growth, with a projected Compound Annual Growth Rate (CAGR) of 28.95% from 2025 to 2033. This significant upward trend is underpinned by a confluence of factors, including the relentless pursuit of enhanced vehicle safety features and the burgeoning development of higher levels of driving automation. As the automotive industry transitions from advanced driver-assistance systems (ADAS) to fully autonomous capabilities, the demand for high-fidelity, real-time environmental data provided by lidar becomes indispensable.
Technological advancements are continuously improving lidar performance, making it more viable and cost-effective for mass-market applications. Innovations such as solid-state lidar, which eliminates moving parts, promise greater durability, lower costs, and reduced form factors, making them more amenable to automotive integration. This technological disruption is critical in overcoming previous barriers related to price and reliability. Furthermore, the increasing sophistication of sensor fusion algorithms, which combine data from lidar with other sensors like cameras and radar, unlocks more accurate and robust perception systems, accelerating the deployment of autonomous functionalities.
Consumer behavior is also shifting, with a growing acceptance and expectation of advanced safety technologies. As more vehicles equipped with lidar enter the market and their benefits become more evident through real-world demonstrations and educational campaigns, consumer confidence and demand are expected to rise. This positive feedback loop, where technological progress fuels adoption, which in turn drives further investment and innovation, is a hallmark of the current growth phase. The penetration of lidar technology in both passenger and commercial vehicle segments is expected to surge, moving beyond niche applications in premium vehicles and robotaxis to become a standard feature in a wider array of automotive offerings. The historical period from 2019 to 2024 has laid the groundwork for this explosive growth, witnessing significant R&D breakthroughs and initial integration into high-end models, setting the stage for widespread adoption in the forecast period.
Dominant Regions, Countries, or Segments in Automotive Mechanical Lidar
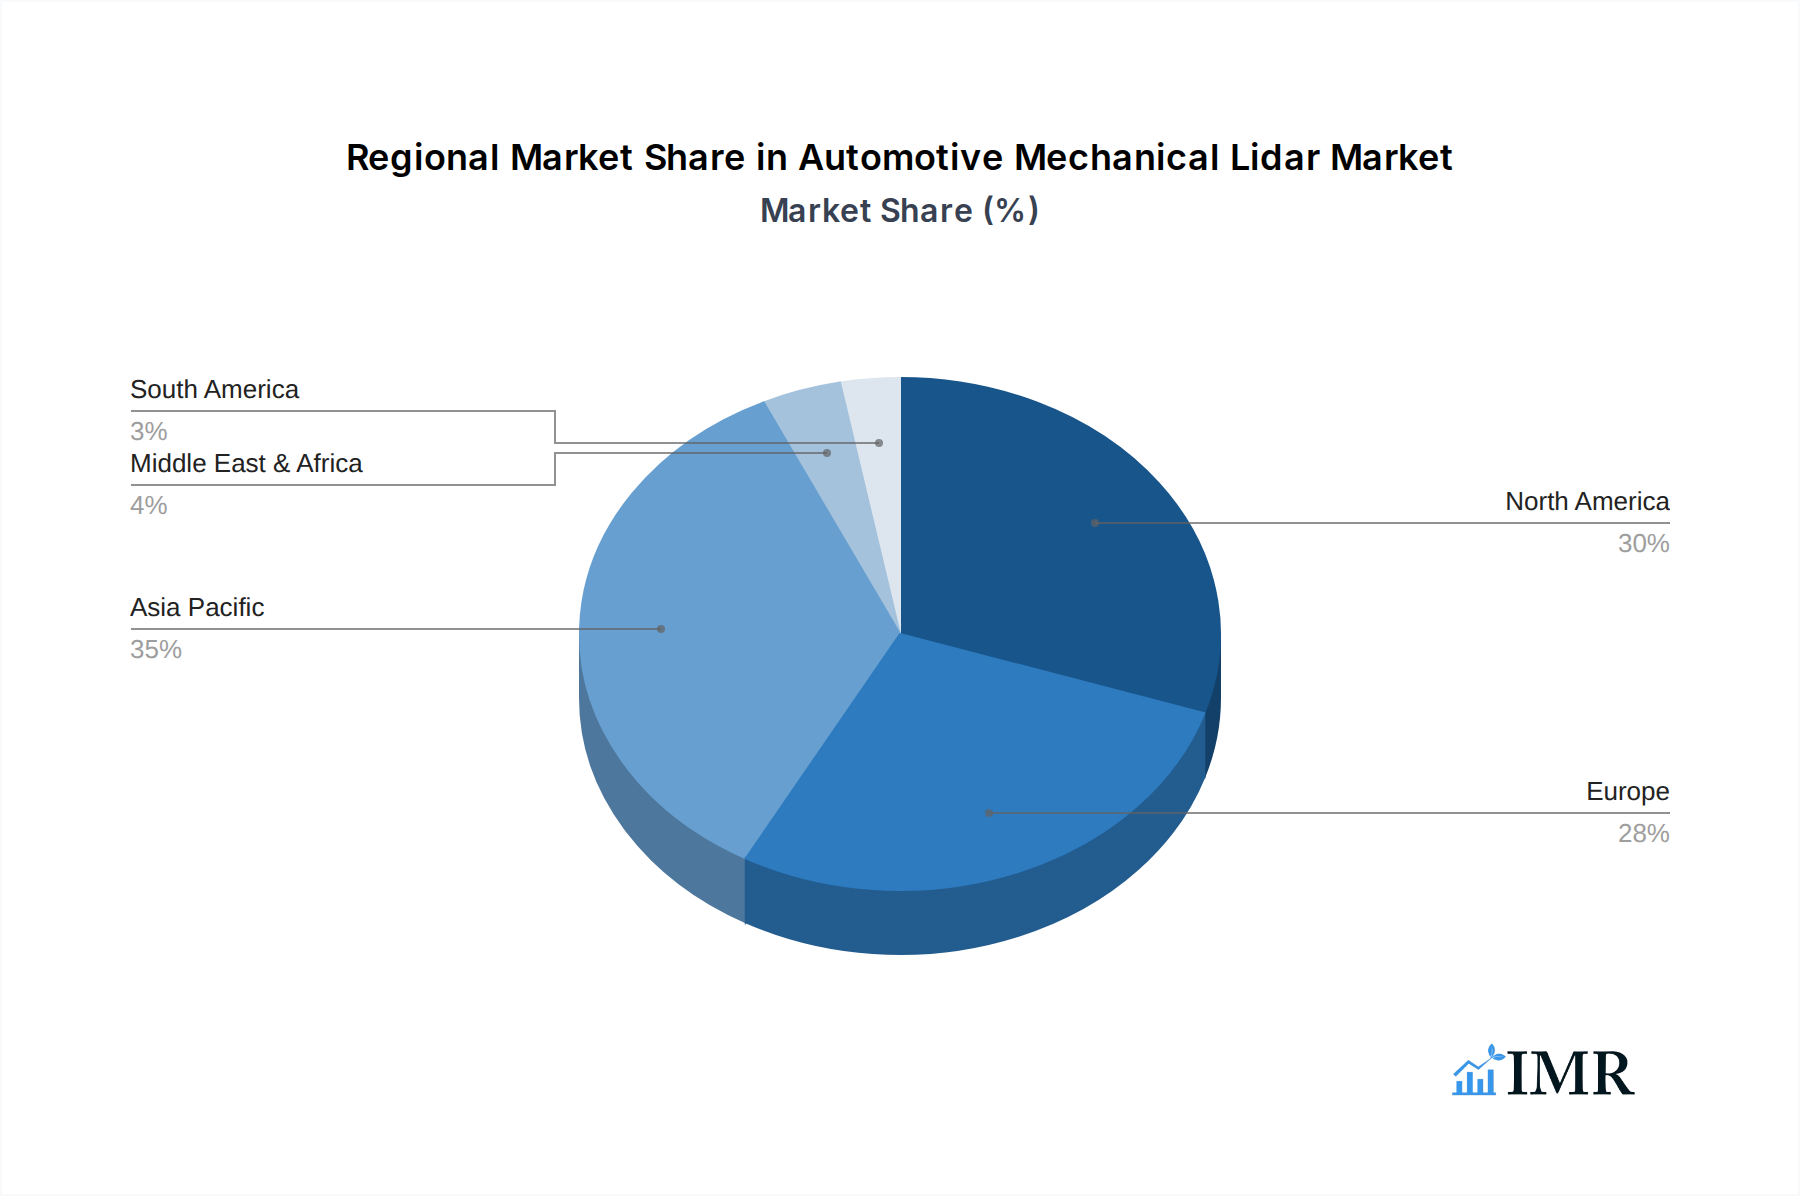
The global automotive mechanical lidar market is experiencing dynamic growth, with specific regions, countries, and application segments emerging as key drivers of this expansion. North America, particularly the United States, stands out as a dominant region due to its pioneering role in autonomous vehicle development, significant investments in automotive R&D, and the presence of leading technology companies and automotive manufacturers actively pushing the boundaries of autonomous driving. The region's proactive stance on testing and deployment of autonomous vehicles, coupled with supportive governmental initiatives and a robust venture capital ecosystem, provides fertile ground for lidar adoption. Furthermore, the high disposable income and consumer appetite for advanced automotive technologies in North America contribute to a strong demand for sophisticated safety and autonomous features.
Within North America, the United States is a focal point, housing major players like Velodyne and Quanergy Systems, and serving as a testing ground for numerous autonomous vehicle programs. The country's extensive highway infrastructure and a growing number of pilot projects for autonomous trucking and ride-hailing services further bolster the market's growth trajectory. Economic policies that encourage innovation and investment in cutting-edge technologies, alongside a well-established automotive supply chain, solidify its leading position.
Examining the application segments, Passenger Vehicles are currently the largest and most influential segment driving market growth. The increasing integration of ADAS features, such as adaptive cruise control, automatic emergency braking, and lane-keeping assist, in mainstream passenger cars necessitates advanced perception capabilities. As automakers strive to differentiate their offerings and meet evolving consumer expectations for safety and convenience, lidar is becoming a critical component in these advanced systems. The drive towards higher levels of automation, from Level 2 to Level 4 autonomy, in passenger cars is a significant catalyst. The sheer volume of passenger vehicle production globally ensures that this segment commands the lion's share of lidar deployments.
However, the Commercial Vehicle segment, encompassing trucks and delivery vans, presents a substantial and rapidly growing opportunity. The economic imperative for enhanced safety, improved fuel efficiency, and optimized logistics in the commercial sector makes autonomous driving solutions highly attractive. Technologies like platooning, where trucks can electronically link and travel in close proximity, powered by sophisticated lidar systems, promise significant operational cost savings. Furthermore, the ongoing development of autonomous trucking routes and the need to address driver shortages are powerful motivators for lidar adoption in this sector. While passenger vehicles currently lead in volume, the growth potential in the commercial vehicle segment is immense, driven by strong ROI propositions.
Considering the types of lidar, Fixed lidar systems, which are typically solid-state or have fewer moving parts compared to their mechanical counterparts, are gaining prominence. Their advantages in terms of durability, reliability, and cost-effectiveness are making them increasingly favored for automotive integration. While spiral lidar, a type of spinning lidar, has been instrumental in early development, the industry is moving towards more integrated and robust fixed solutions that can withstand the rigors of automotive environments more effectively and be manufactured at scale for mass deployment.
Automotive Mechanical Lidar Product Landscape
The automotive mechanical lidar product landscape is characterized by a rapid evolution of sensor technologies aimed at enhancing perception for advanced driver-assistance systems (ADAS) and autonomous driving. Manufacturers are pushing the boundaries with innovations in resolution, range, and field of view, enabling vehicles to accurately detect and classify objects with remarkable precision. Unique selling propositions often revolve around all-weather performance, superior object detection in low-light conditions, and the ability to generate dense 3D point clouds for detailed environmental mapping. Technological advancements such as MEMS (Micro-Electro-Mechanical Systems) mirrors and optical phased arrays are driving the development of more compact, reliable, and cost-effective solid-state lidar solutions, moving away from traditional spinning units.
Key Drivers, Barriers & Challenges in Automotive Mechanical Lidar
Key Drivers:
- Advancement of Autonomous Driving: The relentless pursuit of higher levels of vehicle autonomy (L2-L5) is the primary catalyst, demanding sophisticated perception systems that lidar excels at providing.
- Enhanced Vehicle Safety: Lidar's ability to accurately detect objects in all lighting and weather conditions significantly bolsters ADAS features, reducing accident rates and improving overall safety.
- Technological Innovations: Miniaturization, cost reduction through solid-state designs, improved resolution, and extended range are making lidar more viable for mass production.
- Government Regulations and Safety Standards: Increasing safety mandates and the push for autonomous vehicle testing and deployment worldwide are driving adoption.
Barriers & Challenges:
- High Cost of Implementation: Despite significant reductions, lidar sensors remain a considerable expense, hindering widespread adoption in lower-tier vehicle segments. Quantifiable impact: Early adoption was limited to premium vehicles due to lidar unit costs often exceeding $1,000.
- Integration Complexity: Seamlessly integrating lidar into a vehicle's existing architecture, including sensor fusion with cameras and radar, presents engineering challenges.
- Supply Chain Volatility: Ensuring a consistent and scalable supply of high-quality lidar components can be challenging, particularly with the rapid growth in demand.
- Regulatory Uncertainty: While evolving, clear and standardized regulations for autonomous vehicle deployment are still developing in many regions, creating a degree of uncertainty for manufacturers.
- Competition from Other Sensors: Advanced camera and radar technologies continue to improve, offering alternative or complementary solutions that can sometimes be more cost-effective for specific ADAS functions.
Emerging Opportunities in Automotive Mechanical Lidar
Emerging opportunities in the automotive mechanical lidar market are centered around the expansion of its application beyond traditional ADAS in passenger vehicles. The burgeoning field of autonomous trucking and logistics presents a significant untapped market, where lidar can optimize route planning, enhance safety during long-haul operations, and enable depot automation. Furthermore, the increasing demand for sophisticated driver monitoring systems, which can detect driver fatigue or distraction using lidar's precise depth sensing, offers another avenue for growth. Opportunities also lie in developing specialized lidar solutions for niche automotive applications such as off-road vehicles, construction equipment, and last-mile delivery robots, where robust environmental perception is crucial. The ongoing miniaturization and cost reduction efforts are also unlocking opportunities for lidar to be integrated into a wider array of vehicle types and price points.
Growth Accelerators in the Automotive Mechanical Lidar Industry
Several key growth accelerators are propelling the automotive mechanical lidar industry forward. Foremost among these is the relentless advancement in sensor technology, particularly the transition towards solid-state lidar solutions. These innovations promise enhanced reliability, reduced manufacturing costs, and a smaller form factor, making them more attractive for mass automotive integration. Strategic partnerships between lidar manufacturers and major automotive OEMs are crucial, as they facilitate co-development, validation, and accelerate the integration of lidar into vehicle production pipelines. Furthermore, the growing ecosystem of software and AI companies developing advanced algorithms for sensor fusion and perception is a significant accelerator, unlocking the full potential of lidar data for autonomous decision-making. The increasing regulatory support and the establishment of industry standards for autonomous driving technologies are also vital in fostering a more predictable and growth-conducive environment.
Key Players Shaping the Automotive Mechanical Lidar Market
- Robert Bosch
- Continental
- Denso
- TE Connectivity
- Hella KGaA Hueck
- Leddar Tech
- Quanergy Systems
- Velodyne
- Slamtec Co.,Ltd
- Robosense Technology Co.,Ltd
- Leishen Intelligence System Co.,Ltd
- Neuvition Technology Co.,Ltd
- Litra Technology Co.,Ltd
- Hesai Group
Notable Milestones in Automotive Mechanical Lidar Sector
- 2020: Velodyne Lidar introduces its Puck series, a more compact and cost-effective lidar sensor, marking a step towards wider adoption in automotive.
- 2021: Hesai Technology launches the Pandar series, featuring higher resolution and longer range, catering to the demands of autonomous driving.
- 2021: Continental announces its strategic investment in Waymo's lidar technology, signaling a strong commitment from a major Tier-1 supplier to autonomous driving solutions.
- 2022: RoboSense Technology rolls out its advanced MEMS lidar solutions, emphasizing cost-effectiveness and mass-producibility for automotive OEMs.
- 2022: Leddar Tech unveils its modular lidar sensing platform, designed for flexible integration across various automotive applications and levels of autonomy.
- 2023: Hesai Group's successful IPO on the Nasdaq demonstrates the growing investor confidence in the automotive lidar market.
- 2024: Several automotive OEMs begin to announce lidar integration plans for their upcoming production models, signifying a significant shift towards commercialization.
In-Depth Automotive Mechanical Lidar Market Outlook
The future outlook for the automotive mechanical lidar market is exceptionally strong, driven by a clear and accelerating demand for enhanced safety and autonomous driving capabilities. Growth accelerators such as rapid technological advancements, particularly in solid-state lidar, and strategic collaborations between lidar innovators and automotive giants will continue to shape the landscape. The market is expected to witness further price reductions, making lidar accessible for a broader range of vehicles. Strategic opportunities lie in expanding into developing markets with evolving automotive safety regulations and in catering to the growing demand for autonomous solutions in commercial transportation and logistics. The industry is poised for significant growth, with projections indicating a substantial increase in market penetration and value in the coming years.
Automotive Mechanical Lidar Segmentation
-
1. Application
- 1.1. Passenger Vehicle
- 1.2. Commercial Vehicle
-
2. Types
- 2.1. Fixed
- 2.2. Spiral
Automotive Mechanical Lidar Segmentation By Geography
-
1. North America
- 1.1. United States
- 1.2. Canada
- 1.3. Mexico
-
2. South America
- 2.1. Brazil
- 2.2. Argentina
- 2.3. Rest of South America
-
3. Europe
- 3.1. United Kingdom
- 3.2. Germany
- 3.3. France
- 3.4. Italy
- 3.5. Spain
- 3.6. Russia
- 3.7. Benelux
- 3.8. Nordics
- 3.9. Rest of Europe
-
4. Middle East & Africa
- 4.1. Turkey
- 4.2. Israel
- 4.3. GCC
- 4.4. North Africa
- 4.5. South Africa
- 4.6. Rest of Middle East & Africa
-
5. Asia Pacific
- 5.1. China
- 5.2. India
- 5.3. Japan
- 5.4. South Korea
- 5.5. ASEAN
- 5.6. Oceania
- 5.7. Rest of Asia Pacific
Automotive Mechanical Lidar Regional Market Share
Geographic Coverage of Automotive Mechanical Lidar
Automotive Mechanical Lidar REPORT HIGHLIGHTS
| Aspects | Details |
|---|---|
| Study Period | 2020-2034 |
| Base Year | 2025 |
| Estimated Year | 2026 |
| Forecast Period | 2026-2034 |
| Historical Period | 2020-2025 |
| Growth Rate | CAGR of 34.2% from 2020-2034 |
| Segmentation |
|
Table of Contents
- 1. Introduction
- 1.1. Research Scope
- 1.2. Market Segmentation
- 1.3. Research Methodology
- 1.4. Definitions and Assumptions
- 2. Executive Summary
- 2.1. Introduction
- 3. Market Dynamics
- 3.1. Introduction
- 3.2. Market Drivers
- 3.3. Market Restrains
- 3.4. Market Trends
- 4. Market Factor Analysis
- 4.1. Porters Five Forces
- 4.2. Supply/Value Chain
- 4.3. PESTEL analysis
- 4.4. Market Entropy
- 4.5. Patent/Trademark Analysis
- 5. Global Automotive Mechanical Lidar Analysis, Insights and Forecast, 2020-2032
- 5.1. Market Analysis, Insights and Forecast - by Application
- 5.1.1. Passenger Vehicle
- 5.1.2. Commercial Vehicle
- 5.2. Market Analysis, Insights and Forecast - by Types
- 5.2.1. Fixed
- 5.2.2. Spiral
- 5.3. Market Analysis, Insights and Forecast - by Region
- 5.3.1. North America
- 5.3.2. South America
- 5.3.3. Europe
- 5.3.4. Middle East & Africa
- 5.3.5. Asia Pacific
- 5.1. Market Analysis, Insights and Forecast - by Application
- 6. North America Automotive Mechanical Lidar Analysis, Insights and Forecast, 2020-2032
- 6.1. Market Analysis, Insights and Forecast - by Application
- 6.1.1. Passenger Vehicle
- 6.1.2. Commercial Vehicle
- 6.2. Market Analysis, Insights and Forecast - by Types
- 6.2.1. Fixed
- 6.2.2. Spiral
- 6.1. Market Analysis, Insights and Forecast - by Application
- 7. South America Automotive Mechanical Lidar Analysis, Insights and Forecast, 2020-2032
- 7.1. Market Analysis, Insights and Forecast - by Application
- 7.1.1. Passenger Vehicle
- 7.1.2. Commercial Vehicle
- 7.2. Market Analysis, Insights and Forecast - by Types
- 7.2.1. Fixed
- 7.2.2. Spiral
- 7.1. Market Analysis, Insights and Forecast - by Application
- 8. Europe Automotive Mechanical Lidar Analysis, Insights and Forecast, 2020-2032
- 8.1. Market Analysis, Insights and Forecast - by Application
- 8.1.1. Passenger Vehicle
- 8.1.2. Commercial Vehicle
- 8.2. Market Analysis, Insights and Forecast - by Types
- 8.2.1. Fixed
- 8.2.2. Spiral
- 8.1. Market Analysis, Insights and Forecast - by Application
- 9. Middle East & Africa Automotive Mechanical Lidar Analysis, Insights and Forecast, 2020-2032
- 9.1. Market Analysis, Insights and Forecast - by Application
- 9.1.1. Passenger Vehicle
- 9.1.2. Commercial Vehicle
- 9.2. Market Analysis, Insights and Forecast - by Types
- 9.2.1. Fixed
- 9.2.2. Spiral
- 9.1. Market Analysis, Insights and Forecast - by Application
- 10. Asia Pacific Automotive Mechanical Lidar Analysis, Insights and Forecast, 2020-2032
- 10.1. Market Analysis, Insights and Forecast - by Application
- 10.1.1. Passenger Vehicle
- 10.1.2. Commercial Vehicle
- 10.2. Market Analysis, Insights and Forecast - by Types
- 10.2.1. Fixed
- 10.2.2. Spiral
- 10.1. Market Analysis, Insights and Forecast - by Application
- 11. Competitive Analysis
- 11.1. Global Market Share Analysis 2025
- 11.2. Company Profiles
- 11.2.1 Robert Bosch
- 11.2.1.1. Overview
- 11.2.1.2. Products
- 11.2.1.3. SWOT Analysis
- 11.2.1.4. Recent Developments
- 11.2.1.5. Financials (Based on Availability)
- 11.2.2 Continental
- 11.2.2.1. Overview
- 11.2.2.2. Products
- 11.2.2.3. SWOT Analysis
- 11.2.2.4. Recent Developments
- 11.2.2.5. Financials (Based on Availability)
- 11.2.3 Denso
- 11.2.3.1. Overview
- 11.2.3.2. Products
- 11.2.3.3. SWOT Analysis
- 11.2.3.4. Recent Developments
- 11.2.3.5. Financials (Based on Availability)
- 11.2.4 TE Connectivity
- 11.2.4.1. Overview
- 11.2.4.2. Products
- 11.2.4.3. SWOT Analysis
- 11.2.4.4. Recent Developments
- 11.2.4.5. Financials (Based on Availability)
- 11.2.5 Hella KGaA Hueck
- 11.2.5.1. Overview
- 11.2.5.2. Products
- 11.2.5.3. SWOT Analysis
- 11.2.5.4. Recent Developments
- 11.2.5.5. Financials (Based on Availability)
- 11.2.6 Leddar Tech
- 11.2.6.1. Overview
- 11.2.6.2. Products
- 11.2.6.3. SWOT Analysis
- 11.2.6.4. Recent Developments
- 11.2.6.5. Financials (Based on Availability)
- 11.2.7 Quanergy Systems
- 11.2.7.1. Overview
- 11.2.7.2. Products
- 11.2.7.3. SWOT Analysis
- 11.2.7.4. Recent Developments
- 11.2.7.5. Financials (Based on Availability)
- 11.2.8 Velodyne
- 11.2.8.1. Overview
- 11.2.8.2. Products
- 11.2.8.3. SWOT Analysis
- 11.2.8.4. Recent Developments
- 11.2.8.5. Financials (Based on Availability)
- 11.2.9 Slamtec Co.
- 11.2.9.1. Overview
- 11.2.9.2. Products
- 11.2.9.3. SWOT Analysis
- 11.2.9.4. Recent Developments
- 11.2.9.5. Financials (Based on Availability)
- 11.2.10 Ltd
- 11.2.10.1. Overview
- 11.2.10.2. Products
- 11.2.10.3. SWOT Analysis
- 11.2.10.4. Recent Developments
- 11.2.10.5. Financials (Based on Availability)
- 11.2.11 Robosense Technology Co.
- 11.2.11.1. Overview
- 11.2.11.2. Products
- 11.2.11.3. SWOT Analysis
- 11.2.11.4. Recent Developments
- 11.2.11.5. Financials (Based on Availability)
- 11.2.12 Ltd
- 11.2.12.1. Overview
- 11.2.12.2. Products
- 11.2.12.3. SWOT Analysis
- 11.2.12.4. Recent Developments
- 11.2.12.5. Financials (Based on Availability)
- 11.2.13 Leishen Intelligence System Co.
- 11.2.13.1. Overview
- 11.2.13.2. Products
- 11.2.13.3. SWOT Analysis
- 11.2.13.4. Recent Developments
- 11.2.13.5. Financials (Based on Availability)
- 11.2.14 Ltd
- 11.2.14.1. Overview
- 11.2.14.2. Products
- 11.2.14.3. SWOT Analysis
- 11.2.14.4. Recent Developments
- 11.2.14.5. Financials (Based on Availability)
- 11.2.15 Neuvition Technology Co.
- 11.2.15.1. Overview
- 11.2.15.2. Products
- 11.2.15.3. SWOT Analysis
- 11.2.15.4. Recent Developments
- 11.2.15.5. Financials (Based on Availability)
- 11.2.16 Ltd
- 11.2.16.1. Overview
- 11.2.16.2. Products
- 11.2.16.3. SWOT Analysis
- 11.2.16.4. Recent Developments
- 11.2.16.5. Financials (Based on Availability)
- 11.2.17 Litra Technology Co.
- 11.2.17.1. Overview
- 11.2.17.2. Products
- 11.2.17.3. SWOT Analysis
- 11.2.17.4. Recent Developments
- 11.2.17.5. Financials (Based on Availability)
- 11.2.18 Ltd
- 11.2.18.1. Overview
- 11.2.18.2. Products
- 11.2.18.3. SWOT Analysis
- 11.2.18.4. Recent Developments
- 11.2.18.5. Financials (Based on Availability)
- 11.2.19 Hesai Group
- 11.2.19.1. Overview
- 11.2.19.2. Products
- 11.2.19.3. SWOT Analysis
- 11.2.19.4. Recent Developments
- 11.2.19.5. Financials (Based on Availability)
- 11.2.1 Robert Bosch
List of Figures
- Figure 1: Global Automotive Mechanical Lidar Revenue Breakdown (undefined, %) by Region 2025 & 2033
- Figure 2: Global Automotive Mechanical Lidar Volume Breakdown (K, %) by Region 2025 & 2033
- Figure 3: North America Automotive Mechanical Lidar Revenue (undefined), by Application 2025 & 2033
- Figure 4: North America Automotive Mechanical Lidar Volume (K), by Application 2025 & 2033
- Figure 5: North America Automotive Mechanical Lidar Revenue Share (%), by Application 2025 & 2033
- Figure 6: North America Automotive Mechanical Lidar Volume Share (%), by Application 2025 & 2033
- Figure 7: North America Automotive Mechanical Lidar Revenue (undefined), by Types 2025 & 2033
- Figure 8: North America Automotive Mechanical Lidar Volume (K), by Types 2025 & 2033
- Figure 9: North America Automotive Mechanical Lidar Revenue Share (%), by Types 2025 & 2033
- Figure 10: North America Automotive Mechanical Lidar Volume Share (%), by Types 2025 & 2033
- Figure 11: North America Automotive Mechanical Lidar Revenue (undefined), by Country 2025 & 2033
- Figure 12: North America Automotive Mechanical Lidar Volume (K), by Country 2025 & 2033
- Figure 13: North America Automotive Mechanical Lidar Revenue Share (%), by Country 2025 & 2033
- Figure 14: North America Automotive Mechanical Lidar Volume Share (%), by Country 2025 & 2033
- Figure 15: South America Automotive Mechanical Lidar Revenue (undefined), by Application 2025 & 2033
- Figure 16: South America Automotive Mechanical Lidar Volume (K), by Application 2025 & 2033
- Figure 17: South America Automotive Mechanical Lidar Revenue Share (%), by Application 2025 & 2033
- Figure 18: South America Automotive Mechanical Lidar Volume Share (%), by Application 2025 & 2033
- Figure 19: South America Automotive Mechanical Lidar Revenue (undefined), by Types 2025 & 2033
- Figure 20: South America Automotive Mechanical Lidar Volume (K), by Types 2025 & 2033
- Figure 21: South America Automotive Mechanical Lidar Revenue Share (%), by Types 2025 & 2033
- Figure 22: South America Automotive Mechanical Lidar Volume Share (%), by Types 2025 & 2033
- Figure 23: South America Automotive Mechanical Lidar Revenue (undefined), by Country 2025 & 2033
- Figure 24: South America Automotive Mechanical Lidar Volume (K), by Country 2025 & 2033
- Figure 25: South America Automotive Mechanical Lidar Revenue Share (%), by Country 2025 & 2033
- Figure 26: South America Automotive Mechanical Lidar Volume Share (%), by Country 2025 & 2033
- Figure 27: Europe Automotive Mechanical Lidar Revenue (undefined), by Application 2025 & 2033
- Figure 28: Europe Automotive Mechanical Lidar Volume (K), by Application 2025 & 2033
- Figure 29: Europe Automotive Mechanical Lidar Revenue Share (%), by Application 2025 & 2033
- Figure 30: Europe Automotive Mechanical Lidar Volume Share (%), by Application 2025 & 2033
- Figure 31: Europe Automotive Mechanical Lidar Revenue (undefined), by Types 2025 & 2033
- Figure 32: Europe Automotive Mechanical Lidar Volume (K), by Types 2025 & 2033
- Figure 33: Europe Automotive Mechanical Lidar Revenue Share (%), by Types 2025 & 2033
- Figure 34: Europe Automotive Mechanical Lidar Volume Share (%), by Types 2025 & 2033
- Figure 35: Europe Automotive Mechanical Lidar Revenue (undefined), by Country 2025 & 2033
- Figure 36: Europe Automotive Mechanical Lidar Volume (K), by Country 2025 & 2033
- Figure 37: Europe Automotive Mechanical Lidar Revenue Share (%), by Country 2025 & 2033
- Figure 38: Europe Automotive Mechanical Lidar Volume Share (%), by Country 2025 & 2033
- Figure 39: Middle East & Africa Automotive Mechanical Lidar Revenue (undefined), by Application 2025 & 2033
- Figure 40: Middle East & Africa Automotive Mechanical Lidar Volume (K), by Application 2025 & 2033
- Figure 41: Middle East & Africa Automotive Mechanical Lidar Revenue Share (%), by Application 2025 & 2033
- Figure 42: Middle East & Africa Automotive Mechanical Lidar Volume Share (%), by Application 2025 & 2033
- Figure 43: Middle East & Africa Automotive Mechanical Lidar Revenue (undefined), by Types 2025 & 2033
- Figure 44: Middle East & Africa Automotive Mechanical Lidar Volume (K), by Types 2025 & 2033
- Figure 45: Middle East & Africa Automotive Mechanical Lidar Revenue Share (%), by Types 2025 & 2033
- Figure 46: Middle East & Africa Automotive Mechanical Lidar Volume Share (%), by Types 2025 & 2033
- Figure 47: Middle East & Africa Automotive Mechanical Lidar Revenue (undefined), by Country 2025 & 2033
- Figure 48: Middle East & Africa Automotive Mechanical Lidar Volume (K), by Country 2025 & 2033
- Figure 49: Middle East & Africa Automotive Mechanical Lidar Revenue Share (%), by Country 2025 & 2033
- Figure 50: Middle East & Africa Automotive Mechanical Lidar Volume Share (%), by Country 2025 & 2033
- Figure 51: Asia Pacific Automotive Mechanical Lidar Revenue (undefined), by Application 2025 & 2033
- Figure 52: Asia Pacific Automotive Mechanical Lidar Volume (K), by Application 2025 & 2033
- Figure 53: Asia Pacific Automotive Mechanical Lidar Revenue Share (%), by Application 2025 & 2033
- Figure 54: Asia Pacific Automotive Mechanical Lidar Volume Share (%), by Application 2025 & 2033
- Figure 55: Asia Pacific Automotive Mechanical Lidar Revenue (undefined), by Types 2025 & 2033
- Figure 56: Asia Pacific Automotive Mechanical Lidar Volume (K), by Types 2025 & 2033
- Figure 57: Asia Pacific Automotive Mechanical Lidar Revenue Share (%), by Types 2025 & 2033
- Figure 58: Asia Pacific Automotive Mechanical Lidar Volume Share (%), by Types 2025 & 2033
- Figure 59: Asia Pacific Automotive Mechanical Lidar Revenue (undefined), by Country 2025 & 2033
- Figure 60: Asia Pacific Automotive Mechanical Lidar Volume (K), by Country 2025 & 2033
- Figure 61: Asia Pacific Automotive Mechanical Lidar Revenue Share (%), by Country 2025 & 2033
- Figure 62: Asia Pacific Automotive Mechanical Lidar Volume Share (%), by Country 2025 & 2033
List of Tables
- Table 1: Global Automotive Mechanical Lidar Revenue undefined Forecast, by Application 2020 & 2033
- Table 2: Global Automotive Mechanical Lidar Volume K Forecast, by Application 2020 & 2033
- Table 3: Global Automotive Mechanical Lidar Revenue undefined Forecast, by Types 2020 & 2033
- Table 4: Global Automotive Mechanical Lidar Volume K Forecast, by Types 2020 & 2033
- Table 5: Global Automotive Mechanical Lidar Revenue undefined Forecast, by Region 2020 & 2033
- Table 6: Global Automotive Mechanical Lidar Volume K Forecast, by Region 2020 & 2033
- Table 7: Global Automotive Mechanical Lidar Revenue undefined Forecast, by Application 2020 & 2033
- Table 8: Global Automotive Mechanical Lidar Volume K Forecast, by Application 2020 & 2033
- Table 9: Global Automotive Mechanical Lidar Revenue undefined Forecast, by Types 2020 & 2033
- Table 10: Global Automotive Mechanical Lidar Volume K Forecast, by Types 2020 & 2033
- Table 11: Global Automotive Mechanical Lidar Revenue undefined Forecast, by Country 2020 & 2033
- Table 12: Global Automotive Mechanical Lidar Volume K Forecast, by Country 2020 & 2033
- Table 13: United States Automotive Mechanical Lidar Revenue (undefined) Forecast, by Application 2020 & 2033
- Table 14: United States Automotive Mechanical Lidar Volume (K) Forecast, by Application 2020 & 2033
- Table 15: Canada Automotive Mechanical Lidar Revenue (undefined) Forecast, by Application 2020 & 2033
- Table 16: Canada Automotive Mechanical Lidar Volume (K) Forecast, by Application 2020 & 2033
- Table 17: Mexico Automotive Mechanical Lidar Revenue (undefined) Forecast, by Application 2020 & 2033
- Table 18: Mexico Automotive Mechanical Lidar Volume (K) Forecast, by Application 2020 & 2033
- Table 19: Global Automotive Mechanical Lidar Revenue undefined Forecast, by Application 2020 & 2033
- Table 20: Global Automotive Mechanical Lidar Volume K Forecast, by Application 2020 & 2033
- Table 21: Global Automotive Mechanical Lidar Revenue undefined Forecast, by Types 2020 & 2033
- Table 22: Global Automotive Mechanical Lidar Volume K Forecast, by Types 2020 & 2033
- Table 23: Global Automotive Mechanical Lidar Revenue undefined Forecast, by Country 2020 & 2033
- Table 24: Global Automotive Mechanical Lidar Volume K Forecast, by Country 2020 & 2033
- Table 25: Brazil Automotive Mechanical Lidar Revenue (undefined) Forecast, by Application 2020 & 2033
- Table 26: Brazil Automotive Mechanical Lidar Volume (K) Forecast, by Application 2020 & 2033
- Table 27: Argentina Automotive Mechanical Lidar Revenue (undefined) Forecast, by Application 2020 & 2033
- Table 28: Argentina Automotive Mechanical Lidar Volume (K) Forecast, by Application 2020 & 2033
- Table 29: Rest of South America Automotive Mechanical Lidar Revenue (undefined) Forecast, by Application 2020 & 2033
- Table 30: Rest of South America Automotive Mechanical Lidar Volume (K) Forecast, by Application 2020 & 2033
- Table 31: Global Automotive Mechanical Lidar Revenue undefined Forecast, by Application 2020 & 2033
- Table 32: Global Automotive Mechanical Lidar Volume K Forecast, by Application 2020 & 2033
- Table 33: Global Automotive Mechanical Lidar Revenue undefined Forecast, by Types 2020 & 2033
- Table 34: Global Automotive Mechanical Lidar Volume K Forecast, by Types 2020 & 2033
- Table 35: Global Automotive Mechanical Lidar Revenue undefined Forecast, by Country 2020 & 2033
- Table 36: Global Automotive Mechanical Lidar Volume K Forecast, by Country 2020 & 2033
- Table 37: United Kingdom Automotive Mechanical Lidar Revenue (undefined) Forecast, by Application 2020 & 2033
- Table 38: United Kingdom Automotive Mechanical Lidar Volume (K) Forecast, by Application 2020 & 2033
- Table 39: Germany Automotive Mechanical Lidar Revenue (undefined) Forecast, by Application 2020 & 2033
- Table 40: Germany Automotive Mechanical Lidar Volume (K) Forecast, by Application 2020 & 2033
- Table 41: France Automotive Mechanical Lidar Revenue (undefined) Forecast, by Application 2020 & 2033
- Table 42: France Automotive Mechanical Lidar Volume (K) Forecast, by Application 2020 & 2033
- Table 43: Italy Automotive Mechanical Lidar Revenue (undefined) Forecast, by Application 2020 & 2033
- Table 44: Italy Automotive Mechanical Lidar Volume (K) Forecast, by Application 2020 & 2033
- Table 45: Spain Automotive Mechanical Lidar Revenue (undefined) Forecast, by Application 2020 & 2033
- Table 46: Spain Automotive Mechanical Lidar Volume (K) Forecast, by Application 2020 & 2033
- Table 47: Russia Automotive Mechanical Lidar Revenue (undefined) Forecast, by Application 2020 & 2033
- Table 48: Russia Automotive Mechanical Lidar Volume (K) Forecast, by Application 2020 & 2033
- Table 49: Benelux Automotive Mechanical Lidar Revenue (undefined) Forecast, by Application 2020 & 2033
- Table 50: Benelux Automotive Mechanical Lidar Volume (K) Forecast, by Application 2020 & 2033
- Table 51: Nordics Automotive Mechanical Lidar Revenue (undefined) Forecast, by Application 2020 & 2033
- Table 52: Nordics Automotive Mechanical Lidar Volume (K) Forecast, by Application 2020 & 2033
- Table 53: Rest of Europe Automotive Mechanical Lidar Revenue (undefined) Forecast, by Application 2020 & 2033
- Table 54: Rest of Europe Automotive Mechanical Lidar Volume (K) Forecast, by Application 2020 & 2033
- Table 55: Global Automotive Mechanical Lidar Revenue undefined Forecast, by Application 2020 & 2033
- Table 56: Global Automotive Mechanical Lidar Volume K Forecast, by Application 2020 & 2033
- Table 57: Global Automotive Mechanical Lidar Revenue undefined Forecast, by Types 2020 & 2033
- Table 58: Global Automotive Mechanical Lidar Volume K Forecast, by Types 2020 & 2033
- Table 59: Global Automotive Mechanical Lidar Revenue undefined Forecast, by Country 2020 & 2033
- Table 60: Global Automotive Mechanical Lidar Volume K Forecast, by Country 2020 & 2033
- Table 61: Turkey Automotive Mechanical Lidar Revenue (undefined) Forecast, by Application 2020 & 2033
- Table 62: Turkey Automotive Mechanical Lidar Volume (K) Forecast, by Application 2020 & 2033
- Table 63: Israel Automotive Mechanical Lidar Revenue (undefined) Forecast, by Application 2020 & 2033
- Table 64: Israel Automotive Mechanical Lidar Volume (K) Forecast, by Application 2020 & 2033
- Table 65: GCC Automotive Mechanical Lidar Revenue (undefined) Forecast, by Application 2020 & 2033
- Table 66: GCC Automotive Mechanical Lidar Volume (K) Forecast, by Application 2020 & 2033
- Table 67: North Africa Automotive Mechanical Lidar Revenue (undefined) Forecast, by Application 2020 & 2033
- Table 68: North Africa Automotive Mechanical Lidar Volume (K) Forecast, by Application 2020 & 2033
- Table 69: South Africa Automotive Mechanical Lidar Revenue (undefined) Forecast, by Application 2020 & 2033
- Table 70: South Africa Automotive Mechanical Lidar Volume (K) Forecast, by Application 2020 & 2033
- Table 71: Rest of Middle East & Africa Automotive Mechanical Lidar Revenue (undefined) Forecast, by Application 2020 & 2033
- Table 72: Rest of Middle East & Africa Automotive Mechanical Lidar Volume (K) Forecast, by Application 2020 & 2033
- Table 73: Global Automotive Mechanical Lidar Revenue undefined Forecast, by Application 2020 & 2033
- Table 74: Global Automotive Mechanical Lidar Volume K Forecast, by Application 2020 & 2033
- Table 75: Global Automotive Mechanical Lidar Revenue undefined Forecast, by Types 2020 & 2033
- Table 76: Global Automotive Mechanical Lidar Volume K Forecast, by Types 2020 & 2033
- Table 77: Global Automotive Mechanical Lidar Revenue undefined Forecast, by Country 2020 & 2033
- Table 78: Global Automotive Mechanical Lidar Volume K Forecast, by Country 2020 & 2033
- Table 79: China Automotive Mechanical Lidar Revenue (undefined) Forecast, by Application 2020 & 2033
- Table 80: China Automotive Mechanical Lidar Volume (K) Forecast, by Application 2020 & 2033
- Table 81: India Automotive Mechanical Lidar Revenue (undefined) Forecast, by Application 2020 & 2033
- Table 82: India Automotive Mechanical Lidar Volume (K) Forecast, by Application 2020 & 2033
- Table 83: Japan Automotive Mechanical Lidar Revenue (undefined) Forecast, by Application 2020 & 2033
- Table 84: Japan Automotive Mechanical Lidar Volume (K) Forecast, by Application 2020 & 2033
- Table 85: South Korea Automotive Mechanical Lidar Revenue (undefined) Forecast, by Application 2020 & 2033
- Table 86: South Korea Automotive Mechanical Lidar Volume (K) Forecast, by Application 2020 & 2033
- Table 87: ASEAN Automotive Mechanical Lidar Revenue (undefined) Forecast, by Application 2020 & 2033
- Table 88: ASEAN Automotive Mechanical Lidar Volume (K) Forecast, by Application 2020 & 2033
- Table 89: Oceania Automotive Mechanical Lidar Revenue (undefined) Forecast, by Application 2020 & 2033
- Table 90: Oceania Automotive Mechanical Lidar Volume (K) Forecast, by Application 2020 & 2033
- Table 91: Rest of Asia Pacific Automotive Mechanical Lidar Revenue (undefined) Forecast, by Application 2020 & 2033
- Table 92: Rest of Asia Pacific Automotive Mechanical Lidar Volume (K) Forecast, by Application 2020 & 2033
Frequently Asked Questions
1. What is the projected Compound Annual Growth Rate (CAGR) of the Automotive Mechanical Lidar?
The projected CAGR is approximately 34.2%.
2. Which companies are prominent players in the Automotive Mechanical Lidar?
Key companies in the market include Robert Bosch, Continental, Denso, TE Connectivity, Hella KGaA Hueck, Leddar Tech, Quanergy Systems, Velodyne, Slamtec Co., Ltd, Robosense Technology Co., Ltd, Leishen Intelligence System Co., Ltd, Neuvition Technology Co., Ltd, Litra Technology Co., Ltd, Hesai Group.
3. What are the main segments of the Automotive Mechanical Lidar?
The market segments include Application, Types.
4. Can you provide details about the market size?
The market size is estimated to be USD XXX N/A as of 2022.
5. What are some drivers contributing to market growth?
N/A
6. What are the notable trends driving market growth?
N/A
7. Are there any restraints impacting market growth?
N/A
8. Can you provide examples of recent developments in the market?
N/A
9. What pricing options are available for accessing the report?
Pricing options include single-user, multi-user, and enterprise licenses priced at USD 4350.00, USD 6525.00, and USD 8700.00 respectively.
10. Is the market size provided in terms of value or volume?
The market size is provided in terms of value, measured in N/A and volume, measured in K.
11. Are there any specific market keywords associated with the report?
Yes, the market keyword associated with the report is "Automotive Mechanical Lidar," which aids in identifying and referencing the specific market segment covered.
12. How do I determine which pricing option suits my needs best?
The pricing options vary based on user requirements and access needs. Individual users may opt for single-user licenses, while businesses requiring broader access may choose multi-user or enterprise licenses for cost-effective access to the report.
13. Are there any additional resources or data provided in the Automotive Mechanical Lidar report?
While the report offers comprehensive insights, it's advisable to review the specific contents or supplementary materials provided to ascertain if additional resources or data are available.
14. How can I stay updated on further developments or reports in the Automotive Mechanical Lidar?
To stay informed about further developments, trends, and reports in the Automotive Mechanical Lidar, consider subscribing to industry newsletters, following relevant companies and organizations, or regularly checking reputable industry news sources and publications.
Methodology
Step 1 - Identification of Relevant Samples Size from Population Database


Step 2 - Approaches for Defining Global Market Size (Value, Volume* & Price*)

Note*: In applicable scenarios
Step 3 - Data Sources
Primary Research
- Web Analytics
- Survey Reports
- Research Institute
- Latest Research Reports
- Opinion Leaders
Secondary Research
- Annual Reports
- White Paper
- Latest Press Release
- Industry Association
- Paid Database
- Investor Presentations

Step 4 - Data Triangulation
Involves using different sources of information in order to increase the validity of a study
These sources are likely to be stakeholders in a program - participants, other researchers, program staff, other community members, and so on.
Then we put all data in single framework & apply various statistical tools to find out the dynamic on the market.
During the analysis stage, feedback from the stakeholder groups would be compared to determine areas of agreement as well as areas of divergence