

Key Insights
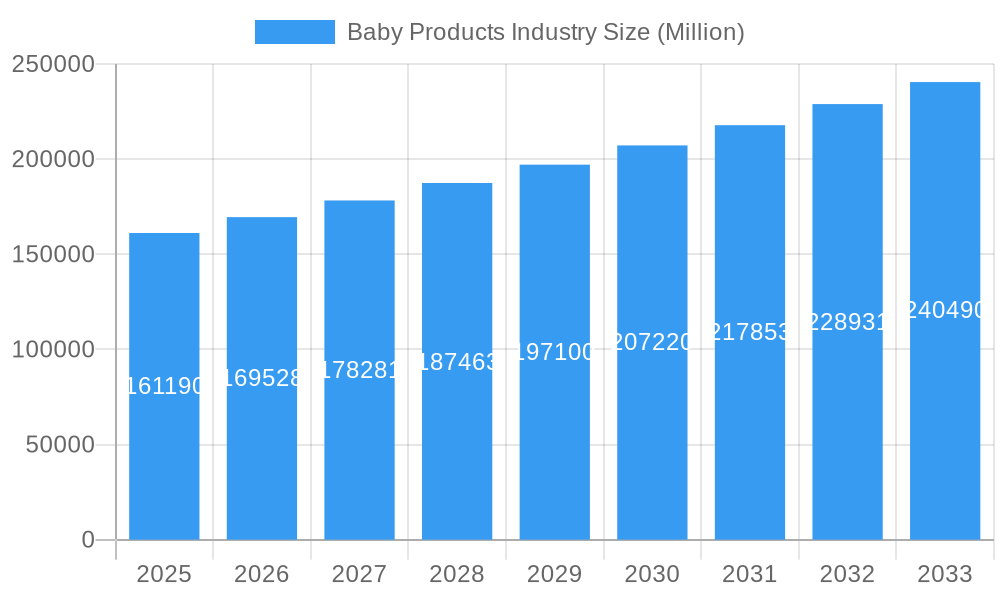
The global baby products market, valued at $161.19 billion in 2025, is projected to experience robust growth, driven by rising birth rates in developing economies and increasing disposable incomes in emerging markets. A Compound Annual Growth Rate (CAGR) of 5.08% from 2025 to 2033 indicates a significant expansion of this market, reaching an estimated $250 billion by 2033. Key growth drivers include a growing preference for premium and specialized baby products, increased awareness of hygiene and health among parents, and the rising adoption of online retail channels. The market segmentation reveals that baby diapers and wipes hold a significant share, followed by baby food and beverages, reflecting the essential nature of these products for newborns and infants. Supermarkets/hypermarkets remain the dominant distribution channel, but online retail is witnessing substantial growth, catering to the evolving consumer preferences for convenience and accessibility. While the market faces certain restraints, such as fluctuating raw material prices and stringent regulatory requirements, the overall growth trajectory remains positive, fueled by continuous innovation in product development and marketing strategies targeting a diverse range of parental needs and preferences.
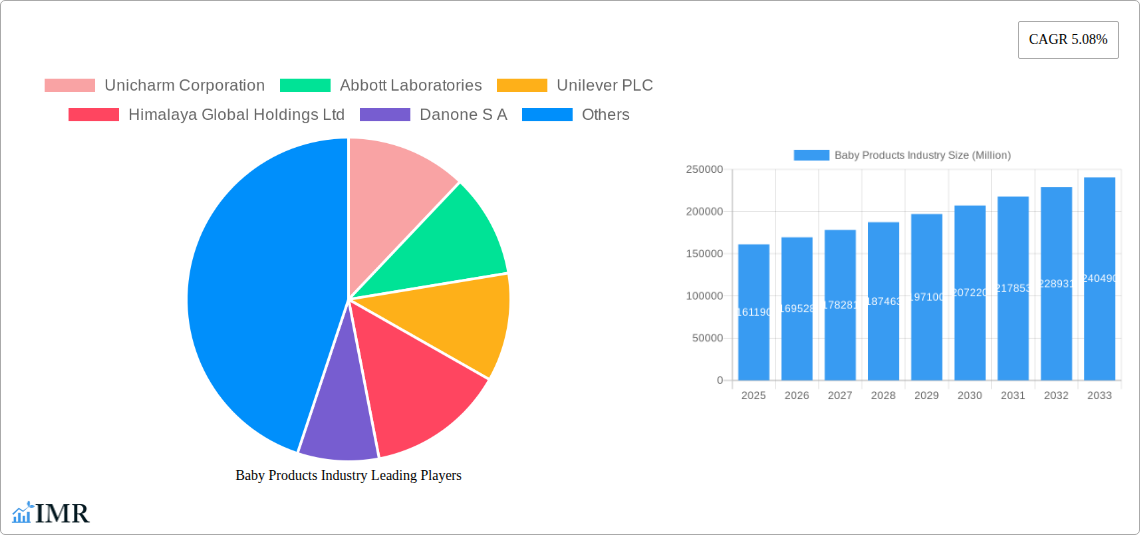
Baby Products Industry Market Size (In Billion)
The competitive landscape is highly consolidated, with major players like Unicharm, Abbott Laboratories, Unilever, and Johnson & Johnson dominating the market. These companies are constantly innovating, introducing eco-friendly products, and focusing on building strong brand loyalty through effective marketing campaigns. Regional variations in market growth are expected, with Asia-Pacific and North America likely to be the largest contributors, driven by factors such as increasing urbanization, rising middle-class populations, and enhanced purchasing power. The market’s growth will be further shaped by evolving consumer preferences towards organic and natural products, an increased demand for personalized baby care solutions, and a growing focus on sustainability within the industry. These trends highlight the opportunity for companies to focus on product differentiation, superior quality, and a strong digital presence to capture a larger share of this expanding market.
Baby Products Industry Company Market Share
Baby Products Industry Market Report: 2019-2033
This comprehensive report provides a detailed analysis of the global baby products industry, encompassing market dynamics, growth trends, key players, and future outlook. Focusing on both the parent (purchasing adults) and child (end-user) markets, this report offers invaluable insights for industry professionals, investors, and stakeholders. The study period covers 2019-2033, with 2025 as the base and estimated year.
Baby Products Industry Market Dynamics & Structure
The baby products market, valued at xx million units in 2024, exhibits a moderately concentrated structure with key players like Procter & Gamble, Johnson & Johnson, and Unilever holding significant market share. Technological innovation, driven by advancements in materials science and absorbent technologies, plays a crucial role. Stringent regulatory frameworks concerning product safety and composition influence market dynamics. Competitive substitutes, including homemade alternatives, also impact market penetration. The end-user demographic, primarily millennial and Gen Z parents, shows a preference for premium, eco-friendly, and convenient products. M&A activity remains moderate, with xx deals recorded in the last five years, primarily focusing on expanding product portfolios and geographical reach.
- Market Concentration: Moderately concentrated, with top 5 players holding xx% market share in 2024.
- Technological Innovation: Focus on improved absorbency, eco-friendly materials, and smart features.
- Regulatory Framework: Stringent safety and labeling regulations vary across regions.
- Competitive Substitutes: Growth of homemade baby food and DIY skincare poses a challenge.
- End-User Demographics: Millennials and Gen Z parents drive demand for premium and convenient options.
- M&A Trends: xx deals in the past 5 years, mainly for portfolio expansion and geographic reach.
Baby Products Industry Growth Trends & Insights
The global baby products market experienced robust growth during the historical period (2019-2024), driven by increasing birth rates in developing economies and rising disposable incomes in many regions. The market size is projected to reach xx million units by 2033, exhibiting a CAGR of xx% during the forecast period (2025-2033). Technological disruptions, such as the introduction of smart baby monitors and connected feeding systems, have significantly influenced consumer behavior. A shift towards premiumization, with parents prioritizing high-quality, natural ingredients and sustainable packaging, is also observed. Market penetration of online retail channels continues to rise, posing both opportunities and challenges for traditional retailers.
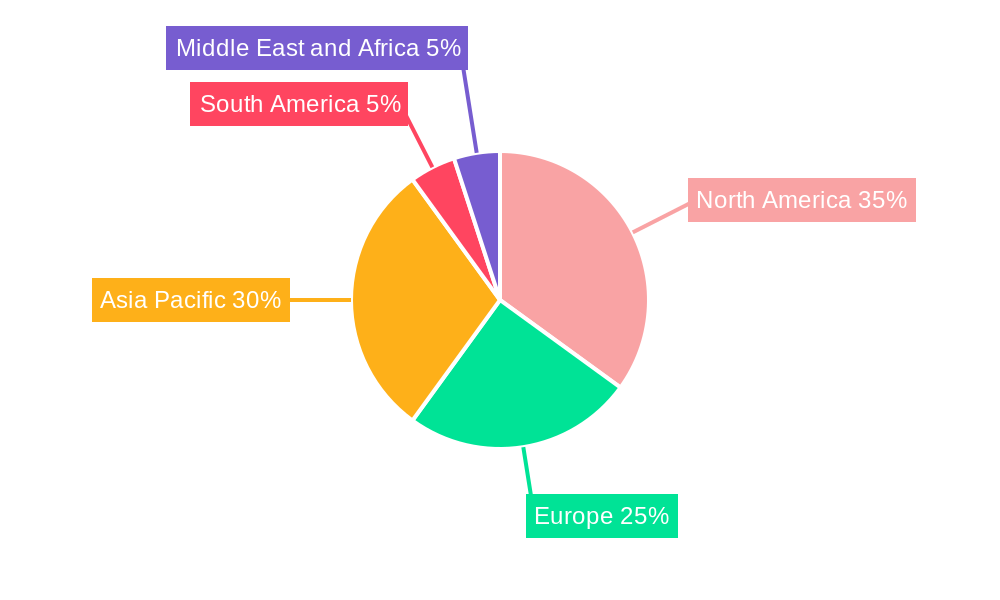
Dominant Regions, Countries, or Segments in Baby Products Industry
North America and Asia Pacific dominate the global baby products market, driven by factors like high birth rates, rising disposable incomes, and increasing awareness of child health and hygiene. Within distribution channels, supermarkets/hypermarkets maintain the largest market share due to their wide reach and established infrastructure. However, online retail channels are rapidly gaining traction, especially amongst younger demographics. In product types, baby diapers and wipes command the largest market share, due to essential nature and high consumption rates.
- Key Regional Drivers: High birth rates in APAC, rising disposable incomes in North America.
- Distribution Channel Dominance: Supermarkets/hypermarkets hold largest market share; online channels rapidly expanding.
- Product Type Leadership: Baby diapers and wipes dominate; followed by baby food and beverages.
Baby Products Industry Product Landscape
Product innovation is a key driver within the baby products industry. Recent years have seen the development of diapers with enhanced absorbency, eco-friendly materials, and features addressing skin sensitivities. Baby food and beverages now focus on organic and natural ingredients with convenient packaging, tailored for different developmental stages. Companies emphasize unique selling propositions like hypoallergenic formulas, improved comfort and fit, and sustainable practices, influencing consumer purchasing decisions.
Key Drivers, Barriers & Challenges in Baby Products Industry
Key Drivers: Increasing birth rates, rising disposable incomes, and heightened awareness of baby health and hygiene are primary drivers. Technological advancements, such as superior absorbent materials, contribute to market growth. Government initiatives promoting child health also play a role.
Key Challenges: Fluctuations in raw material prices, stringent regulatory compliance, intense competition, and supply chain disruptions pose significant challenges. The increasing prevalence of counterfeit products further erodes brand value. These factors could reduce the market growth by xx million units by 2030.
Emerging Opportunities in Baby Products Industry
Untapped markets in developing economies, particularly in Africa and South America, present significant growth opportunities. The increasing demand for organic and sustainable products, coupled with the growing adoption of personalized nutrition, opens doors for innovative product development. Evolving consumer preferences towards convenience, such as subscription services and personalized product recommendations, offer further prospects.
Growth Accelerators in the Baby Products Industry
Technological breakthroughs, including the integration of smart sensors and AI in baby care products, are key growth accelerators. Strategic partnerships between manufacturers and retailers, optimizing distribution channels and enhancing brand visibility, are crucial for accelerated growth. Expansion into new markets and product categories, through diversification and innovation, further fuels market expansion.
Key Players Shaping the Baby Products Industry Market
Notable Milestones in Baby Products Industry Sector
- January 2024: Pampers launched a new Pampers Premium Care Diaper, featuring 360-degree coverage and anti-rash technology.
- January 2024: Procter & Gamble Korea launched Pampers Baby-Dry Pants, emphasizing improved absorbency.
- February 2024: MamyPoko Pants launched Extra Absorb Pants with 30+ patented technologies, claiming up to 60% higher absorbency.
In-Depth Baby Products Industry Market Outlook
The baby products market is poised for continued growth, driven by evolving consumer preferences, technological advancements, and expansion into emerging markets. Strategic partnerships, product diversification, and focus on sustainable and ethically sourced materials will be key to success. The market exhibits significant potential for innovation, especially in personalized baby care solutions and connected devices, paving the way for substantial market expansion in the coming decade.
Baby Products Industry Segmentation
-
1. Product Type
- 1.1. Baby Skin Care
- 1.2. Baby Hair Care
-
1.3. Baby Toiletries
- 1.3.1. Baby Bath Products and Fragrances
- 1.3.2. Baby Diapers and Wipes
- 1.4. Baby Food and Beverages
-
2. Distribution Channel
- 2.1. Supermarkets/Hypermarkets
- 2.2. Convenience Stores
- 2.3. Pharmacies/Drug Stores
- 2.4. Online Retail Stores
- 2.5. Other Distribution Channels
Baby Products Industry Segmentation By Geography
-
1. North America
- 1.1. United States
- 1.2. Canada
- 1.3. Mexico
- 1.4. Rest of North America
-
2. Europe
- 2.1. United Kingdom
- 2.2. Germany
- 2.3. Spain
- 2.4. France
- 2.5. Italy
- 2.6. Russia
- 2.7. Rest of Europe
-
3. Asia Pacific
- 3.1. China
- 3.2. Japan
- 3.3. India
- 3.4. Australia
- 3.5. Rest of Asia Pacific
-
4. South America
- 4.1. Brazil
- 4.2. Argentina
- 4.3. Rest of South America
-
5. Middle East and Africa
- 5.1. South Africa
- 5.2. Saudi Arabia
- 5.3. Rest of Middle East and Africa
Baby Products Industry Regional Market Share
Geographic Coverage of Baby Products Industry
Baby Products Industry REPORT HIGHLIGHTS
| Aspects | Details |
|---|---|
| Study Period | 2020-2034 |
| Base Year | 2025 |
| Estimated Year | 2026 |
| Forecast Period | 2026-2034 |
| Historical Period | 2020-2025 |
| Growth Rate | CAGR of 5.08% from 2020-2034 |
| Segmentation |
|
Table of Contents
- 1. Introduction
- 1.1. Research Scope
- 1.2. Market Segmentation
- 1.3. Research Objective
- 1.4. Definitions and Assumptions
- 2. Executive Summary
- 2.1. Market Snapshot
- 3. Market Dynamics
- 3.1. Market Drivers
- 3.2. Market Restrains
- 3.3. Market Trends
- 3.4. Market Opportunities
- 4. Market Factor Analysis
- 4.1. Porters Five Forces
- 4.1.1. Bargaining Power of Suppliers
- 4.1.2. Bargaining Power of Buyers
- 4.1.3. Threat of New Entrants
- 4.1.4. Threat of Substitutes
- 4.1.5. Competitive Rivalry
- 4.2. PESTEL analysis
- 4.3. BCG Analysis
- 4.3.1. Stars (High Growth, High Market Share)
- 4.3.2. Cash Cows (Low Growth, High Market Share)
- 4.3.3. Question Mark (High Growth, Low Market Share)
- 4.3.4. Dogs (Low Growth, Low Market Share)
- 4.4. Ansoff Matrix Analysis
- 4.5. Supply Chain Analysis
- 4.6. Regulatory Landscape
- 4.7. Current Market Potential and Opportunity Assessment (TAM–SAM–SOM Framework)
- 4.8. IMR Analyst Note
- 4.1. Porters Five Forces
- 5. Market Analysis, Insights and Forecast 2021-2033
- 5.1. Market Analysis, Insights and Forecast - by Product Type
- 5.1.1. Baby Skin Care
- 5.1.2. Baby Hair Care
- 5.1.3. Baby Toiletries
- 5.1.3.1. Baby Bath Products and Fragrances
- 5.1.3.2. Baby Diapers and Wipes
- 5.1.4. Baby Food and Beverages
- 5.2. Market Analysis, Insights and Forecast - by Distribution Channel
- 5.2.1. Supermarkets/Hypermarkets
- 5.2.2. Convenience Stores
- 5.2.3. Pharmacies/Drug Stores
- 5.2.4. Online Retail Stores
- 5.2.5. Other Distribution Channels
- 5.3. Market Analysis, Insights and Forecast - by Region
- 5.3.1. North America
- 5.3.2. Europe
- 5.3.3. Asia Pacific
- 5.3.4. South America
- 5.3.5. Middle East and Africa
- 5.1. Market Analysis, Insights and Forecast - by Product Type
- 6. Global Baby Products Industry Analysis, Insights and Forecast, 2021-2033
- 6.1. Market Analysis, Insights and Forecast - by Product Type
- 6.1.1. Baby Skin Care
- 6.1.2. Baby Hair Care
- 6.1.3. Baby Toiletries
- 6.1.3.1. Baby Bath Products and Fragrances
- 6.1.3.2. Baby Diapers and Wipes
- 6.1.4. Baby Food and Beverages
- 6.2. Market Analysis, Insights and Forecast - by Distribution Channel
- 6.2.1. Supermarkets/Hypermarkets
- 6.2.2. Convenience Stores
- 6.2.3. Pharmacies/Drug Stores
- 6.2.4. Online Retail Stores
- 6.2.5. Other Distribution Channels
- 6.1. Market Analysis, Insights and Forecast - by Product Type
- 7. North America Baby Products Industry Analysis, Insights and Forecast, 2020-2032
- 7.1. Market Analysis, Insights and Forecast - by Product Type
- 7.1.1. Baby Skin Care
- 7.1.2. Baby Hair Care
- 7.1.3. Baby Toiletries
- 7.1.3.1. Baby Bath Products and Fragrances
- 7.1.3.2. Baby Diapers and Wipes
- 7.1.4. Baby Food and Beverages
- 7.2. Market Analysis, Insights and Forecast - by Distribution Channel
- 7.2.1. Supermarkets/Hypermarkets
- 7.2.2. Convenience Stores
- 7.2.3. Pharmacies/Drug Stores
- 7.2.4. Online Retail Stores
- 7.2.5. Other Distribution Channels
- 7.1. Market Analysis, Insights and Forecast - by Product Type
- 8. Europe Baby Products Industry Analysis, Insights and Forecast, 2020-2032
- 8.1. Market Analysis, Insights and Forecast - by Product Type
- 8.1.1. Baby Skin Care
- 8.1.2. Baby Hair Care
- 8.1.3. Baby Toiletries
- 8.1.3.1. Baby Bath Products and Fragrances
- 8.1.3.2. Baby Diapers and Wipes
- 8.1.4. Baby Food and Beverages
- 8.2. Market Analysis, Insights and Forecast - by Distribution Channel
- 8.2.1. Supermarkets/Hypermarkets
- 8.2.2. Convenience Stores
- 8.2.3. Pharmacies/Drug Stores
- 8.2.4. Online Retail Stores
- 8.2.5. Other Distribution Channels
- 8.1. Market Analysis, Insights and Forecast - by Product Type
- 9. Asia Pacific Baby Products Industry Analysis, Insights and Forecast, 2020-2032
- 9.1. Market Analysis, Insights and Forecast - by Product Type
- 9.1.1. Baby Skin Care
- 9.1.2. Baby Hair Care
- 9.1.3. Baby Toiletries
- 9.1.3.1. Baby Bath Products and Fragrances
- 9.1.3.2. Baby Diapers and Wipes
- 9.1.4. Baby Food and Beverages
- 9.2. Market Analysis, Insights and Forecast - by Distribution Channel
- 9.2.1. Supermarkets/Hypermarkets
- 9.2.2. Convenience Stores
- 9.2.3. Pharmacies/Drug Stores
- 9.2.4. Online Retail Stores
- 9.2.5. Other Distribution Channels
- 9.1. Market Analysis, Insights and Forecast - by Product Type
- 10. South America Baby Products Industry Analysis, Insights and Forecast, 2020-2032
- 10.1. Market Analysis, Insights and Forecast - by Product Type
- 10.1.1. Baby Skin Care
- 10.1.2. Baby Hair Care
- 10.1.3. Baby Toiletries
- 10.1.3.1. Baby Bath Products and Fragrances
- 10.1.3.2. Baby Diapers and Wipes
- 10.1.4. Baby Food and Beverages
- 10.2. Market Analysis, Insights and Forecast - by Distribution Channel
- 10.2.1. Supermarkets/Hypermarkets
- 10.2.2. Convenience Stores
- 10.2.3. Pharmacies/Drug Stores
- 10.2.4. Online Retail Stores
- 10.2.5. Other Distribution Channels
- 10.1. Market Analysis, Insights and Forecast - by Product Type
- 11. Middle East and Africa Baby Products Industry Analysis, Insights and Forecast, 2020-2032
- 11.1. Market Analysis, Insights and Forecast - by Product Type
- 11.1.1. Baby Skin Care
- 11.1.2. Baby Hair Care
- 11.1.3. Baby Toiletries
- 11.1.3.1. Baby Bath Products and Fragrances
- 11.1.3.2. Baby Diapers and Wipes
- 11.1.4. Baby Food and Beverages
- 11.2. Market Analysis, Insights and Forecast - by Distribution Channel
- 11.2.1. Supermarkets/Hypermarkets
- 11.2.2. Convenience Stores
- 11.2.3. Pharmacies/Drug Stores
- 11.2.4. Online Retail Stores
- 11.2.5. Other Distribution Channels
- 11.1. Market Analysis, Insights and Forecast - by Product Type
- 12. Competitive Analysis
- 12.1. Company Profiles
- 12.1.1 Unicharm Corporation
- 12.1.1.1. Company Overview
- 12.1.1.2. Products
- 12.1.1.3. Company Financials
- 12.1.1.4. SWOT Analysis
- 12.1.2 Abbott Laboratories
- 12.1.2.1. Company Overview
- 12.1.2.2. Products
- 12.1.2.3. Company Financials
- 12.1.2.4. SWOT Analysis
- 12.1.3 Unilever PLC
- 12.1.3.1. Company Overview
- 12.1.3.2. Products
- 12.1.3.3. Company Financials
- 12.1.3.4. SWOT Analysis
- 12.1.4 Himalaya Global Holdings Ltd
- 12.1.4.1. Company Overview
- 12.1.4.2. Products
- 12.1.4.3. Company Financials
- 12.1.4.4. SWOT Analysis
- 12.1.5 Danone S A
- 12.1.5.1. Company Overview
- 12.1.5.2. Products
- 12.1.5.3. Company Financials
- 12.1.5.4. SWOT Analysis
- 12.1.6 Kimberly-Clark Corporation
- 12.1.6.1. Company Overview
- 12.1.6.2. Products
- 12.1.6.3. Company Financials
- 12.1.6.4. SWOT Analysis
- 12.1.7 Johnson & Johnson
- 12.1.7.1. Company Overview
- 12.1.7.2. Products
- 12.1.7.3. Company Financials
- 12.1.7.4. SWOT Analysis
- 12.1.8 Procter & Gamble Company
- 12.1.8.1. Company Overview
- 12.1.8.2. Products
- 12.1.8.3. Company Financials
- 12.1.8.4. SWOT Analysis
- 12.1.9 Royal Frieslandcampina N V *List Not Exhaustive
- 12.1.9.1. Company Overview
- 12.1.9.2. Products
- 12.1.9.3. Company Financials
- 12.1.9.4. SWOT Analysis
- 12.1.10 Nestlé S A
- 12.1.10.1. Company Overview
- 12.1.10.2. Products
- 12.1.10.3. Company Financials
- 12.1.10.4. SWOT Analysis
- 12.1.1 Unicharm Corporation
- 12.2. Market Entropy
- 12.2.1 Company's Key Areas Served
- 12.2.2 Recent Developments
- 12.3. Company Market Share Analysis 2025
- 12.3.1 Top 5 Companies Market Share Analysis
- 12.3.2 Top 3 Companies Market Share Analysis
- 12.4. List of Potential Customers
- 13. Research Methodology
List of Figures
- Figure 1: Global Baby Products Industry Revenue Breakdown (Million, %) by Region 2025 & 2033
- Figure 2: Global Baby Products Industry Volume Breakdown (K Units, %) by Region 2025 & 2033
- Figure 3: North America Baby Products Industry Revenue (Million), by Product Type 2025 & 2033
- Figure 4: North America Baby Products Industry Volume (K Units), by Product Type 2025 & 2033
- Figure 5: North America Baby Products Industry Revenue Share (%), by Product Type 2025 & 2033
- Figure 6: North America Baby Products Industry Volume Share (%), by Product Type 2025 & 2033
- Figure 7: North America Baby Products Industry Revenue (Million), by Distribution Channel 2025 & 2033
- Figure 8: North America Baby Products Industry Volume (K Units), by Distribution Channel 2025 & 2033
- Figure 9: North America Baby Products Industry Revenue Share (%), by Distribution Channel 2025 & 2033
- Figure 10: North America Baby Products Industry Volume Share (%), by Distribution Channel 2025 & 2033
- Figure 11: North America Baby Products Industry Revenue (Million), by Country 2025 & 2033
- Figure 12: North America Baby Products Industry Volume (K Units), by Country 2025 & 2033
- Figure 13: North America Baby Products Industry Revenue Share (%), by Country 2025 & 2033
- Figure 14: North America Baby Products Industry Volume Share (%), by Country 2025 & 2033
- Figure 15: Europe Baby Products Industry Revenue (Million), by Product Type 2025 & 2033
- Figure 16: Europe Baby Products Industry Volume (K Units), by Product Type 2025 & 2033
- Figure 17: Europe Baby Products Industry Revenue Share (%), by Product Type 2025 & 2033
- Figure 18: Europe Baby Products Industry Volume Share (%), by Product Type 2025 & 2033
- Figure 19: Europe Baby Products Industry Revenue (Million), by Distribution Channel 2025 & 2033
- Figure 20: Europe Baby Products Industry Volume (K Units), by Distribution Channel 2025 & 2033
- Figure 21: Europe Baby Products Industry Revenue Share (%), by Distribution Channel 2025 & 2033
- Figure 22: Europe Baby Products Industry Volume Share (%), by Distribution Channel 2025 & 2033
- Figure 23: Europe Baby Products Industry Revenue (Million), by Country 2025 & 2033
- Figure 24: Europe Baby Products Industry Volume (K Units), by Country 2025 & 2033
- Figure 25: Europe Baby Products Industry Revenue Share (%), by Country 2025 & 2033
- Figure 26: Europe Baby Products Industry Volume Share (%), by Country 2025 & 2033
- Figure 27: Asia Pacific Baby Products Industry Revenue (Million), by Product Type 2025 & 2033
- Figure 28: Asia Pacific Baby Products Industry Volume (K Units), by Product Type 2025 & 2033
- Figure 29: Asia Pacific Baby Products Industry Revenue Share (%), by Product Type 2025 & 2033
- Figure 30: Asia Pacific Baby Products Industry Volume Share (%), by Product Type 2025 & 2033
- Figure 31: Asia Pacific Baby Products Industry Revenue (Million), by Distribution Channel 2025 & 2033
- Figure 32: Asia Pacific Baby Products Industry Volume (K Units), by Distribution Channel 2025 & 2033
- Figure 33: Asia Pacific Baby Products Industry Revenue Share (%), by Distribution Channel 2025 & 2033
- Figure 34: Asia Pacific Baby Products Industry Volume Share (%), by Distribution Channel 2025 & 2033
- Figure 35: Asia Pacific Baby Products Industry Revenue (Million), by Country 2025 & 2033
- Figure 36: Asia Pacific Baby Products Industry Volume (K Units), by Country 2025 & 2033
- Figure 37: Asia Pacific Baby Products Industry Revenue Share (%), by Country 2025 & 2033
- Figure 38: Asia Pacific Baby Products Industry Volume Share (%), by Country 2025 & 2033
- Figure 39: South America Baby Products Industry Revenue (Million), by Product Type 2025 & 2033
- Figure 40: South America Baby Products Industry Volume (K Units), by Product Type 2025 & 2033
- Figure 41: South America Baby Products Industry Revenue Share (%), by Product Type 2025 & 2033
- Figure 42: South America Baby Products Industry Volume Share (%), by Product Type 2025 & 2033
- Figure 43: South America Baby Products Industry Revenue (Million), by Distribution Channel 2025 & 2033
- Figure 44: South America Baby Products Industry Volume (K Units), by Distribution Channel 2025 & 2033
- Figure 45: South America Baby Products Industry Revenue Share (%), by Distribution Channel 2025 & 2033
- Figure 46: South America Baby Products Industry Volume Share (%), by Distribution Channel 2025 & 2033
- Figure 47: South America Baby Products Industry Revenue (Million), by Country 2025 & 2033
- Figure 48: South America Baby Products Industry Volume (K Units), by Country 2025 & 2033
- Figure 49: South America Baby Products Industry Revenue Share (%), by Country 2025 & 2033
- Figure 50: South America Baby Products Industry Volume Share (%), by Country 2025 & 2033
- Figure 51: Middle East and Africa Baby Products Industry Revenue (Million), by Product Type 2025 & 2033
- Figure 52: Middle East and Africa Baby Products Industry Volume (K Units), by Product Type 2025 & 2033
- Figure 53: Middle East and Africa Baby Products Industry Revenue Share (%), by Product Type 2025 & 2033
- Figure 54: Middle East and Africa Baby Products Industry Volume Share (%), by Product Type 2025 & 2033
- Figure 55: Middle East and Africa Baby Products Industry Revenue (Million), by Distribution Channel 2025 & 2033
- Figure 56: Middle East and Africa Baby Products Industry Volume (K Units), by Distribution Channel 2025 & 2033
- Figure 57: Middle East and Africa Baby Products Industry Revenue Share (%), by Distribution Channel 2025 & 2033
- Figure 58: Middle East and Africa Baby Products Industry Volume Share (%), by Distribution Channel 2025 & 2033
- Figure 59: Middle East and Africa Baby Products Industry Revenue (Million), by Country 2025 & 2033
- Figure 60: Middle East and Africa Baby Products Industry Volume (K Units), by Country 2025 & 2033
- Figure 61: Middle East and Africa Baby Products Industry Revenue Share (%), by Country 2025 & 2033
- Figure 62: Middle East and Africa Baby Products Industry Volume Share (%), by Country 2025 & 2033
List of Tables
- Table 1: Global Baby Products Industry Revenue Million Forecast, by Product Type 2020 & 2033
- Table 2: Global Baby Products Industry Volume K Units Forecast, by Product Type 2020 & 2033
- Table 3: Global Baby Products Industry Revenue Million Forecast, by Distribution Channel 2020 & 2033
- Table 4: Global Baby Products Industry Volume K Units Forecast, by Distribution Channel 2020 & 2033
- Table 5: Global Baby Products Industry Revenue Million Forecast, by Region 2020 & 2033
- Table 6: Global Baby Products Industry Volume K Units Forecast, by Region 2020 & 2033
- Table 7: Global Baby Products Industry Revenue Million Forecast, by Product Type 2020 & 2033
- Table 8: Global Baby Products Industry Volume K Units Forecast, by Product Type 2020 & 2033
- Table 9: Global Baby Products Industry Revenue Million Forecast, by Distribution Channel 2020 & 2033
- Table 10: Global Baby Products Industry Volume K Units Forecast, by Distribution Channel 2020 & 2033
- Table 11: Global Baby Products Industry Revenue Million Forecast, by Country 2020 & 2033
- Table 12: Global Baby Products Industry Volume K Units Forecast, by Country 2020 & 2033
- Table 13: United States Baby Products Industry Revenue (Million) Forecast, by Application 2020 & 2033
- Table 14: United States Baby Products Industry Volume (K Units) Forecast, by Application 2020 & 2033
- Table 15: Canada Baby Products Industry Revenue (Million) Forecast, by Application 2020 & 2033
- Table 16: Canada Baby Products Industry Volume (K Units) Forecast, by Application 2020 & 2033
- Table 17: Mexico Baby Products Industry Revenue (Million) Forecast, by Application 2020 & 2033
- Table 18: Mexico Baby Products Industry Volume (K Units) Forecast, by Application 2020 & 2033
- Table 19: Rest of North America Baby Products Industry Revenue (Million) Forecast, by Application 2020 & 2033
- Table 20: Rest of North America Baby Products Industry Volume (K Units) Forecast, by Application 2020 & 2033
- Table 21: Global Baby Products Industry Revenue Million Forecast, by Product Type 2020 & 2033
- Table 22: Global Baby Products Industry Volume K Units Forecast, by Product Type 2020 & 2033
- Table 23: Global Baby Products Industry Revenue Million Forecast, by Distribution Channel 2020 & 2033
- Table 24: Global Baby Products Industry Volume K Units Forecast, by Distribution Channel 2020 & 2033
- Table 25: Global Baby Products Industry Revenue Million Forecast, by Country 2020 & 2033
- Table 26: Global Baby Products Industry Volume K Units Forecast, by Country 2020 & 2033
- Table 27: United Kingdom Baby Products Industry Revenue (Million) Forecast, by Application 2020 & 2033
- Table 28: United Kingdom Baby Products Industry Volume (K Units) Forecast, by Application 2020 & 2033
- Table 29: Germany Baby Products Industry Revenue (Million) Forecast, by Application 2020 & 2033
- Table 30: Germany Baby Products Industry Volume (K Units) Forecast, by Application 2020 & 2033
- Table 31: Spain Baby Products Industry Revenue (Million) Forecast, by Application 2020 & 2033
- Table 32: Spain Baby Products Industry Volume (K Units) Forecast, by Application 2020 & 2033
- Table 33: France Baby Products Industry Revenue (Million) Forecast, by Application 2020 & 2033
- Table 34: France Baby Products Industry Volume (K Units) Forecast, by Application 2020 & 2033
- Table 35: Italy Baby Products Industry Revenue (Million) Forecast, by Application 2020 & 2033
- Table 36: Italy Baby Products Industry Volume (K Units) Forecast, by Application 2020 & 2033
- Table 37: Russia Baby Products Industry Revenue (Million) Forecast, by Application 2020 & 2033
- Table 38: Russia Baby Products Industry Volume (K Units) Forecast, by Application 2020 & 2033
- Table 39: Rest of Europe Baby Products Industry Revenue (Million) Forecast, by Application 2020 & 2033
- Table 40: Rest of Europe Baby Products Industry Volume (K Units) Forecast, by Application 2020 & 2033
- Table 41: Global Baby Products Industry Revenue Million Forecast, by Product Type 2020 & 2033
- Table 42: Global Baby Products Industry Volume K Units Forecast, by Product Type 2020 & 2033
- Table 43: Global Baby Products Industry Revenue Million Forecast, by Distribution Channel 2020 & 2033
- Table 44: Global Baby Products Industry Volume K Units Forecast, by Distribution Channel 2020 & 2033
- Table 45: Global Baby Products Industry Revenue Million Forecast, by Country 2020 & 2033
- Table 46: Global Baby Products Industry Volume K Units Forecast, by Country 2020 & 2033
- Table 47: China Baby Products Industry Revenue (Million) Forecast, by Application 2020 & 2033
- Table 48: China Baby Products Industry Volume (K Units) Forecast, by Application 2020 & 2033
- Table 49: Japan Baby Products Industry Revenue (Million) Forecast, by Application 2020 & 2033
- Table 50: Japan Baby Products Industry Volume (K Units) Forecast, by Application 2020 & 2033
- Table 51: India Baby Products Industry Revenue (Million) Forecast, by Application 2020 & 2033
- Table 52: India Baby Products Industry Volume (K Units) Forecast, by Application 2020 & 2033
- Table 53: Australia Baby Products Industry Revenue (Million) Forecast, by Application 2020 & 2033
- Table 54: Australia Baby Products Industry Volume (K Units) Forecast, by Application 2020 & 2033
- Table 55: Rest of Asia Pacific Baby Products Industry Revenue (Million) Forecast, by Application 2020 & 2033
- Table 56: Rest of Asia Pacific Baby Products Industry Volume (K Units) Forecast, by Application 2020 & 2033
- Table 57: Global Baby Products Industry Revenue Million Forecast, by Product Type 2020 & 2033
- Table 58: Global Baby Products Industry Volume K Units Forecast, by Product Type 2020 & 2033
- Table 59: Global Baby Products Industry Revenue Million Forecast, by Distribution Channel 2020 & 2033
- Table 60: Global Baby Products Industry Volume K Units Forecast, by Distribution Channel 2020 & 2033
- Table 61: Global Baby Products Industry Revenue Million Forecast, by Country 2020 & 2033
- Table 62: Global Baby Products Industry Volume K Units Forecast, by Country 2020 & 2033
- Table 63: Brazil Baby Products Industry Revenue (Million) Forecast, by Application 2020 & 2033
- Table 64: Brazil Baby Products Industry Volume (K Units) Forecast, by Application 2020 & 2033
- Table 65: Argentina Baby Products Industry Revenue (Million) Forecast, by Application 2020 & 2033
- Table 66: Argentina Baby Products Industry Volume (K Units) Forecast, by Application 2020 & 2033
- Table 67: Rest of South America Baby Products Industry Revenue (Million) Forecast, by Application 2020 & 2033
- Table 68: Rest of South America Baby Products Industry Volume (K Units) Forecast, by Application 2020 & 2033
- Table 69: Global Baby Products Industry Revenue Million Forecast, by Product Type 2020 & 2033
- Table 70: Global Baby Products Industry Volume K Units Forecast, by Product Type 2020 & 2033
- Table 71: Global Baby Products Industry Revenue Million Forecast, by Distribution Channel 2020 & 2033
- Table 72: Global Baby Products Industry Volume K Units Forecast, by Distribution Channel 2020 & 2033
- Table 73: Global Baby Products Industry Revenue Million Forecast, by Country 2020 & 2033
- Table 74: Global Baby Products Industry Volume K Units Forecast, by Country 2020 & 2033
- Table 75: South Africa Baby Products Industry Revenue (Million) Forecast, by Application 2020 & 2033
- Table 76: South Africa Baby Products Industry Volume (K Units) Forecast, by Application 2020 & 2033
- Table 77: Saudi Arabia Baby Products Industry Revenue (Million) Forecast, by Application 2020 & 2033
- Table 78: Saudi Arabia Baby Products Industry Volume (K Units) Forecast, by Application 2020 & 2033
- Table 79: Rest of Middle East and Africa Baby Products Industry Revenue (Million) Forecast, by Application 2020 & 2033
- Table 80: Rest of Middle East and Africa Baby Products Industry Volume (K Units) Forecast, by Application 2020 & 2033
Frequently Asked Questions
1. What is the projected Compound Annual Growth Rate (CAGR) of the Baby Products Industry?
The projected CAGR is approximately 5.08%.
2. Which companies are prominent players in the Baby Products Industry?
Key companies in the market include Unicharm Corporation, Abbott Laboratories, Unilever PLC, Himalaya Global Holdings Ltd, Danone S A, Kimberly-Clark Corporation, Johnson & Johnson, Procter & Gamble Company, Royal Frieslandcampina N V *List Not Exhaustive, Nestlé S A.
3. What are the main segments of the Baby Products Industry?
The market segments include Product Type, Distribution Channel.
4. Can you provide details about the market size?
The market size is estimated to be USD 161.19 Million as of 2022.
5. What are some drivers contributing to market growth?
Concerns Among Parents Toward Baby Personal Care and Hygiene; Influence of Endorsements and Aggressive Marketing.
6. What are the notable trends driving market growth?
Increasing Preference for Fortified Baby Food.
7. Are there any restraints impacting market growth?
Presence of Counterfeit Products.
8. Can you provide examples of recent developments in the market?
February 2024: MamyPoko Pants launched Extra Absorb Pants with 30+ patented technologies. The diapers are claimed to be up to 60% absorbent.
9. What pricing options are available for accessing the report?
Pricing options include single-user, multi-user, and enterprise licenses priced at USD 4750, USD 5250, and USD 8750 respectively.
10. Is the market size provided in terms of value or volume?
The market size is provided in terms of value, measured in Million and volume, measured in K Units.
11. Are there any specific market keywords associated with the report?
Yes, the market keyword associated with the report is "Baby Products Industry," which aids in identifying and referencing the specific market segment covered.
12. How do I determine which pricing option suits my needs best?
The pricing options vary based on user requirements and access needs. Individual users may opt for single-user licenses, while businesses requiring broader access may choose multi-user or enterprise licenses for cost-effective access to the report.
13. Are there any additional resources or data provided in the Baby Products Industry report?
While the report offers comprehensive insights, it's advisable to review the specific contents or supplementary materials provided to ascertain if additional resources or data are available.
14. How can I stay updated on further developments or reports in the Baby Products Industry?
To stay informed about further developments, trends, and reports in the Baby Products Industry, consider subscribing to industry newsletters, following relevant companies and organizations, or regularly checking reputable industry news sources and publications.
Methodology
Step 1 - Identification of Relevant Samples Size from Population Database


Step 2 - Approaches for Defining Global Market Size (Value, Volume* & Price*)

Note*: In applicable scenarios
Step 3 - Data Sources
Primary Research
- Web Analytics
- Survey Reports
- Research Institute
- Latest Research Reports
- Opinion Leaders
Secondary Research
- Annual Reports
- White Paper
- Latest Press Release
- Industry Association
- Paid Database
- Investor Presentations

Step 4 - Data Triangulation
Involves using different sources of information in order to increase the validity of a study
These sources are likely to be stakeholders in a program - participants, other researchers, program staff, other community members, and so on.
Then we put all data in single framework & apply various statistical tools to find out the dynamic on the market.
During the analysis stage, feedback from the stakeholder groups would be compared to determine areas of agreement as well as areas of divergence