

Key Insights
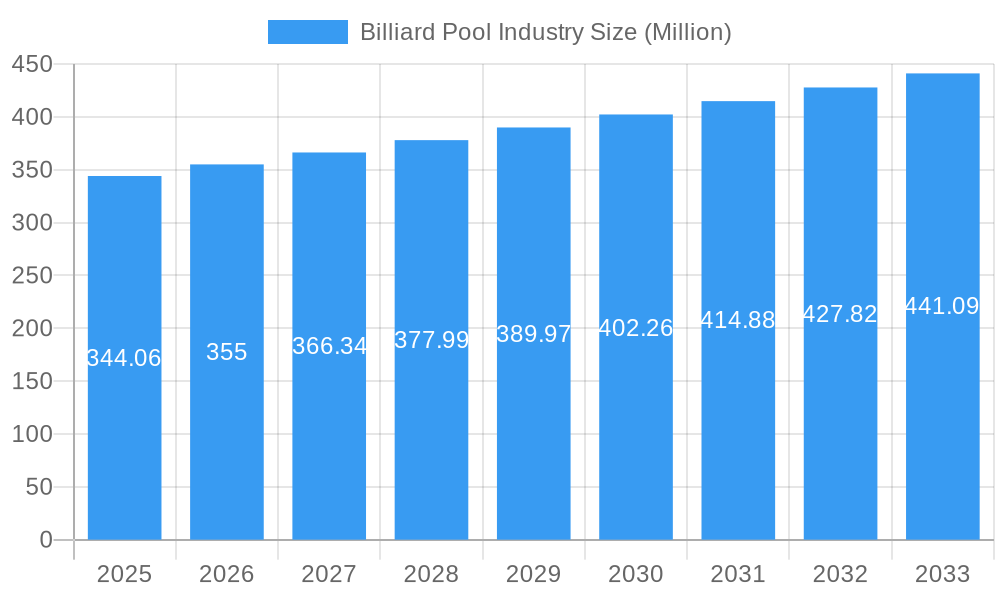
The global billiard pool industry, valued at $344.06 million in 2025, is projected to experience steady growth, driven by several key factors. Increasing disposable incomes in developing economies, coupled with the rising popularity of billiard sports as a recreational activity and competitive sport, are fueling market expansion. The industry's segmentation, encompassing various game types (carom, pool, snooker) and equipment (tables, balls, cues, etc.), provides diverse avenues for growth. The prominence of offline retail stores remains significant, although online retail channels are steadily gaining traction, offering greater convenience and accessibility to a wider customer base. Technological advancements, such as the integration of smart features in billiard tables and the rise of online gaming platforms simulating billiard games, are further contributing to industry evolution. However, the market faces certain restraints, including the relatively high cost of equipment, which can limit accessibility, particularly in price-sensitive markets. Furthermore, the competitive landscape, with established players like Brunswick Corporation and emerging brands, requires consistent innovation and effective marketing strategies for sustained success. Geographical expansion, particularly in Asia-Pacific and other emerging markets, presents substantial growth opportunities. The projected CAGR of 2.93% suggests a consistent, albeit moderate, expansion trajectory over the forecast period (2025-2033). This growth is expected to be driven by a combination of factors, including increased participation in professional and amateur leagues, the development of new game variations and associated equipment, and focused marketing initiatives to appeal to younger demographics.
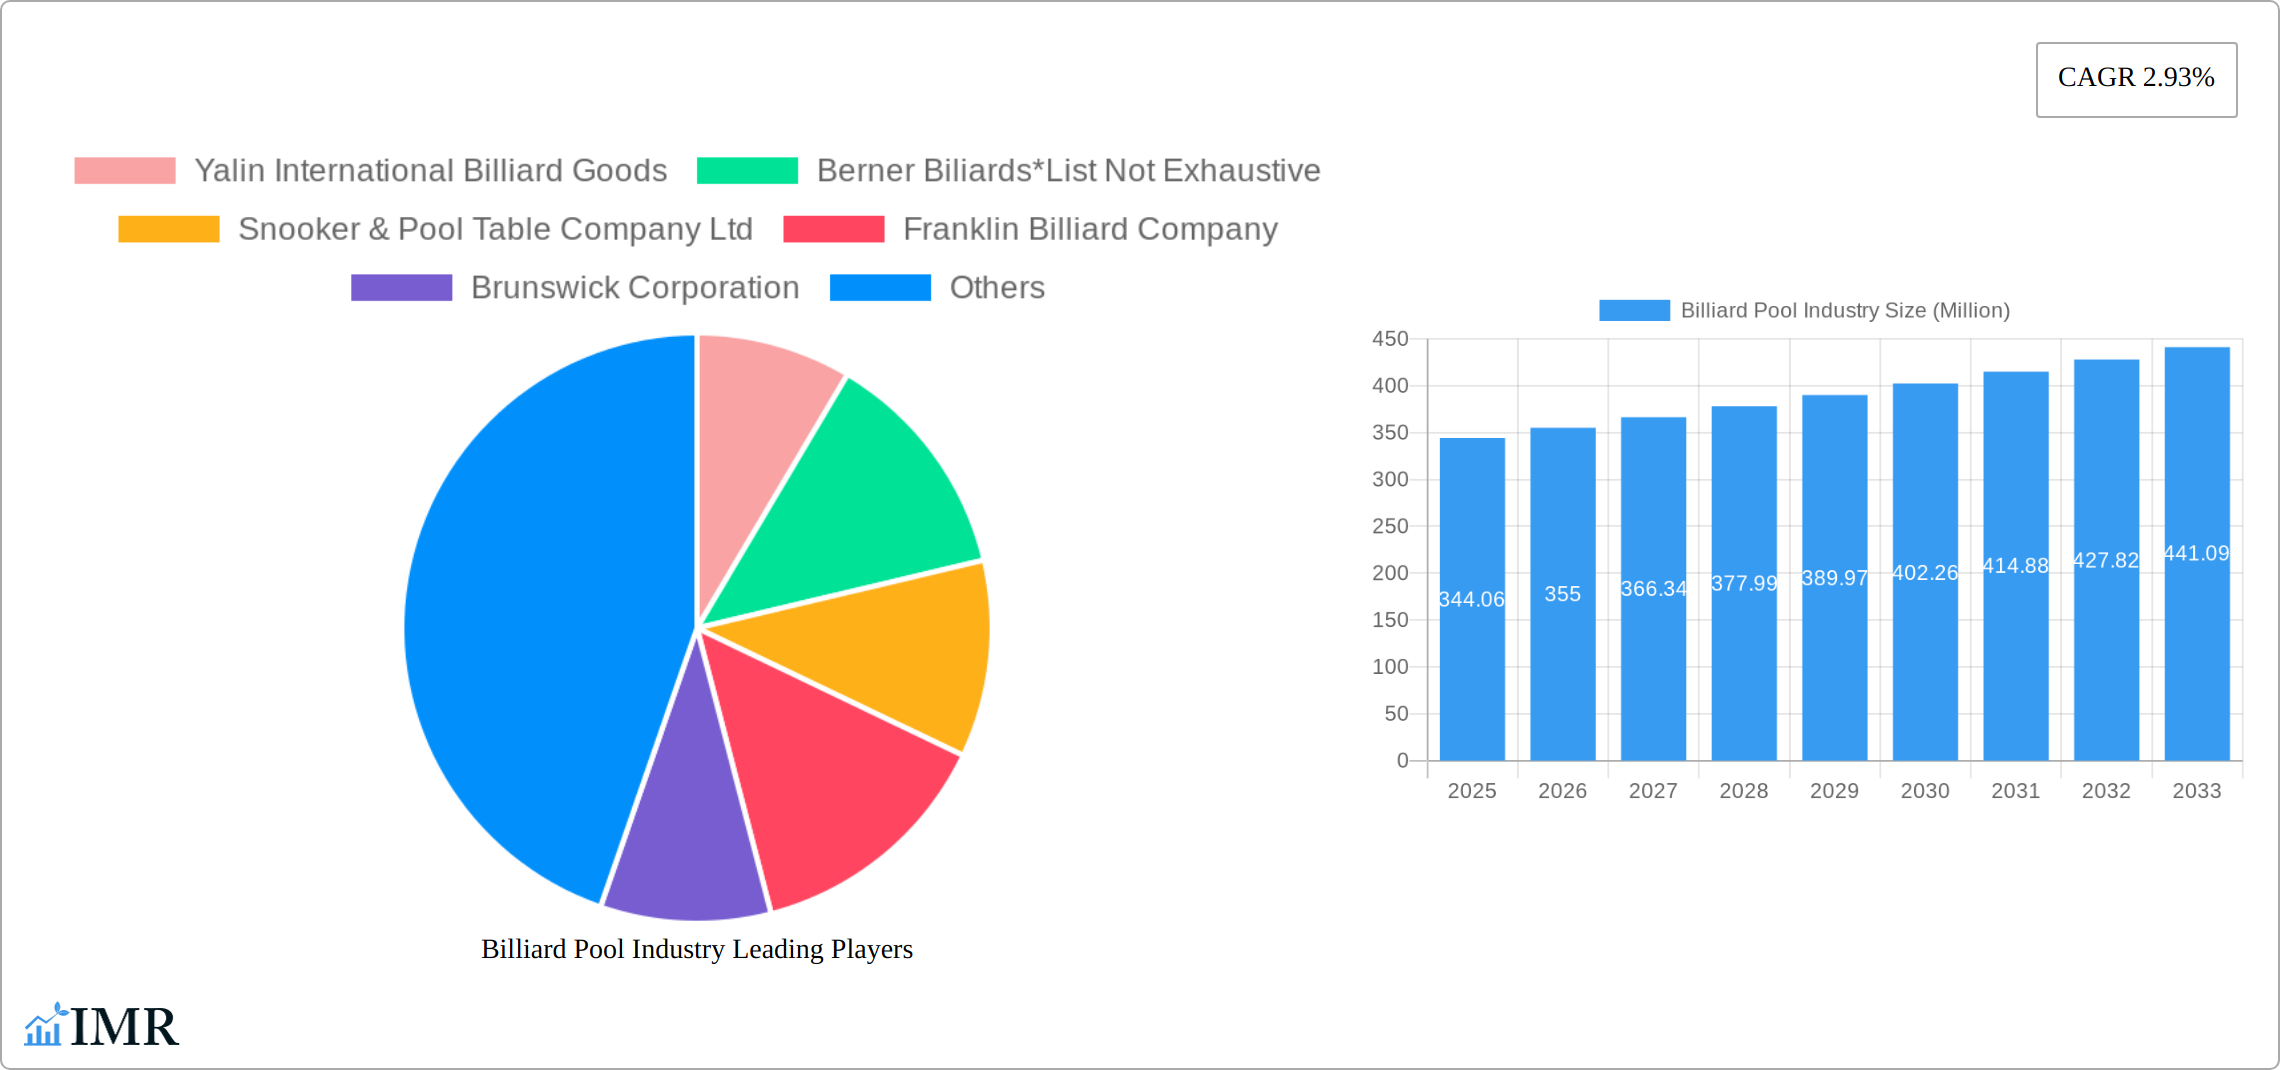
Billiard Pool Industry Market Size (In Million)
The competitive landscape is dynamic, with both large established players and smaller niche businesses vying for market share. Strategic partnerships, acquisitions, and product innovation are crucial for businesses to maintain a competitive edge. Regional variations in market size and growth rates reflect differing levels of economic development, cultural preferences, and the penetration of billiard sports in different regions. North America and Europe currently hold larger market shares, but the Asia-Pacific region is anticipated to demonstrate significant growth potential in the coming years, driven by increasing urbanization and rising middle-class disposable incomes. Future market trends will likely include a stronger focus on high-quality, durable equipment, personalized experiences tailored to individual player needs, and continued technological integration within the sport. An emphasis on sustainability and environmentally friendly manufacturing processes may also gain prominence in the industry.
Billiard Pool Industry Company Market Share
Billiard Pool Industry Market Report: 2019-2033
This comprehensive report provides an in-depth analysis of the Billiard Pool industry, encompassing market dynamics, growth trends, regional performance, product landscape, and key players. The report covers the period 2019-2033, with a focus on the 2025-2033 forecast period and utilizes 2025 as the base year. Market values are presented in millions of units. This report is designed for industry professionals, investors, and anyone seeking a thorough understanding of this dynamic market.
Billiard Pool Industry Market Dynamics & Structure
The billiard pool market, encompassing recreational games and sporting goods (parent markets) and home and commercial entertainment (child markets), displays a moderately concentrated structure with several key players dominating various segments. Technological advancements, particularly in table design and cue technology, are significant growth drivers, alongside evolving consumer preferences and the influence of professional tournaments. Stringent safety and materials regulations impact manufacturing, while the market faces competition from alternative leisure pursuits. Mergers and acquisitions (M&A) activity remains moderate.
- Market Concentration: Moderately concentrated, with the top 10 players holding an estimated X% market share in 2024. (Note: Replace X with the actual percentage.)
- Technological Innovation: Smart tables, advanced cue materials (e.g., carbon fiber, specialized shaft designs), and improved table designs (e.g., enhanced leveling systems, aesthetically pleasing designs) fuel growth. Innovation is challenged by high R&D costs and the need for skilled craftsmanship.
- Regulatory Frameworks: Safety standards for tables and cues, encompassing materials, construction, and stability, directly influence manufacturing processes and material selection. Compliance with these regulations is crucial for market entry and success.
- Competitive Product Substitutes: Video games, other indoor games (e.g., darts, table tennis), and outdoor recreational activities create competitive pressure, demanding continuous innovation and marketing efforts to maintain market share.
- End-User Demographics: Primarily targeting adults, the market also sees a growing segment of younger players drawn to professional pool's competitive aspect and entertainment value. This evolving demographic requires tailored marketing and product strategies.
- M&A Trends: Moderate M&A activity was observed between 2019 and 2024, with approximately Y deals recorded. (Note: Replace Y with the actual number of deals.) This suggests ongoing consolidation and potential shifts in market leadership.
Billiard Pool Industry Growth Trends & Insights
The billiard pool market exhibited steady growth from 2019 to 2024, fueled by rising disposable incomes, increased interest in recreational activities, and the captivating appeal of professional tournaments. The market reached a size of Z million USD in 2024. (Note: Replace Z with the actual market size in USD.) While adoption rates remain relatively stable, technological advancements such as smart tables with integrated scoring, online connectivity, and virtual gameplay are transforming traditional gameplay, potentially accelerating future growth. The shift towards experiential entertainment and a preference for high-quality leisure goods further contributes to market expansion. The projected Compound Annual Growth Rate (CAGR) for 2025-2033 is W%, with the market size expected to reach A million USD by 2033. (Note: Replace W and A with the actual CAGR and projected market size in USD respectively.) Market penetration remains relatively low, with approximately B% of households owning a pool table in developed markets. (Note: Replace B with the actual percentage.)
Dominant Regions, Countries, or Segments in Billiard Pool Industry
North America and Europe historically dominate the billiard pool market due to established infrastructure, higher disposable incomes, and a deeply ingrained billiard sports culture. Pool tables constitute the largest market segment, followed by cues and accessories. While offline retail stores remain the primary distribution channel, online sales are experiencing significant growth, driven by e-commerce platforms and increased online consumer engagement.
- Key Drivers:
- Strong, established billiard culture in North America and Europe, fostering consistent demand.
- High disposable incomes in developed markets provide purchasing power for high-quality equipment and leisure activities.
- Growing popularity of professional billiard tournaments enhances the sport's visibility and attracts new players.
- Dominant Segments:
- Pool tables represent the largest segment, holding approximately C% market share in 2024. (Note: Replace C with the actual percentage.)
- The online retail channel is projected to exhibit the fastest growth, with a CAGR of D% between 2025 and 2033. (Note: Replace D with the actual CAGR.)
Billiard Pool Industry Product Landscape
Recent innovations emphasize enhanced table design incorporating smart technology (e.g., integrated apps, virtual gameplay), ergonomic cues (e.g., improved grip, weight distribution), and improved ball materials (e.g., enhanced durability, consistent playing characteristics). High-end tables with self-leveling mechanisms, integrated scorekeeping, and sophisticated aesthetics cater to the premium market segment. Key performance metrics include table flatness, cue straightness, ball consistency, and overall playing experience. Unique selling propositions hinge on superior craftsmanship, innovative technology integration, and strong brand reputation.
Key Drivers, Barriers & Challenges in Billiard Pool Industry
Key Drivers: Growing disposable incomes, increasing interest in leisure activities, technological advancements (smart tables), and the rise of professional billiard tournaments are key growth drivers.
Key Challenges: High initial investment costs for pool tables and equipment can act as a barrier to entry for some consumers. Supply chain disruptions and material cost increases pose significant challenges to manufacturers. Intense competition among established and emerging players further creates pricing pressures. Furthermore, regulatory hurdles surrounding safety and manufacturing standards also influence the overall market.
Emerging Opportunities in Billiard Pool Industry
Emerging opportunities lie in untapped markets, such as Asia and Latin America, which present significant growth potential. Innovative applications, including augmented reality (AR) and virtual reality (VR) integration, can enhance the gaming experience and broaden the appeal to younger demographics. Customization and personalization options for tables and cues cater to individual preferences and enhance the exclusivity of the product. Moreover, eco-friendly and sustainable manufacturing processes align with evolving consumer preferences for environmentally responsible products.
Growth Accelerators in the Billiard Pool Industry
Technological breakthroughs, such as the integration of smart technologies into billiard tables, will significantly accelerate market growth. Strategic partnerships between manufacturers and retailers, coupled with effective marketing strategies emphasizing the social and recreational aspects of billiards, can broaden market penetration. Expansion into new markets, particularly developing economies, offers substantial growth potential.
Key Players Shaping the Billiard Pool Industry Market
- Yalin International Billiard Goods
- Berner Billiards
- Snooker & Pool Table Company Ltd
- Franklin Billiard Company
- Brunswick Corporation
- H Betti Industries Inc
- Imperial International
- Diamond Billiard Products Inc
- Kaldera Billiards
- Birmingham Billiards Ltd
Notable Milestones in Billiard Pool Industry Sector
- October 2022: Sawyer Twain launched the Nixon Billiards line, featuring innovative table designs.
- May 2022: FCI Billiards opened a new showroom, expanding its retail presence.
- May 2021: Bugatti launched a USD 300,000 luxury pool table, showcasing high-end technology and design.
In-Depth Billiard Pool Industry Market Outlook
The billiard pool market is poised for sustained growth, driven by ongoing technological innovation, market expansion into new regions (e.g., Asia-Pacific), and increasing consumer interest. Strategic opportunities abound in developing premium product lines, expanding online retail channels, optimizing logistics and distribution, and penetrating emerging markets. The long-term outlook remains positive, with considerable potential for market expansion and increased adoption rates. Addressing challenges like affordability and accessibility will be crucial for maximizing market penetration.
Billiard Pool Industry Segmentation
-
1. Type
- 1.1. Carom
- 1.2. Pool
- 1.3. Snooker
-
2. Equipment
- 2.1. Table
- 2.2. Ball
- 2.3. Cue
- 2.4. Other Equipment
-
3. Distribution Channel
- 3.1. Offline Retail Stores
- 3.2. Online Retail Stores
Billiard Pool Industry Segmentation By Geography
-
1. North America
- 1.1. United States
- 1.2. Canada
- 1.3. Mexico
- 1.4. Rest of North America
-
2. Europe
- 2.1. Spain
- 2.2. United Kingdom
- 2.3. Germany
- 2.4. France
- 2.5. Italy
- 2.6. Belgium
- 2.7. Rest of Europe
-
3. Asia Pacific
- 3.1. China
- 3.2. Japan
- 3.3. India
- 3.4. Australia
- 3.5. Rest of Asia Pacific
-
4. South America
- 4.1. Brazil
- 4.2. Argentina
- 4.3. Rest of South America
-
5. Middle East and Africa
- 5.1. South Africa
- 5.2. United Arab Emirates
- 5.3. Rest of Middle East and Africa
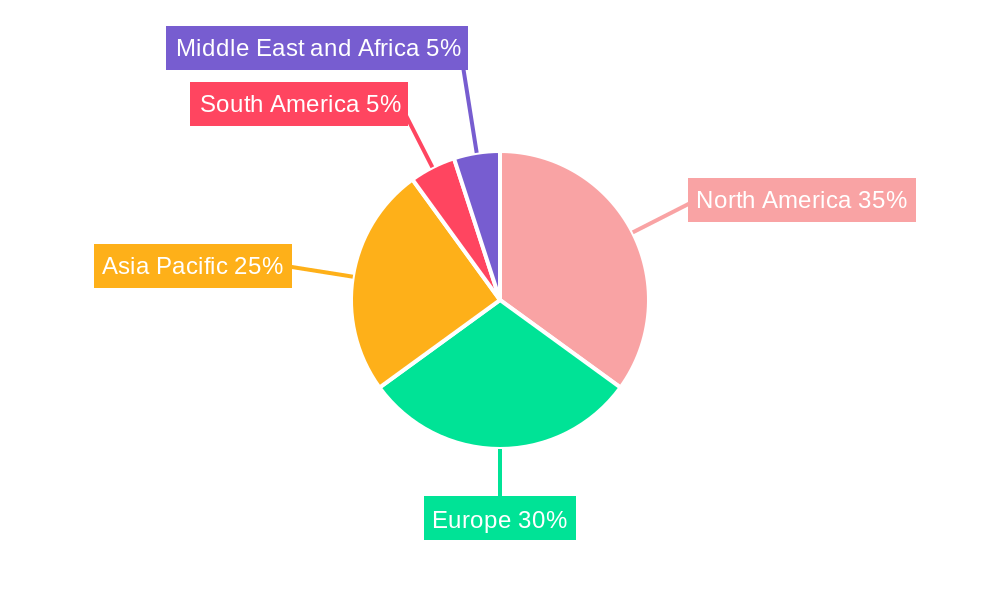
Billiard Pool Industry Regional Market Share
Geographic Coverage of Billiard Pool Industry
Billiard Pool Industry REPORT HIGHLIGHTS
| Aspects | Details |
|---|---|
| Study Period | 2020-2034 |
| Base Year | 2025 |
| Estimated Year | 2026 |
| Forecast Period | 2026-2034 |
| Historical Period | 2020-2025 |
| Growth Rate | CAGR of 2.93% from 2020-2034 |
| Segmentation |
|
Table of Contents
- 1. Introduction
- 1.1. Research Scope
- 1.2. Market Segmentation
- 1.3. Research Objective
- 1.4. Definitions and Assumptions
- 2. Executive Summary
- 2.1. Market Snapshot
- 3. Market Dynamics
- 3.1. Market Drivers
- 3.2. Market Restrains
- 3.3. Market Trends
- 3.4. Market Opportunities
- 4. Market Factor Analysis
- 4.1. Porters Five Forces
- 4.1.1. Bargaining Power of Suppliers
- 4.1.2. Bargaining Power of Buyers
- 4.1.3. Threat of New Entrants
- 4.1.4. Threat of Substitutes
- 4.1.5. Competitive Rivalry
- 4.2. PESTEL analysis
- 4.3. BCG Analysis
- 4.3.1. Stars (High Growth, High Market Share)
- 4.3.2. Cash Cows (Low Growth, High Market Share)
- 4.3.3. Question Mark (High Growth, Low Market Share)
- 4.3.4. Dogs (Low Growth, Low Market Share)
- 4.4. Ansoff Matrix Analysis
- 4.5. Supply Chain Analysis
- 4.6. Regulatory Landscape
- 4.7. Current Market Potential and Opportunity Assessment (TAM–SAM–SOM Framework)
- 4.8. IMR Analyst Note
- 4.1. Porters Five Forces
- 5. Market Analysis, Insights and Forecast 2021-2033
- 5.1. Market Analysis, Insights and Forecast - by Type
- 5.1.1. Carom
- 5.1.2. Pool
- 5.1.3. Snooker
- 5.2. Market Analysis, Insights and Forecast - by Equipment
- 5.2.1. Table
- 5.2.2. Ball
- 5.2.3. Cue
- 5.2.4. Other Equipment
- 5.3. Market Analysis, Insights and Forecast - by Distribution Channel
- 5.3.1. Offline Retail Stores
- 5.3.2. Online Retail Stores
- 5.4. Market Analysis, Insights and Forecast - by Region
- 5.4.1. North America
- 5.4.2. Europe
- 5.4.3. Asia Pacific
- 5.4.4. South America
- 5.4.5. Middle East and Africa
- 5.1. Market Analysis, Insights and Forecast - by Type
- 6. Global Billiard Pool Industry Analysis, Insights and Forecast, 2021-2033
- 6.1. Market Analysis, Insights and Forecast - by Type
- 6.1.1. Carom
- 6.1.2. Pool
- 6.1.3. Snooker
- 6.2. Market Analysis, Insights and Forecast - by Equipment
- 6.2.1. Table
- 6.2.2. Ball
- 6.2.3. Cue
- 6.2.4. Other Equipment
- 6.3. Market Analysis, Insights and Forecast - by Distribution Channel
- 6.3.1. Offline Retail Stores
- 6.3.2. Online Retail Stores
- 6.1. Market Analysis, Insights and Forecast - by Type
- 7. North America Billiard Pool Industry Analysis, Insights and Forecast, 2020-2032
- 7.1. Market Analysis, Insights and Forecast - by Type
- 7.1.1. Carom
- 7.1.2. Pool
- 7.1.3. Snooker
- 7.2. Market Analysis, Insights and Forecast - by Equipment
- 7.2.1. Table
- 7.2.2. Ball
- 7.2.3. Cue
- 7.2.4. Other Equipment
- 7.3. Market Analysis, Insights and Forecast - by Distribution Channel
- 7.3.1. Offline Retail Stores
- 7.3.2. Online Retail Stores
- 7.1. Market Analysis, Insights and Forecast - by Type
- 8. Europe Billiard Pool Industry Analysis, Insights and Forecast, 2020-2032
- 8.1. Market Analysis, Insights and Forecast - by Type
- 8.1.1. Carom
- 8.1.2. Pool
- 8.1.3. Snooker
- 8.2. Market Analysis, Insights and Forecast - by Equipment
- 8.2.1. Table
- 8.2.2. Ball
- 8.2.3. Cue
- 8.2.4. Other Equipment
- 8.3. Market Analysis, Insights and Forecast - by Distribution Channel
- 8.3.1. Offline Retail Stores
- 8.3.2. Online Retail Stores
- 8.1. Market Analysis, Insights and Forecast - by Type
- 9. Asia Pacific Billiard Pool Industry Analysis, Insights and Forecast, 2020-2032
- 9.1. Market Analysis, Insights and Forecast - by Type
- 9.1.1. Carom
- 9.1.2. Pool
- 9.1.3. Snooker
- 9.2. Market Analysis, Insights and Forecast - by Equipment
- 9.2.1. Table
- 9.2.2. Ball
- 9.2.3. Cue
- 9.2.4. Other Equipment
- 9.3. Market Analysis, Insights and Forecast - by Distribution Channel
- 9.3.1. Offline Retail Stores
- 9.3.2. Online Retail Stores
- 9.1. Market Analysis, Insights and Forecast - by Type
- 10. South America Billiard Pool Industry Analysis, Insights and Forecast, 2020-2032
- 10.1. Market Analysis, Insights and Forecast - by Type
- 10.1.1. Carom
- 10.1.2. Pool
- 10.1.3. Snooker
- 10.2. Market Analysis, Insights and Forecast - by Equipment
- 10.2.1. Table
- 10.2.2. Ball
- 10.2.3. Cue
- 10.2.4. Other Equipment
- 10.3. Market Analysis, Insights and Forecast - by Distribution Channel
- 10.3.1. Offline Retail Stores
- 10.3.2. Online Retail Stores
- 10.1. Market Analysis, Insights and Forecast - by Type
- 11. Middle East and Africa Billiard Pool Industry Analysis, Insights and Forecast, 2020-2032
- 11.1. Market Analysis, Insights and Forecast - by Type
- 11.1.1. Carom
- 11.1.2. Pool
- 11.1.3. Snooker
- 11.2. Market Analysis, Insights and Forecast - by Equipment
- 11.2.1. Table
- 11.2.2. Ball
- 11.2.3. Cue
- 11.2.4. Other Equipment
- 11.3. Market Analysis, Insights and Forecast - by Distribution Channel
- 11.3.1. Offline Retail Stores
- 11.3.2. Online Retail Stores
- 11.1. Market Analysis, Insights and Forecast - by Type
- 12. Competitive Analysis
- 12.1. Company Profiles
- 12.1.1 Yalin International Billiard Goods
- 12.1.1.1. Company Overview
- 12.1.1.2. Products
- 12.1.1.3. Company Financials
- 12.1.1.4. SWOT Analysis
- 12.1.2 Berner Biliards*List Not Exhaustive
- 12.1.2.1. Company Overview
- 12.1.2.2. Products
- 12.1.2.3. Company Financials
- 12.1.2.4. SWOT Analysis
- 12.1.3 Snooker & Pool Table Company Ltd
- 12.1.3.1. Company Overview
- 12.1.3.2. Products
- 12.1.3.3. Company Financials
- 12.1.3.4. SWOT Analysis
- 12.1.4 Franklin Billiard Company
- 12.1.4.1. Company Overview
- 12.1.4.2. Products
- 12.1.4.3. Company Financials
- 12.1.4.4. SWOT Analysis
- 12.1.5 Brunswick Corporation
- 12.1.5.1. Company Overview
- 12.1.5.2. Products
- 12.1.5.3. Company Financials
- 12.1.5.4. SWOT Analysis
- 12.1.6 H Betti Industries Inc
- 12.1.6.1. Company Overview
- 12.1.6.2. Products
- 12.1.6.3. Company Financials
- 12.1.6.4. SWOT Analysis
- 12.1.7 Imperial International
- 12.1.7.1. Company Overview
- 12.1.7.2. Products
- 12.1.7.3. Company Financials
- 12.1.7.4. SWOT Analysis
- 12.1.8 Diamond Billiard Products Inc
- 12.1.8.1. Company Overview
- 12.1.8.2. Products
- 12.1.8.3. Company Financials
- 12.1.8.4. SWOT Analysis
- 12.1.9 Kaldera Billiards
- 12.1.9.1. Company Overview
- 12.1.9.2. Products
- 12.1.9.3. Company Financials
- 12.1.9.4. SWOT Analysis
- 12.1.10 Birmingham Billiards Ltd
- 12.1.10.1. Company Overview
- 12.1.10.2. Products
- 12.1.10.3. Company Financials
- 12.1.10.4. SWOT Analysis
- 12.1.1 Yalin International Billiard Goods
- 12.2. Market Entropy
- 12.2.1 Company's Key Areas Served
- 12.2.2 Recent Developments
- 12.3. Company Market Share Analysis 2025
- 12.3.1 Top 5 Companies Market Share Analysis
- 12.3.2 Top 3 Companies Market Share Analysis
- 12.4. List of Potential Customers
- 13. Research Methodology
List of Figures
- Figure 1: Global Billiard Pool Industry Revenue Breakdown (Million, %) by Region 2025 & 2033
- Figure 2: North America Billiard Pool Industry Revenue (Million), by Type 2025 & 2033
- Figure 3: North America Billiard Pool Industry Revenue Share (%), by Type 2025 & 2033
- Figure 4: North America Billiard Pool Industry Revenue (Million), by Equipment 2025 & 2033
- Figure 5: North America Billiard Pool Industry Revenue Share (%), by Equipment 2025 & 2033
- Figure 6: North America Billiard Pool Industry Revenue (Million), by Distribution Channel 2025 & 2033
- Figure 7: North America Billiard Pool Industry Revenue Share (%), by Distribution Channel 2025 & 2033
- Figure 8: North America Billiard Pool Industry Revenue (Million), by Country 2025 & 2033
- Figure 9: North America Billiard Pool Industry Revenue Share (%), by Country 2025 & 2033
- Figure 10: Europe Billiard Pool Industry Revenue (Million), by Type 2025 & 2033
- Figure 11: Europe Billiard Pool Industry Revenue Share (%), by Type 2025 & 2033
- Figure 12: Europe Billiard Pool Industry Revenue (Million), by Equipment 2025 & 2033
- Figure 13: Europe Billiard Pool Industry Revenue Share (%), by Equipment 2025 & 2033
- Figure 14: Europe Billiard Pool Industry Revenue (Million), by Distribution Channel 2025 & 2033
- Figure 15: Europe Billiard Pool Industry Revenue Share (%), by Distribution Channel 2025 & 2033
- Figure 16: Europe Billiard Pool Industry Revenue (Million), by Country 2025 & 2033
- Figure 17: Europe Billiard Pool Industry Revenue Share (%), by Country 2025 & 2033
- Figure 18: Asia Pacific Billiard Pool Industry Revenue (Million), by Type 2025 & 2033
- Figure 19: Asia Pacific Billiard Pool Industry Revenue Share (%), by Type 2025 & 2033
- Figure 20: Asia Pacific Billiard Pool Industry Revenue (Million), by Equipment 2025 & 2033
- Figure 21: Asia Pacific Billiard Pool Industry Revenue Share (%), by Equipment 2025 & 2033
- Figure 22: Asia Pacific Billiard Pool Industry Revenue (Million), by Distribution Channel 2025 & 2033
- Figure 23: Asia Pacific Billiard Pool Industry Revenue Share (%), by Distribution Channel 2025 & 2033
- Figure 24: Asia Pacific Billiard Pool Industry Revenue (Million), by Country 2025 & 2033
- Figure 25: Asia Pacific Billiard Pool Industry Revenue Share (%), by Country 2025 & 2033
- Figure 26: South America Billiard Pool Industry Revenue (Million), by Type 2025 & 2033
- Figure 27: South America Billiard Pool Industry Revenue Share (%), by Type 2025 & 2033
- Figure 28: South America Billiard Pool Industry Revenue (Million), by Equipment 2025 & 2033
- Figure 29: South America Billiard Pool Industry Revenue Share (%), by Equipment 2025 & 2033
- Figure 30: South America Billiard Pool Industry Revenue (Million), by Distribution Channel 2025 & 2033
- Figure 31: South America Billiard Pool Industry Revenue Share (%), by Distribution Channel 2025 & 2033
- Figure 32: South America Billiard Pool Industry Revenue (Million), by Country 2025 & 2033
- Figure 33: South America Billiard Pool Industry Revenue Share (%), by Country 2025 & 2033
- Figure 34: Middle East and Africa Billiard Pool Industry Revenue (Million), by Type 2025 & 2033
- Figure 35: Middle East and Africa Billiard Pool Industry Revenue Share (%), by Type 2025 & 2033
- Figure 36: Middle East and Africa Billiard Pool Industry Revenue (Million), by Equipment 2025 & 2033
- Figure 37: Middle East and Africa Billiard Pool Industry Revenue Share (%), by Equipment 2025 & 2033
- Figure 38: Middle East and Africa Billiard Pool Industry Revenue (Million), by Distribution Channel 2025 & 2033
- Figure 39: Middle East and Africa Billiard Pool Industry Revenue Share (%), by Distribution Channel 2025 & 2033
- Figure 40: Middle East and Africa Billiard Pool Industry Revenue (Million), by Country 2025 & 2033
- Figure 41: Middle East and Africa Billiard Pool Industry Revenue Share (%), by Country 2025 & 2033
List of Tables
- Table 1: Global Billiard Pool Industry Revenue Million Forecast, by Type 2020 & 2033
- Table 2: Global Billiard Pool Industry Revenue Million Forecast, by Equipment 2020 & 2033
- Table 3: Global Billiard Pool Industry Revenue Million Forecast, by Distribution Channel 2020 & 2033
- Table 4: Global Billiard Pool Industry Revenue Million Forecast, by Region 2020 & 2033
- Table 5: Global Billiard Pool Industry Revenue Million Forecast, by Type 2020 & 2033
- Table 6: Global Billiard Pool Industry Revenue Million Forecast, by Equipment 2020 & 2033
- Table 7: Global Billiard Pool Industry Revenue Million Forecast, by Distribution Channel 2020 & 2033
- Table 8: Global Billiard Pool Industry Revenue Million Forecast, by Country 2020 & 2033
- Table 9: United States Billiard Pool Industry Revenue (Million) Forecast, by Application 2020 & 2033
- Table 10: Canada Billiard Pool Industry Revenue (Million) Forecast, by Application 2020 & 2033
- Table 11: Mexico Billiard Pool Industry Revenue (Million) Forecast, by Application 2020 & 2033
- Table 12: Rest of North America Billiard Pool Industry Revenue (Million) Forecast, by Application 2020 & 2033
- Table 13: Global Billiard Pool Industry Revenue Million Forecast, by Type 2020 & 2033
- Table 14: Global Billiard Pool Industry Revenue Million Forecast, by Equipment 2020 & 2033
- Table 15: Global Billiard Pool Industry Revenue Million Forecast, by Distribution Channel 2020 & 2033
- Table 16: Global Billiard Pool Industry Revenue Million Forecast, by Country 2020 & 2033
- Table 17: Spain Billiard Pool Industry Revenue (Million) Forecast, by Application 2020 & 2033
- Table 18: United Kingdom Billiard Pool Industry Revenue (Million) Forecast, by Application 2020 & 2033
- Table 19: Germany Billiard Pool Industry Revenue (Million) Forecast, by Application 2020 & 2033
- Table 20: France Billiard Pool Industry Revenue (Million) Forecast, by Application 2020 & 2033
- Table 21: Italy Billiard Pool Industry Revenue (Million) Forecast, by Application 2020 & 2033
- Table 22: Belgium Billiard Pool Industry Revenue (Million) Forecast, by Application 2020 & 2033
- Table 23: Rest of Europe Billiard Pool Industry Revenue (Million) Forecast, by Application 2020 & 2033
- Table 24: Global Billiard Pool Industry Revenue Million Forecast, by Type 2020 & 2033
- Table 25: Global Billiard Pool Industry Revenue Million Forecast, by Equipment 2020 & 2033
- Table 26: Global Billiard Pool Industry Revenue Million Forecast, by Distribution Channel 2020 & 2033
- Table 27: Global Billiard Pool Industry Revenue Million Forecast, by Country 2020 & 2033
- Table 28: China Billiard Pool Industry Revenue (Million) Forecast, by Application 2020 & 2033
- Table 29: Japan Billiard Pool Industry Revenue (Million) Forecast, by Application 2020 & 2033
- Table 30: India Billiard Pool Industry Revenue (Million) Forecast, by Application 2020 & 2033
- Table 31: Australia Billiard Pool Industry Revenue (Million) Forecast, by Application 2020 & 2033
- Table 32: Rest of Asia Pacific Billiard Pool Industry Revenue (Million) Forecast, by Application 2020 & 2033
- Table 33: Global Billiard Pool Industry Revenue Million Forecast, by Type 2020 & 2033
- Table 34: Global Billiard Pool Industry Revenue Million Forecast, by Equipment 2020 & 2033
- Table 35: Global Billiard Pool Industry Revenue Million Forecast, by Distribution Channel 2020 & 2033
- Table 36: Global Billiard Pool Industry Revenue Million Forecast, by Country 2020 & 2033
- Table 37: Brazil Billiard Pool Industry Revenue (Million) Forecast, by Application 2020 & 2033
- Table 38: Argentina Billiard Pool Industry Revenue (Million) Forecast, by Application 2020 & 2033
- Table 39: Rest of South America Billiard Pool Industry Revenue (Million) Forecast, by Application 2020 & 2033
- Table 40: Global Billiard Pool Industry Revenue Million Forecast, by Type 2020 & 2033
- Table 41: Global Billiard Pool Industry Revenue Million Forecast, by Equipment 2020 & 2033
- Table 42: Global Billiard Pool Industry Revenue Million Forecast, by Distribution Channel 2020 & 2033
- Table 43: Global Billiard Pool Industry Revenue Million Forecast, by Country 2020 & 2033
- Table 44: South Africa Billiard Pool Industry Revenue (Million) Forecast, by Application 2020 & 2033
- Table 45: United Arab Emirates Billiard Pool Industry Revenue (Million) Forecast, by Application 2020 & 2033
- Table 46: Rest of Middle East and Africa Billiard Pool Industry Revenue (Million) Forecast, by Application 2020 & 2033
Frequently Asked Questions
1. What is the projected Compound Annual Growth Rate (CAGR) of the Billiard Pool Industry?
The projected CAGR is approximately 2.93%.
2. Which companies are prominent players in the Billiard Pool Industry?
Key companies in the market include Yalin International Billiard Goods, Berner Biliards*List Not Exhaustive, Snooker & Pool Table Company Ltd, Franklin Billiard Company, Brunswick Corporation, H Betti Industries Inc, Imperial International, Diamond Billiard Products Inc, Kaldera Billiards, Birmingham Billiards Ltd.
3. What are the main segments of the Billiard Pool Industry?
The market segments include Type, Equipment, Distribution Channel.
4. Can you provide details about the market size?
The market size is estimated to be USD 344.06 Million as of 2022.
5. What are some drivers contributing to market growth?
Aggressive Social Media Marketing; Lower-risk Factor Associated with the Use of E-Cigarettes Compared to Conventional/Combustible Cigarettes.
6. What are the notable trends driving market growth?
Increased Sports Participation Propelling the Billiards and Pools Equipment Sales.
7. Are there any restraints impacting market growth?
Government Initiatives to Ban Disposable E-Cigarettes.
8. Can you provide examples of recent developments in the market?
In October 2022, Sawyer Twain launched a new line of Nixon Billiards to the North American market. Featured in the Nixon Billiards line are the Desyn, a mid-century modern table; the prominent Kai table; and the Birdy, a contemporary chic billiards table with a carefully crafted refectory design that stands alone in being the first of its kind with modern tapered rails.
9. What pricing options are available for accessing the report?
Pricing options include single-user, multi-user, and enterprise licenses priced at USD 4750, USD 5250, and USD 8750 respectively.
10. Is the market size provided in terms of value or volume?
The market size is provided in terms of value, measured in Million.
11. Are there any specific market keywords associated with the report?
Yes, the market keyword associated with the report is "Billiard Pool Industry," which aids in identifying and referencing the specific market segment covered.
12. How do I determine which pricing option suits my needs best?
The pricing options vary based on user requirements and access needs. Individual users may opt for single-user licenses, while businesses requiring broader access may choose multi-user or enterprise licenses for cost-effective access to the report.
13. Are there any additional resources or data provided in the Billiard Pool Industry report?
While the report offers comprehensive insights, it's advisable to review the specific contents or supplementary materials provided to ascertain if additional resources or data are available.
14. How can I stay updated on further developments or reports in the Billiard Pool Industry?
To stay informed about further developments, trends, and reports in the Billiard Pool Industry, consider subscribing to industry newsletters, following relevant companies and organizations, or regularly checking reputable industry news sources and publications.
Methodology
Step 1 - Identification of Relevant Samples Size from Population Database


Step 2 - Approaches for Defining Global Market Size (Value, Volume* & Price*)

Note*: In applicable scenarios
Step 3 - Data Sources
Primary Research
- Web Analytics
- Survey Reports
- Research Institute
- Latest Research Reports
- Opinion Leaders
Secondary Research
- Annual Reports
- White Paper
- Latest Press Release
- Industry Association
- Paid Database
- Investor Presentations

Step 4 - Data Triangulation
Involves using different sources of information in order to increase the validity of a study
These sources are likely to be stakeholders in a program - participants, other researchers, program staff, other community members, and so on.
Then we put all data in single framework & apply various statistical tools to find out the dynamic on the market.
During the analysis stage, feedback from the stakeholder groups would be compared to determine areas of agreement as well as areas of divergence