

Key Insights
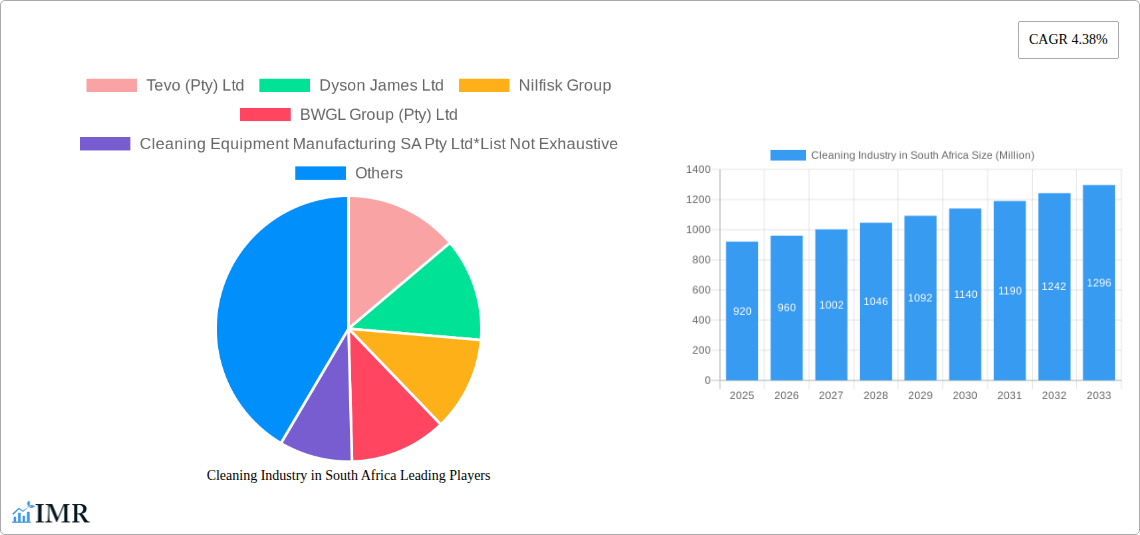
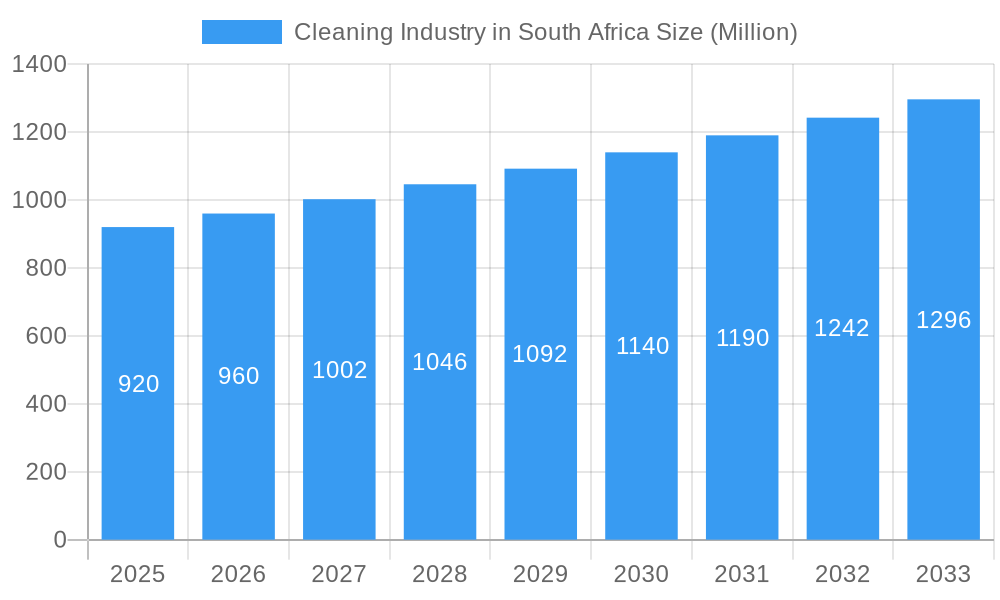
The South African cleaning industry, valued at $0.92 billion in 2025, exhibits robust growth potential, projected to expand at a compound annual growth rate (CAGR) of 4.38% from 2025 to 2033. This growth is fueled by several key factors. Rising urbanization and a burgeoning middle class are driving increased demand for cleaning services in both residential and commercial sectors. The increasing awareness of hygiene and sanitation, particularly post-pandemic, further stimulates market expansion. The commercial and industrial segments are experiencing significant growth, driven by the need for maintaining clean and healthy work environments across various industries. Growth in the online distribution channel is also a significant trend, reflecting changing consumer preferences and the accessibility offered by e-commerce platforms. While the lack of widespread access to sophisticated cleaning equipment in certain regions poses a restraint, the government's focus on improving infrastructure and sanitation is expected to partially offset this limitation. The market is segmented by distribution channel (offline and online), product type (cleaning equipment, consumables like chemicals and powders), and end-user (residential and commercial/industrial). Key players like Tevo (Pty) Ltd, Dyson James Ltd, and Nilfisk Group are actively shaping the market landscape through innovation and expansion strategies. The significant presence of multinational corporations alongside local players underscores the industry’s competitiveness and attractiveness for investment. Future growth is predicted to be further fueled by increasing disposable incomes, government initiatives promoting hygiene, and technological advancements in cleaning solutions. Further analysis reveals that the residential sector, while a significant part of the market, will likely see slower growth compared to the commercial/industrial sector due to the latter’s higher spending capacity and greater need for professional cleaning services.
Cleaning Industry in South Africa Market Size (In Million)
The South African cleaning industry's diverse product portfolio includes cleaning equipment, ranging from basic tools to advanced machinery, and consumables encompassing cleaning chemicals, powders, and gels. The dominance of offline channels reflects the traditional nature of the cleaning supplies retail landscape, but the online channel is showing rapid growth potential, mirroring global trends. Regional variations in growth are expected, with urban centers experiencing faster expansion compared to rural areas. However, government initiatives focused on improving sanitation in less developed regions will contribute to market penetration. This expansion presents opportunities for both established players and new entrants, particularly those offering innovative and sustainable cleaning solutions. The sector benefits from a growing awareness of environmental concerns and the demand for eco-friendly products. This creates an opportunity for companies to focus on sustainable and biodegradable cleaning solutions, further contributing to market growth in the coming years.
Cleaning Industry in South Africa Company Market Share
Cleaning Industry in South Africa: Market Report 2019-2033
This comprehensive report provides an in-depth analysis of the South African cleaning industry, encompassing market dynamics, growth trends, key players, and future outlook. With a focus on both the parent market (Cleaning Products & Services) and its child segments (Cleaning Equipment and Consumables), this report offers invaluable insights for industry professionals, investors, and strategic decision-makers. The study period covers 2019-2033, with a base year of 2025 and a forecast period of 2025-2033. Market values are presented in million units.
Cleaning Industry in South Africa Market Dynamics & Structure
The South African cleaning industry is a dynamic market characterized by a mix of large multinational corporations and smaller, specialized businesses. Market concentration is moderate, with a few dominant players holding significant market share (estimated at xx% combined in 2025). Technological innovation is a key driver, particularly in areas like robotic cleaning and eco-friendly formulations. Regulatory frameworks, including those concerning chemical safety and waste disposal, significantly influence industry practices. The market faces competition from product substitutes, such as self-cleaning surfaces and automated systems. End-user demographics are diverse, ranging from residential consumers to large commercial and industrial entities. M&A activity has been moderate in recent years, with approximately xx deals recorded between 2019 and 2024.
- Market Concentration: Moderate, with top players holding xx% market share (2025 est.).
- Technological Innovation: Focus on robotics, eco-friendly products, and smart cleaning solutions.
- Regulatory Landscape: Stringent regulations regarding chemical safety and waste management.
- Competitive Substitutes: Self-cleaning technologies and automated systems pose a challenge.
- End-User Demographics: Diverse, encompassing residential, commercial, and industrial sectors.
- M&A Activity: Approximately xx deals between 2019 and 2024 (est.).
Cleaning Industry in South Africa Growth Trends & Insights
The South African cleaning industry exhibits steady growth, driven by factors such as increasing urbanization, rising disposable incomes, and heightened awareness of hygiene. The market size reached an estimated ZAR xx million in 2025 and is projected to grow at a CAGR of xx% from 2025 to 2033, reaching ZAR xx million by 2033. Adoption rates of advanced cleaning technologies are gradually increasing, although penetration remains relatively low in certain segments. Consumer behavior is shifting towards more eco-conscious and sustainable cleaning solutions.
(XXX refers to data sources and methodologies used – this section requires specific data to be filled in.)
Dominant Regions, Countries, or Segments in Cleaning Industry in South Africa
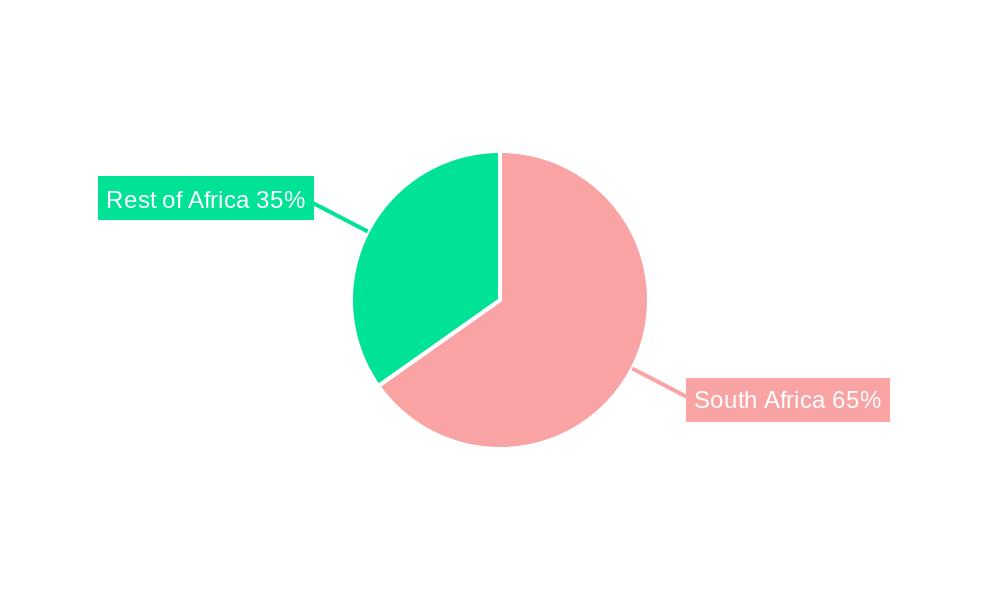
The Gauteng province dominates the South African cleaning market due to its high concentration of commercial and industrial activities. The online channel segment is experiencing faster growth compared to the offline channel, driven by increased e-commerce penetration. Within product types, cleaning equipment maintains a larger market share than other cleaning equipment (consumables, chemicals, powders, and gels), but the consumables segment is exhibiting high growth potential. The commercial/industrial end-user segment accounts for a larger proportion of the market than the residential segment due to higher cleaning needs and budgets.
- Key Drivers: Urbanization, rising disposable incomes, increasing hygiene awareness, and government initiatives.
- Gauteng Dominance: High concentration of commercial and industrial activities.
- Online Channel Growth: Fueled by e-commerce expansion and consumer convenience.
- Commercial/Industrial Segment: Largest market segment due to higher cleaning requirements.
Cleaning Industry in South Africa Product Landscape
The South African cleaning industry offers a diverse range of products, encompassing traditional cleaning agents and advanced technologies like robotic vacuum cleaners and automated cleaning systems. Product innovation focuses on enhancing efficiency, eco-friendliness, and user experience. Key performance indicators include cleaning efficacy, environmental impact, and cost-effectiveness. Unique selling propositions often revolve around specialized formulations, ergonomic designs, and sustainable packaging.
Key Drivers, Barriers & Challenges in Cleaning Industry in South Africa
Key Drivers: Rising disposable incomes, increasing awareness of hygiene and sanitation, technological advancements in cleaning equipment, and government initiatives promoting environmental sustainability.
Key Challenges: Economic fluctuations impacting consumer spending, competition from informal cleaning services, supply chain disruptions, and regulatory hurdles related to chemical safety and waste management. These factors can reduce market growth by an estimated xx% annually (est.).
Emerging Opportunities in Cleaning Industry in South Africa
Emerging opportunities include the growing demand for eco-friendly cleaning products, the increasing adoption of smart home cleaning technologies, and the expansion of cleaning services into niche markets, such as specialized medical cleaning. Untapped markets exist in rural areas and underserved communities.
Growth Accelerators in the Cleaning Industry in South Africa Industry
Technological innovation, particularly in areas like robotics and AI-powered cleaning solutions, is a key growth accelerator. Strategic partnerships between cleaning product manufacturers and service providers can drive market expansion. Government initiatives promoting sustainable cleaning practices and investment in infrastructure projects can further stimulate market growth.
Key Players Shaping the Cleaning Industry in South Africa Market
- Tevo (Pty) Ltd
- Dyson James Ltd
- Nilfisk Group
- BWGL Group (Pty) Ltd
- Cleaning Equipment Manufacturing SA Pty Ltd
- Chemstrat
- Robert Bosch GmbH
- Alfred Karcher SE & Co KG
- Miele & Cie KG
- Nu-World Holdings Ltd
Notable Milestones in Cleaning Industry in South Africa Sector
- July 2021: Samsung launched the Samsung Jet cordless stick vacuum cleaner with an all-new clean station, enhancing user experience and hygiene.
- October 2021: Unilever SA introduced Sunlight, the world's first dishwashing liquid utilizing captured carbon emissions, highlighting sustainability trends.
- November 2021: BWGL Group (Pty) Ltd launched Lioness, a new range of natural and environmentally friendly cleaning products, capitalizing on the growing demand for sustainable options.
In-Depth Cleaning Industry in South Africa Market Outlook
The South African cleaning industry is poised for continued growth, driven by technological advancements, evolving consumer preferences, and expanding market segments. Strategic opportunities exist in developing innovative, sustainable products, expanding into underserved markets, and leveraging technological advancements to enhance efficiency and customer experience. The market is expected to maintain a strong growth trajectory over the forecast period, presenting significant potential for both established players and new entrants.
Cleaning Industry in South Africa Segmentation
-
1. Product Type
-
1.1. Cleaning Equipment
- 1.1.1. Vaccum Cleaners
- 1.1.2. Steam Cleaners
- 1.1.3. High-Pressure Cleaners
- 1.1.4. Scrubbers/Polishers
- 1.1.5. Other Cleaning Equipement
- 1.2. Consumables
- 1.3. Chemicals, Powders and Gels
-
1.1. Cleaning Equipment
-
2. End User
- 2.1. Residential
- 2.2. Commercial/Industrial
-
3. Distribution Channel
- 3.1. Offline Channel
- 3.2. Online Channel
Cleaning Industry in South Africa Segmentation By Geography
-
1. North America
- 1.1. United States
- 1.2. Canada
- 1.3. Mexico
-
2. South America
- 2.1. Brazil
- 2.2. Argentina
- 2.3. Rest of South America
-
3. Europe
- 3.1. United Kingdom
- 3.2. Germany
- 3.3. France
- 3.4. Italy
- 3.5. Spain
- 3.6. Russia
- 3.7. Benelux
- 3.8. Nordics
- 3.9. Rest of Europe
-
4. Middle East & Africa
- 4.1. Turkey
- 4.2. Israel
- 4.3. GCC
- 4.4. North Africa
- 4.5. South Africa
- 4.6. Rest of Middle East & Africa
-
5. Asia Pacific
- 5.1. China
- 5.2. India
- 5.3. Japan
- 5.4. South Korea
- 5.5. ASEAN
- 5.6. Oceania
- 5.7. Rest of Asia Pacific
Cleaning Industry in South Africa Regional Market Share
Geographic Coverage of Cleaning Industry in South Africa
Cleaning Industry in South Africa REPORT HIGHLIGHTS
| Aspects | Details |
|---|---|
| Study Period | 2020-2034 |
| Base Year | 2025 |
| Estimated Year | 2026 |
| Forecast Period | 2026-2034 |
| Historical Period | 2020-2025 |
| Growth Rate | CAGR of 4.38% from 2020-2034 |
| Segmentation |
|
Table of Contents
- 1. Introduction
- 1.1. Research Scope
- 1.2. Market Segmentation
- 1.3. Research Objective
- 1.4. Definitions and Assumptions
- 2. Executive Summary
- 2.1. Market Snapshot
- 3. Market Dynamics
- 3.1. Market Drivers
- 3.2. Market Restrains
- 3.3. Market Trends
- 3.4. Market Opportunities
- 4. Market Factor Analysis
- 4.1. Porters Five Forces
- 4.1.1. Bargaining Power of Suppliers
- 4.1.2. Bargaining Power of Buyers
- 4.1.3. Threat of New Entrants
- 4.1.4. Threat of Substitutes
- 4.1.5. Competitive Rivalry
- 4.2. PESTEL analysis
- 4.3. BCG Analysis
- 4.3.1. Stars (High Growth, High Market Share)
- 4.3.2. Cash Cows (Low Growth, High Market Share)
- 4.3.3. Question Mark (High Growth, Low Market Share)
- 4.3.4. Dogs (Low Growth, Low Market Share)
- 4.4. Ansoff Matrix Analysis
- 4.5. Supply Chain Analysis
- 4.6. Regulatory Landscape
- 4.7. Current Market Potential and Opportunity Assessment (TAM–SAM–SOM Framework)
- 4.8. IMR Analyst Note
- 4.1. Porters Five Forces
- 5. Market Analysis, Insights and Forecast 2021-2033
- 5.1. Market Analysis, Insights and Forecast - by Product Type
- 5.1.1. Cleaning Equipment
- 5.1.1.1. Vaccum Cleaners
- 5.1.1.2. Steam Cleaners
- 5.1.1.3. High-Pressure Cleaners
- 5.1.1.4. Scrubbers/Polishers
- 5.1.1.5. Other Cleaning Equipement
- 5.1.2. Consumables
- 5.1.3. Chemicals, Powders and Gels
- 5.1.1. Cleaning Equipment
- 5.2. Market Analysis, Insights and Forecast - by End User
- 5.2.1. Residential
- 5.2.2. Commercial/Industrial
- 5.3. Market Analysis, Insights and Forecast - by Distribution Channel
- 5.3.1. Offline Channel
- 5.3.2. Online Channel
- 5.4. Market Analysis, Insights and Forecast - by Region
- 5.4.1. North America
- 5.4.2. South America
- 5.4.3. Europe
- 5.4.4. Middle East & Africa
- 5.4.5. Asia Pacific
- 5.1. Market Analysis, Insights and Forecast - by Product Type
- 6. Global Cleaning Industry in South Africa Analysis, Insights and Forecast, 2021-2033
- 6.1. Market Analysis, Insights and Forecast - by Product Type
- 6.1.1. Cleaning Equipment
- 6.1.1.1. Vaccum Cleaners
- 6.1.1.2. Steam Cleaners
- 6.1.1.3. High-Pressure Cleaners
- 6.1.1.4. Scrubbers/Polishers
- 6.1.1.5. Other Cleaning Equipement
- 6.1.2. Consumables
- 6.1.3. Chemicals, Powders and Gels
- 6.1.1. Cleaning Equipment
- 6.2. Market Analysis, Insights and Forecast - by End User
- 6.2.1. Residential
- 6.2.2. Commercial/Industrial
- 6.3. Market Analysis, Insights and Forecast - by Distribution Channel
- 6.3.1. Offline Channel
- 6.3.2. Online Channel
- 6.1. Market Analysis, Insights and Forecast - by Product Type
- 7. North America Cleaning Industry in South Africa Analysis, Insights and Forecast, 2020-2032
- 7.1. Market Analysis, Insights and Forecast - by Product Type
- 7.1.1. Cleaning Equipment
- 7.1.1.1. Vaccum Cleaners
- 7.1.1.2. Steam Cleaners
- 7.1.1.3. High-Pressure Cleaners
- 7.1.1.4. Scrubbers/Polishers
- 7.1.1.5. Other Cleaning Equipement
- 7.1.2. Consumables
- 7.1.3. Chemicals, Powders and Gels
- 7.1.1. Cleaning Equipment
- 7.2. Market Analysis, Insights and Forecast - by End User
- 7.2.1. Residential
- 7.2.2. Commercial/Industrial
- 7.3. Market Analysis, Insights and Forecast - by Distribution Channel
- 7.3.1. Offline Channel
- 7.3.2. Online Channel
- 7.1. Market Analysis, Insights and Forecast - by Product Type
- 8. South America Cleaning Industry in South Africa Analysis, Insights and Forecast, 2020-2032
- 8.1. Market Analysis, Insights and Forecast - by Product Type
- 8.1.1. Cleaning Equipment
- 8.1.1.1. Vaccum Cleaners
- 8.1.1.2. Steam Cleaners
- 8.1.1.3. High-Pressure Cleaners
- 8.1.1.4. Scrubbers/Polishers
- 8.1.1.5. Other Cleaning Equipement
- 8.1.2. Consumables
- 8.1.3. Chemicals, Powders and Gels
- 8.1.1. Cleaning Equipment
- 8.2. Market Analysis, Insights and Forecast - by End User
- 8.2.1. Residential
- 8.2.2. Commercial/Industrial
- 8.3. Market Analysis, Insights and Forecast - by Distribution Channel
- 8.3.1. Offline Channel
- 8.3.2. Online Channel
- 8.1. Market Analysis, Insights and Forecast - by Product Type
- 9. Europe Cleaning Industry in South Africa Analysis, Insights and Forecast, 2020-2032
- 9.1. Market Analysis, Insights and Forecast - by Product Type
- 9.1.1. Cleaning Equipment
- 9.1.1.1. Vaccum Cleaners
- 9.1.1.2. Steam Cleaners
- 9.1.1.3. High-Pressure Cleaners
- 9.1.1.4. Scrubbers/Polishers
- 9.1.1.5. Other Cleaning Equipement
- 9.1.2. Consumables
- 9.1.3. Chemicals, Powders and Gels
- 9.1.1. Cleaning Equipment
- 9.2. Market Analysis, Insights and Forecast - by End User
- 9.2.1. Residential
- 9.2.2. Commercial/Industrial
- 9.3. Market Analysis, Insights and Forecast - by Distribution Channel
- 9.3.1. Offline Channel
- 9.3.2. Online Channel
- 9.1. Market Analysis, Insights and Forecast - by Product Type
- 10. Middle East & Africa Cleaning Industry in South Africa Analysis, Insights and Forecast, 2020-2032
- 10.1. Market Analysis, Insights and Forecast - by Product Type
- 10.1.1. Cleaning Equipment
- 10.1.1.1. Vaccum Cleaners
- 10.1.1.2. Steam Cleaners
- 10.1.1.3. High-Pressure Cleaners
- 10.1.1.4. Scrubbers/Polishers
- 10.1.1.5. Other Cleaning Equipement
- 10.1.2. Consumables
- 10.1.3. Chemicals, Powders and Gels
- 10.1.1. Cleaning Equipment
- 10.2. Market Analysis, Insights and Forecast - by End User
- 10.2.1. Residential
- 10.2.2. Commercial/Industrial
- 10.3. Market Analysis, Insights and Forecast - by Distribution Channel
- 10.3.1. Offline Channel
- 10.3.2. Online Channel
- 10.1. Market Analysis, Insights and Forecast - by Product Type
- 11. Asia Pacific Cleaning Industry in South Africa Analysis, Insights and Forecast, 2020-2032
- 11.1. Market Analysis, Insights and Forecast - by Product Type
- 11.1.1. Cleaning Equipment
- 11.1.1.1. Vaccum Cleaners
- 11.1.1.2. Steam Cleaners
- 11.1.1.3. High-Pressure Cleaners
- 11.1.1.4. Scrubbers/Polishers
- 11.1.1.5. Other Cleaning Equipement
- 11.1.2. Consumables
- 11.1.3. Chemicals, Powders and Gels
- 11.1.1. Cleaning Equipment
- 11.2. Market Analysis, Insights and Forecast - by End User
- 11.2.1. Residential
- 11.2.2. Commercial/Industrial
- 11.3. Market Analysis, Insights and Forecast - by Distribution Channel
- 11.3.1. Offline Channel
- 11.3.2. Online Channel
- 11.1. Market Analysis, Insights and Forecast - by Product Type
- 12. Competitive Analysis
- 12.1. Company Profiles
- 12.1.1 Tevo (Pty) Ltd
- 12.1.1.1. Company Overview
- 12.1.1.2. Products
- 12.1.1.3. Company Financials
- 12.1.1.4. SWOT Analysis
- 12.1.2 Dyson James Ltd
- 12.1.2.1. Company Overview
- 12.1.2.2. Products
- 12.1.2.3. Company Financials
- 12.1.2.4. SWOT Analysis
- 12.1.3 Nilfisk Group
- 12.1.3.1. Company Overview
- 12.1.3.2. Products
- 12.1.3.3. Company Financials
- 12.1.3.4. SWOT Analysis
- 12.1.4 BWGL Group (Pty) Ltd
- 12.1.4.1. Company Overview
- 12.1.4.2. Products
- 12.1.4.3. Company Financials
- 12.1.4.4. SWOT Analysis
- 12.1.5 Cleaning Equipment Manufacturing SA Pty Ltd*List Not Exhaustive
- 12.1.5.1. Company Overview
- 12.1.5.2. Products
- 12.1.5.3. Company Financials
- 12.1.5.4. SWOT Analysis
- 12.1.6 Chemstrat
- 12.1.6.1. Company Overview
- 12.1.6.2. Products
- 12.1.6.3. Company Financials
- 12.1.6.4. SWOT Analysis
- 12.1.7 Robert Bosch GmbH
- 12.1.7.1. Company Overview
- 12.1.7.2. Products
- 12.1.7.3. Company Financials
- 12.1.7.4. SWOT Analysis
- 12.1.8 Alfred Karcher SE & Co KG
- 12.1.8.1. Company Overview
- 12.1.8.2. Products
- 12.1.8.3. Company Financials
- 12.1.8.4. SWOT Analysis
- 12.1.9 Miele & Cie KG
- 12.1.9.1. Company Overview
- 12.1.9.2. Products
- 12.1.9.3. Company Financials
- 12.1.9.4. SWOT Analysis
- 12.1.10 Nu-World Holdings Ltd
- 12.1.10.1. Company Overview
- 12.1.10.2. Products
- 12.1.10.3. Company Financials
- 12.1.10.4. SWOT Analysis
- 12.1.1 Tevo (Pty) Ltd
- 12.2. Market Entropy
- 12.2.1 Company's Key Areas Served
- 12.2.2 Recent Developments
- 12.3. Company Market Share Analysis 2025
- 12.3.1 Top 5 Companies Market Share Analysis
- 12.3.2 Top 3 Companies Market Share Analysis
- 12.4. List of Potential Customers
- 13. Research Methodology
List of Figures
- Figure 1: Global Cleaning Industry in South Africa Revenue Breakdown (Million, %) by Region 2025 & 2033
- Figure 2: North America Cleaning Industry in South Africa Revenue (Million), by Product Type 2025 & 2033
- Figure 3: North America Cleaning Industry in South Africa Revenue Share (%), by Product Type 2025 & 2033
- Figure 4: North America Cleaning Industry in South Africa Revenue (Million), by End User 2025 & 2033
- Figure 5: North America Cleaning Industry in South Africa Revenue Share (%), by End User 2025 & 2033
- Figure 6: North America Cleaning Industry in South Africa Revenue (Million), by Distribution Channel 2025 & 2033
- Figure 7: North America Cleaning Industry in South Africa Revenue Share (%), by Distribution Channel 2025 & 2033
- Figure 8: North America Cleaning Industry in South Africa Revenue (Million), by Country 2025 & 2033
- Figure 9: North America Cleaning Industry in South Africa Revenue Share (%), by Country 2025 & 2033
- Figure 10: South America Cleaning Industry in South Africa Revenue (Million), by Product Type 2025 & 2033
- Figure 11: South America Cleaning Industry in South Africa Revenue Share (%), by Product Type 2025 & 2033
- Figure 12: South America Cleaning Industry in South Africa Revenue (Million), by End User 2025 & 2033
- Figure 13: South America Cleaning Industry in South Africa Revenue Share (%), by End User 2025 & 2033
- Figure 14: South America Cleaning Industry in South Africa Revenue (Million), by Distribution Channel 2025 & 2033
- Figure 15: South America Cleaning Industry in South Africa Revenue Share (%), by Distribution Channel 2025 & 2033
- Figure 16: South America Cleaning Industry in South Africa Revenue (Million), by Country 2025 & 2033
- Figure 17: South America Cleaning Industry in South Africa Revenue Share (%), by Country 2025 & 2033
- Figure 18: Europe Cleaning Industry in South Africa Revenue (Million), by Product Type 2025 & 2033
- Figure 19: Europe Cleaning Industry in South Africa Revenue Share (%), by Product Type 2025 & 2033
- Figure 20: Europe Cleaning Industry in South Africa Revenue (Million), by End User 2025 & 2033
- Figure 21: Europe Cleaning Industry in South Africa Revenue Share (%), by End User 2025 & 2033
- Figure 22: Europe Cleaning Industry in South Africa Revenue (Million), by Distribution Channel 2025 & 2033
- Figure 23: Europe Cleaning Industry in South Africa Revenue Share (%), by Distribution Channel 2025 & 2033
- Figure 24: Europe Cleaning Industry in South Africa Revenue (Million), by Country 2025 & 2033
- Figure 25: Europe Cleaning Industry in South Africa Revenue Share (%), by Country 2025 & 2033
- Figure 26: Middle East & Africa Cleaning Industry in South Africa Revenue (Million), by Product Type 2025 & 2033
- Figure 27: Middle East & Africa Cleaning Industry in South Africa Revenue Share (%), by Product Type 2025 & 2033
- Figure 28: Middle East & Africa Cleaning Industry in South Africa Revenue (Million), by End User 2025 & 2033
- Figure 29: Middle East & Africa Cleaning Industry in South Africa Revenue Share (%), by End User 2025 & 2033
- Figure 30: Middle East & Africa Cleaning Industry in South Africa Revenue (Million), by Distribution Channel 2025 & 2033
- Figure 31: Middle East & Africa Cleaning Industry in South Africa Revenue Share (%), by Distribution Channel 2025 & 2033
- Figure 32: Middle East & Africa Cleaning Industry in South Africa Revenue (Million), by Country 2025 & 2033
- Figure 33: Middle East & Africa Cleaning Industry in South Africa Revenue Share (%), by Country 2025 & 2033
- Figure 34: Asia Pacific Cleaning Industry in South Africa Revenue (Million), by Product Type 2025 & 2033
- Figure 35: Asia Pacific Cleaning Industry in South Africa Revenue Share (%), by Product Type 2025 & 2033
- Figure 36: Asia Pacific Cleaning Industry in South Africa Revenue (Million), by End User 2025 & 2033
- Figure 37: Asia Pacific Cleaning Industry in South Africa Revenue Share (%), by End User 2025 & 2033
- Figure 38: Asia Pacific Cleaning Industry in South Africa Revenue (Million), by Distribution Channel 2025 & 2033
- Figure 39: Asia Pacific Cleaning Industry in South Africa Revenue Share (%), by Distribution Channel 2025 & 2033
- Figure 40: Asia Pacific Cleaning Industry in South Africa Revenue (Million), by Country 2025 & 2033
- Figure 41: Asia Pacific Cleaning Industry in South Africa Revenue Share (%), by Country 2025 & 2033
List of Tables
- Table 1: Global Cleaning Industry in South Africa Revenue Million Forecast, by Product Type 2020 & 2033
- Table 2: Global Cleaning Industry in South Africa Revenue Million Forecast, by End User 2020 & 2033
- Table 3: Global Cleaning Industry in South Africa Revenue Million Forecast, by Distribution Channel 2020 & 2033
- Table 4: Global Cleaning Industry in South Africa Revenue Million Forecast, by Region 2020 & 2033
- Table 5: Global Cleaning Industry in South Africa Revenue Million Forecast, by Product Type 2020 & 2033
- Table 6: Global Cleaning Industry in South Africa Revenue Million Forecast, by End User 2020 & 2033
- Table 7: Global Cleaning Industry in South Africa Revenue Million Forecast, by Distribution Channel 2020 & 2033
- Table 8: Global Cleaning Industry in South Africa Revenue Million Forecast, by Country 2020 & 2033
- Table 9: United States Cleaning Industry in South Africa Revenue (Million) Forecast, by Application 2020 & 2033
- Table 10: Canada Cleaning Industry in South Africa Revenue (Million) Forecast, by Application 2020 & 2033
- Table 11: Mexico Cleaning Industry in South Africa Revenue (Million) Forecast, by Application 2020 & 2033
- Table 12: Global Cleaning Industry in South Africa Revenue Million Forecast, by Product Type 2020 & 2033
- Table 13: Global Cleaning Industry in South Africa Revenue Million Forecast, by End User 2020 & 2033
- Table 14: Global Cleaning Industry in South Africa Revenue Million Forecast, by Distribution Channel 2020 & 2033
- Table 15: Global Cleaning Industry in South Africa Revenue Million Forecast, by Country 2020 & 2033
- Table 16: Brazil Cleaning Industry in South Africa Revenue (Million) Forecast, by Application 2020 & 2033
- Table 17: Argentina Cleaning Industry in South Africa Revenue (Million) Forecast, by Application 2020 & 2033
- Table 18: Rest of South America Cleaning Industry in South Africa Revenue (Million) Forecast, by Application 2020 & 2033
- Table 19: Global Cleaning Industry in South Africa Revenue Million Forecast, by Product Type 2020 & 2033
- Table 20: Global Cleaning Industry in South Africa Revenue Million Forecast, by End User 2020 & 2033
- Table 21: Global Cleaning Industry in South Africa Revenue Million Forecast, by Distribution Channel 2020 & 2033
- Table 22: Global Cleaning Industry in South Africa Revenue Million Forecast, by Country 2020 & 2033
- Table 23: United Kingdom Cleaning Industry in South Africa Revenue (Million) Forecast, by Application 2020 & 2033
- Table 24: Germany Cleaning Industry in South Africa Revenue (Million) Forecast, by Application 2020 & 2033
- Table 25: France Cleaning Industry in South Africa Revenue (Million) Forecast, by Application 2020 & 2033
- Table 26: Italy Cleaning Industry in South Africa Revenue (Million) Forecast, by Application 2020 & 2033
- Table 27: Spain Cleaning Industry in South Africa Revenue (Million) Forecast, by Application 2020 & 2033
- Table 28: Russia Cleaning Industry in South Africa Revenue (Million) Forecast, by Application 2020 & 2033
- Table 29: Benelux Cleaning Industry in South Africa Revenue (Million) Forecast, by Application 2020 & 2033
- Table 30: Nordics Cleaning Industry in South Africa Revenue (Million) Forecast, by Application 2020 & 2033
- Table 31: Rest of Europe Cleaning Industry in South Africa Revenue (Million) Forecast, by Application 2020 & 2033
- Table 32: Global Cleaning Industry in South Africa Revenue Million Forecast, by Product Type 2020 & 2033
- Table 33: Global Cleaning Industry in South Africa Revenue Million Forecast, by End User 2020 & 2033
- Table 34: Global Cleaning Industry in South Africa Revenue Million Forecast, by Distribution Channel 2020 & 2033
- Table 35: Global Cleaning Industry in South Africa Revenue Million Forecast, by Country 2020 & 2033
- Table 36: Turkey Cleaning Industry in South Africa Revenue (Million) Forecast, by Application 2020 & 2033
- Table 37: Israel Cleaning Industry in South Africa Revenue (Million) Forecast, by Application 2020 & 2033
- Table 38: GCC Cleaning Industry in South Africa Revenue (Million) Forecast, by Application 2020 & 2033
- Table 39: North Africa Cleaning Industry in South Africa Revenue (Million) Forecast, by Application 2020 & 2033
- Table 40: South Africa Cleaning Industry in South Africa Revenue (Million) Forecast, by Application 2020 & 2033
- Table 41: Rest of Middle East & Africa Cleaning Industry in South Africa Revenue (Million) Forecast, by Application 2020 & 2033
- Table 42: Global Cleaning Industry in South Africa Revenue Million Forecast, by Product Type 2020 & 2033
- Table 43: Global Cleaning Industry in South Africa Revenue Million Forecast, by End User 2020 & 2033
- Table 44: Global Cleaning Industry in South Africa Revenue Million Forecast, by Distribution Channel 2020 & 2033
- Table 45: Global Cleaning Industry in South Africa Revenue Million Forecast, by Country 2020 & 2033
- Table 46: China Cleaning Industry in South Africa Revenue (Million) Forecast, by Application 2020 & 2033
- Table 47: India Cleaning Industry in South Africa Revenue (Million) Forecast, by Application 2020 & 2033
- Table 48: Japan Cleaning Industry in South Africa Revenue (Million) Forecast, by Application 2020 & 2033
- Table 49: South Korea Cleaning Industry in South Africa Revenue (Million) Forecast, by Application 2020 & 2033
- Table 50: ASEAN Cleaning Industry in South Africa Revenue (Million) Forecast, by Application 2020 & 2033
- Table 51: Oceania Cleaning Industry in South Africa Revenue (Million) Forecast, by Application 2020 & 2033
- Table 52: Rest of Asia Pacific Cleaning Industry in South Africa Revenue (Million) Forecast, by Application 2020 & 2033
Frequently Asked Questions
1. What is the projected Compound Annual Growth Rate (CAGR) of the Cleaning Industry in South Africa?
The projected CAGR is approximately 4.38%.
2. Which companies are prominent players in the Cleaning Industry in South Africa?
Key companies in the market include Tevo (Pty) Ltd, Dyson James Ltd, Nilfisk Group, BWGL Group (Pty) Ltd, Cleaning Equipment Manufacturing SA Pty Ltd*List Not Exhaustive, Chemstrat, Robert Bosch GmbH, Alfred Karcher SE & Co KG, Miele & Cie KG, Nu-World Holdings Ltd.
3. What are the main segments of the Cleaning Industry in South Africa?
The market segments include Product Type, End User, Distribution Channel.
4. Can you provide details about the market size?
The market size is estimated to be USD 0.92 Million as of 2022.
5. What are some drivers contributing to market growth?
Rising Diabetic Population Across the Globe; Innovative and Fashionable Footwear.
6. What are the notable trends driving market growth?
Growing Penetration of Cleaning Products in Households.
7. Are there any restraints impacting market growth?
Enhanced Presence of Counterfeit and Poor-Quality Products.
8. Can you provide examples of recent developments in the market?
November 2021: South Africa's BWGL Group (Pty) Ltd, Lioness, launched a new range of natural and environmentally friendly cleaning products.
9. What pricing options are available for accessing the report?
Pricing options include single-user, multi-user, and enterprise licenses priced at USD 3800, USD 4500, and USD 5800 respectively.
10. Is the market size provided in terms of value or volume?
The market size is provided in terms of value, measured in Million.
11. Are there any specific market keywords associated with the report?
Yes, the market keyword associated with the report is "Cleaning Industry in South Africa," which aids in identifying and referencing the specific market segment covered.
12. How do I determine which pricing option suits my needs best?
The pricing options vary based on user requirements and access needs. Individual users may opt for single-user licenses, while businesses requiring broader access may choose multi-user or enterprise licenses for cost-effective access to the report.
13. Are there any additional resources or data provided in the Cleaning Industry in South Africa report?
While the report offers comprehensive insights, it's advisable to review the specific contents or supplementary materials provided to ascertain if additional resources or data are available.
14. How can I stay updated on further developments or reports in the Cleaning Industry in South Africa?
To stay informed about further developments, trends, and reports in the Cleaning Industry in South Africa, consider subscribing to industry newsletters, following relevant companies and organizations, or regularly checking reputable industry news sources and publications.
Methodology
Step 1 - Identification of Relevant Samples Size from Population Database


Step 2 - Approaches for Defining Global Market Size (Value, Volume* & Price*)

Note*: In applicable scenarios
Step 3 - Data Sources
Primary Research
- Web Analytics
- Survey Reports
- Research Institute
- Latest Research Reports
- Opinion Leaders
Secondary Research
- Annual Reports
- White Paper
- Latest Press Release
- Industry Association
- Paid Database
- Investor Presentations

Step 4 - Data Triangulation
Involves using different sources of information in order to increase the validity of a study
These sources are likely to be stakeholders in a program - participants, other researchers, program staff, other community members, and so on.
Then we put all data in single framework & apply various statistical tools to find out the dynamic on the market.
During the analysis stage, feedback from the stakeholder groups would be compared to determine areas of agreement as well as areas of divergence