

Key Insights
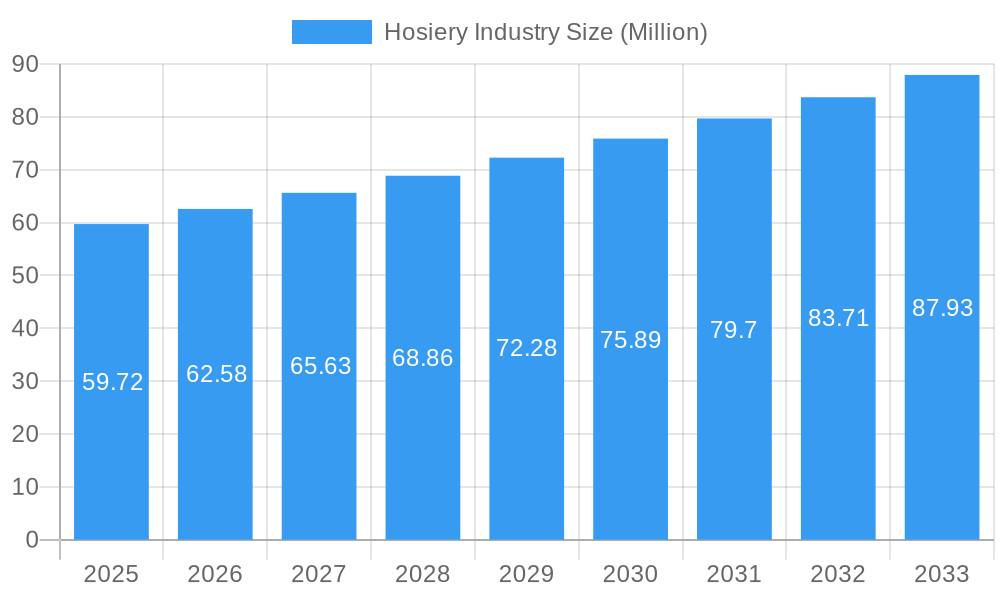
The global hosiery market, valued at $59.72 million in 2025, is projected to experience robust growth, driven by several key factors. Increasing fashion consciousness and the rising demand for comfortable and stylish apparel are primary drivers. The expanding e-commerce sector provides convenient access to a wider range of hosiery products, further fueling market expansion. Specific product types like body stockings and shapewear are experiencing heightened demand, reflecting evolving consumer preferences. While the market faces challenges such as fluctuating raw material prices and intense competition among established and emerging brands, the overall growth trajectory remains positive. The market is segmented by product type (body stockings, socks, knee highs, hold-ups, others), end-user (men, women), and distribution channel (supermarkets/hypermarkets, specialty stores, online retail stores, others). Geographical analysis reveals significant market presence across North America, Europe, and Asia Pacific, with each region exhibiting unique growth dynamics based on consumer preferences, economic conditions, and fashion trends. The 4.86% CAGR indicates a steady and sustainable growth path for the foreseeable future. The presence of established players like Hanesbrands Inc and emerging brands like Skims suggests a dynamic competitive landscape, constantly innovating to cater to evolving consumer needs.
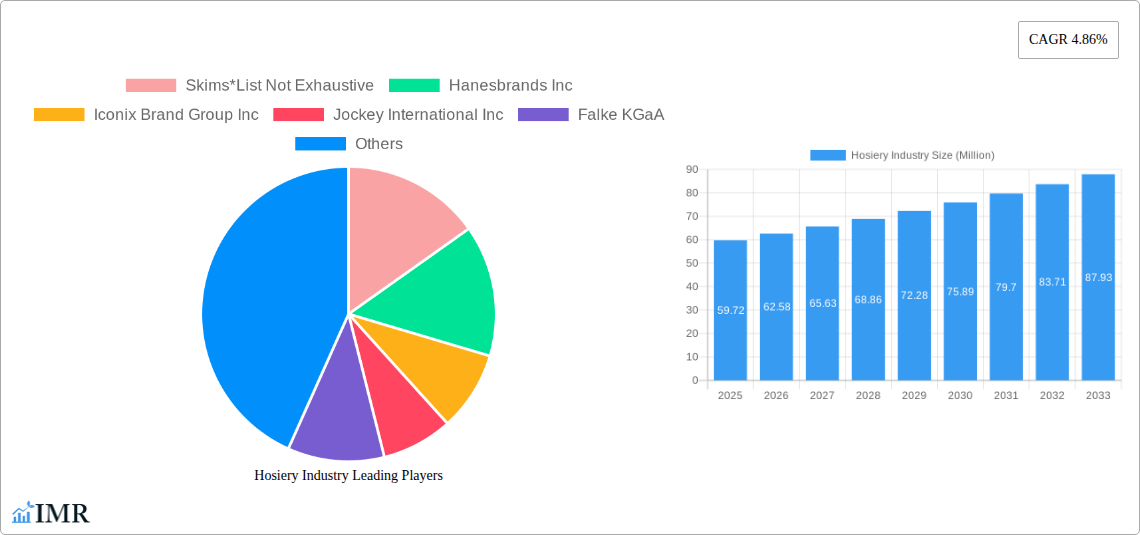
Hosiery Industry Market Size (In Million)
The projected growth of the hosiery market is underpinned by several emerging trends. The increasing integration of sustainable and eco-friendly materials in hosiery manufacturing is gaining traction, aligning with growing consumer awareness of environmental concerns. Furthermore, technological advancements in manufacturing processes, such as improved knitting techniques and the use of advanced fibers, lead to enhanced product quality, durability, and comfort. The market is witnessing a rise in personalized and customized hosiery options, catering to individual preferences and body types. This personalization trend, coupled with the ongoing expansion of online retail channels and sophisticated marketing strategies, positions the market for continued expansion throughout the forecast period (2025-2033). Regional variations in growth will likely be influenced by economic development, fashion trends, and the adoption of online shopping platforms.
Hosiery Industry Company Market Share
Hosiery Industry Market Report: 2019-2033
This comprehensive report provides a detailed analysis of the global hosiery industry, encompassing market dynamics, growth trends, competitive landscape, and future outlook. The study period covers 2019-2033, with a base year of 2025 and a forecast period of 2025-2033. The report segments the market by product type (body stockings, socks, knee highs, hold-ups, other product types), end-user (men, women), and distribution channel (supermarkets/hypermarkets, specialty stores, online retail stores, other distribution channels). The report's insights are crucial for industry professionals, investors, and strategic decision-makers seeking to navigate this dynamic market. Market values are presented in million units.
Hosiery Industry Market Dynamics & Structure
The hosiery market is characterized by a moderately concentrated landscape with a few major players and numerous smaller niche brands. Technological innovation, particularly in materials science and manufacturing processes (e.g., sustainable materials, enhanced comfort features), is a key driver. Regulatory frameworks concerning labeling, material safety, and sustainability influence market practices. Competitive substitutes include other legwear options and alternative clothing items. End-user demographics, particularly the growing preference for comfortable and functional hosiery across age groups and genders, significantly impact market growth. M&A activity, while not exceptionally high, is present, with larger players occasionally acquiring smaller brands to expand their product portfolios or enter new segments.
- Market Concentration: Moderately concentrated, with top 5 players holding xx% market share (2024).
- Technological Innovation: Focus on sustainable materials, improved comfort, and specialized functionalities (e.g., compression socks).
- Regulatory Framework: Compliance with safety and labeling regulations varies by region.
- Competitive Substitutes: Leggings, tights, and other legwear options.
- End-User Demographics: Shifting preferences towards comfort, functionality, and ethical sourcing.
- M&A Activity: Occasional acquisitions, primarily for portfolio expansion. Estimated xx deals in the last 5 years.
Hosiery Industry Growth Trends & Insights
The global hosiery market experienced steady growth during the historical period (2019-2024), driven by increasing disposable incomes, growing fashion consciousness, and the rise of e-commerce. The market is expected to continue its expansion throughout the forecast period (2025-2033), albeit at a moderated pace compared to the previous years. Technological disruptions, such as the introduction of innovative materials and manufacturing techniques, are influencing product development and consumer preference. Consumer behavior is shifting towards sustainable and ethically sourced products, creating opportunities for brands that prioritize these aspects.
- Market Size (Million Units): 2019: xx; 2024: xx; 2025 (Estimated): xx; 2033 (Forecast): xx
- CAGR (2019-2024): xx%
- CAGR (2025-2033): xx%
- Market Penetration: xx% in key regions (2024)
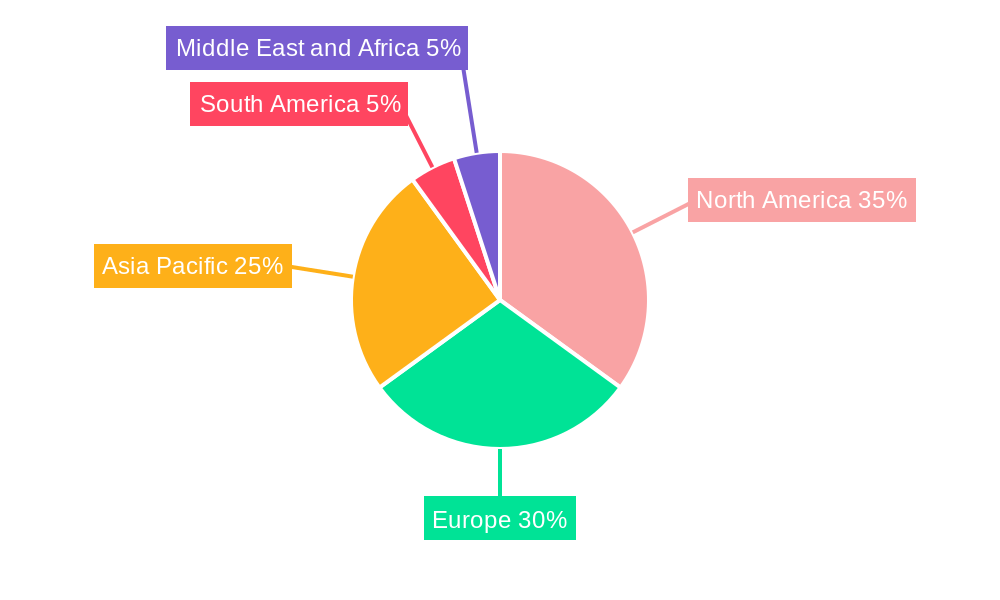
Dominant Regions, Countries, or Segments in Hosiery Industry
The North American and European regions are currently dominant in the global hosiery market, driven by strong consumer demand, established retail infrastructure, and the presence of major players. Within product types, socks maintain the largest market share, followed by tights and other specialized hosiery. The women's segment holds the significant majority of the market share, while the men's segment demonstrates consistent but slower growth. Online retail channels are rapidly expanding, and supermarkets/hypermarkets remain crucial distribution points.
- Leading Region: North America
- Leading Country: USA
- Leading Product Type: Socks
- Leading End-User Segment: Women
- Fastest-Growing Distribution Channel: Online Retail Stores
- Key Drivers: High disposable incomes, established retail infrastructure, strong fashion-conscious culture.
Hosiery Industry Product Landscape
The hosiery industry exhibits a diverse product landscape, encompassing a wide range of materials, designs, and functionalities. Innovations focus on enhanced comfort, improved durability, and the integration of specialized technologies, such as compression and moisture-wicking capabilities. The introduction of sustainable and ethically sourced materials is gaining traction. Unique selling propositions often involve comfort, style, durability, and sustainability features. Recent technological advancements include the use of recycled materials and advanced knitting techniques to improve product performance and reduce environmental impact.
Key Drivers, Barriers & Challenges in Hosiery Industry
Key Drivers: Increasing disposable incomes, growing fashion awareness, rise of e-commerce, and introduction of innovative materials. Government initiatives promoting sustainable textiles also contribute.
Key Challenges & Restraints: Fluctuations in raw material prices, intense competition, changing consumer preferences, and supply chain disruptions. The impact of these challenges could result in an estimated xx% decrease in growth rate for the next 2 years if not addressed effectively.
Emerging Opportunities in Hosiery Industry
Untapped markets in developing economies present significant opportunities. Growing consumer interest in sustainable and ethically sourced products opens avenues for eco-friendly hosiery brands. The increasing popularity of athletic and performance hosiery provides opportunities for specialized product development. Personalized and customized hosiery options are gaining attention.
Growth Accelerators in the Hosiery Industry
Technological advancements in materials and manufacturing processes, such as seamless knitting and 3D printing, are key growth catalysts. Strategic partnerships and collaborations to expand distribution channels and access new markets further accelerate growth. Aggressive marketing strategies focusing on sustainability and ethical sourcing are also playing a crucial role.
Key Players Shaping the Hosiery Industry Market
- Skims
- Hanesbrands Inc
- Iconix Brand Group Inc
- Jockey International Inc
- Falke KGaA
- Gilfin S P A (Golden Lady Company S P A)
- Lanvin Group (Wolford AG)
- Spanx Inc
- Heist Studios
- CSP International Fashion Group S P A
- Carolina Hosiery Mill Inc (Carolina Ultimate Real Tree)
- G-III Apparel Group (Donna Karan International)
Notable Milestones in Hosiery Industry Sector
- September 2021: SKIMS launched its first sock collection, expanding its product portfolio into a new market segment.
- October 2021: Heist Studios unveiled four sustainable tights, highlighting the growing consumer preference for ethical products.
- May 2022: Falke introduced new pressure-free running socks, showcasing innovation in performance hosiery.
In-Depth Hosiery Industry Market Outlook
The hosiery market is poised for continued growth, driven by several factors including ongoing innovation in materials and technology, expanding e-commerce channels, and a growing emphasis on sustainability and ethical sourcing. Strategic partnerships, targeted marketing campaigns, and expansion into new markets will be crucial for long-term success. The market offers substantial opportunities for companies that can effectively adapt to evolving consumer preferences and technological advancements.
Hosiery Industry Segmentation
-
1. Product Type
- 1.1. Body stockings
- 1.2. Socks
- 1.3. Knee highs, Hold-ups
- 1.4. Other Product Types
-
2. End-User
- 2.1. Men
- 2.2. Women
-
3. Distribution Channel
- 3.1. Supermarkets/Hypermarkets
- 3.2. Specialty Stores
- 3.3. Online Retail Stores
- 3.4. Other Distribution Channels
Hosiery Industry Segmentation By Geography
-
1. North America
- 1.1. United States
- 1.2. Canada
- 1.3. Mexico
- 1.4. Rest of North America
-
2. Europe
- 2.1. Spain
- 2.2. United Kingdom
- 2.3. Germany
- 2.4. France
- 2.5. Italy
- 2.6. Russia
- 2.7. Rest of Europe
-
3. Asia Pacific
- 3.1. China
- 3.2. Japan
- 3.3. India
- 3.4. Australia
- 3.5. Rest of Asia Pacific
-
4. South America
- 4.1. Brazil
- 4.2. Argentina
- 4.3. Rest of South America
-
5. Middle East and Africa
- 5.1. South Africa
- 5.2. Saudi Arabia
- 5.3. Rest of Middle East and Africa
Hosiery Industry Regional Market Share
Geographic Coverage of Hosiery Industry
Hosiery Industry REPORT HIGHLIGHTS
| Aspects | Details |
|---|---|
| Study Period | 2020-2034 |
| Base Year | 2025 |
| Estimated Year | 2026 |
| Forecast Period | 2026-2034 |
| Historical Period | 2020-2025 |
| Growth Rate | CAGR of 4.86% from 2020-2034 |
| Segmentation |
|
Table of Contents
- 1. Introduction
- 1.1. Research Scope
- 1.2. Market Segmentation
- 1.3. Research Objective
- 1.4. Definitions and Assumptions
- 2. Executive Summary
- 2.1. Market Snapshot
- 3. Market Dynamics
- 3.1. Market Drivers
- 3.2. Market Restrains
- 3.3. Market Trends
- 3.4. Market Opportunities
- 4. Market Factor Analysis
- 4.1. Porters Five Forces
- 4.1.1. Bargaining Power of Suppliers
- 4.1.2. Bargaining Power of Buyers
- 4.1.3. Threat of New Entrants
- 4.1.4. Threat of Substitutes
- 4.1.5. Competitive Rivalry
- 4.2. PESTEL analysis
- 4.3. BCG Analysis
- 4.3.1. Stars (High Growth, High Market Share)
- 4.3.2. Cash Cows (Low Growth, High Market Share)
- 4.3.3. Question Mark (High Growth, Low Market Share)
- 4.3.4. Dogs (Low Growth, Low Market Share)
- 4.4. Ansoff Matrix Analysis
- 4.5. Supply Chain Analysis
- 4.6. Regulatory Landscape
- 4.7. Current Market Potential and Opportunity Assessment (TAM–SAM–SOM Framework)
- 4.8. IMR Analyst Note
- 4.1. Porters Five Forces
- 5. Market Analysis, Insights and Forecast 2021-2033
- 5.1. Market Analysis, Insights and Forecast - by Product Type
- 5.1.1. Body stockings
- 5.1.2. Socks
- 5.1.3. Knee highs, Hold-ups
- 5.1.4. Other Product Types
- 5.2. Market Analysis, Insights and Forecast - by End-User
- 5.2.1. Men
- 5.2.2. Women
- 5.3. Market Analysis, Insights and Forecast - by Distribution Channel
- 5.3.1. Supermarkets/Hypermarkets
- 5.3.2. Specialty Stores
- 5.3.3. Online Retail Stores
- 5.3.4. Other Distribution Channels
- 5.4. Market Analysis, Insights and Forecast - by Region
- 5.4.1. North America
- 5.4.2. Europe
- 5.4.3. Asia Pacific
- 5.4.4. South America
- 5.4.5. Middle East and Africa
- 5.1. Market Analysis, Insights and Forecast - by Product Type
- 6. Global Hosiery Industry Analysis, Insights and Forecast, 2021-2033
- 6.1. Market Analysis, Insights and Forecast - by Product Type
- 6.1.1. Body stockings
- 6.1.2. Socks
- 6.1.3. Knee highs, Hold-ups
- 6.1.4. Other Product Types
- 6.2. Market Analysis, Insights and Forecast - by End-User
- 6.2.1. Men
- 6.2.2. Women
- 6.3. Market Analysis, Insights and Forecast - by Distribution Channel
- 6.3.1. Supermarkets/Hypermarkets
- 6.3.2. Specialty Stores
- 6.3.3. Online Retail Stores
- 6.3.4. Other Distribution Channels
- 6.1. Market Analysis, Insights and Forecast - by Product Type
- 7. North America Hosiery Industry Analysis, Insights and Forecast, 2020-2032
- 7.1. Market Analysis, Insights and Forecast - by Product Type
- 7.1.1. Body stockings
- 7.1.2. Socks
- 7.1.3. Knee highs, Hold-ups
- 7.1.4. Other Product Types
- 7.2. Market Analysis, Insights and Forecast - by End-User
- 7.2.1. Men
- 7.2.2. Women
- 7.3. Market Analysis, Insights and Forecast - by Distribution Channel
- 7.3.1. Supermarkets/Hypermarkets
- 7.3.2. Specialty Stores
- 7.3.3. Online Retail Stores
- 7.3.4. Other Distribution Channels
- 7.1. Market Analysis, Insights and Forecast - by Product Type
- 8. Europe Hosiery Industry Analysis, Insights and Forecast, 2020-2032
- 8.1. Market Analysis, Insights and Forecast - by Product Type
- 8.1.1. Body stockings
- 8.1.2. Socks
- 8.1.3. Knee highs, Hold-ups
- 8.1.4. Other Product Types
- 8.2. Market Analysis, Insights and Forecast - by End-User
- 8.2.1. Men
- 8.2.2. Women
- 8.3. Market Analysis, Insights and Forecast - by Distribution Channel
- 8.3.1. Supermarkets/Hypermarkets
- 8.3.2. Specialty Stores
- 8.3.3. Online Retail Stores
- 8.3.4. Other Distribution Channels
- 8.1. Market Analysis, Insights and Forecast - by Product Type
- 9. Asia Pacific Hosiery Industry Analysis, Insights and Forecast, 2020-2032
- 9.1. Market Analysis, Insights and Forecast - by Product Type
- 9.1.1. Body stockings
- 9.1.2. Socks
- 9.1.3. Knee highs, Hold-ups
- 9.1.4. Other Product Types
- 9.2. Market Analysis, Insights and Forecast - by End-User
- 9.2.1. Men
- 9.2.2. Women
- 9.3. Market Analysis, Insights and Forecast - by Distribution Channel
- 9.3.1. Supermarkets/Hypermarkets
- 9.3.2. Specialty Stores
- 9.3.3. Online Retail Stores
- 9.3.4. Other Distribution Channels
- 9.1. Market Analysis, Insights and Forecast - by Product Type
- 10. South America Hosiery Industry Analysis, Insights and Forecast, 2020-2032
- 10.1. Market Analysis, Insights and Forecast - by Product Type
- 10.1.1. Body stockings
- 10.1.2. Socks
- 10.1.3. Knee highs, Hold-ups
- 10.1.4. Other Product Types
- 10.2. Market Analysis, Insights and Forecast - by End-User
- 10.2.1. Men
- 10.2.2. Women
- 10.3. Market Analysis, Insights and Forecast - by Distribution Channel
- 10.3.1. Supermarkets/Hypermarkets
- 10.3.2. Specialty Stores
- 10.3.3. Online Retail Stores
- 10.3.4. Other Distribution Channels
- 10.1. Market Analysis, Insights and Forecast - by Product Type
- 11. Middle East and Africa Hosiery Industry Analysis, Insights and Forecast, 2020-2032
- 11.1. Market Analysis, Insights and Forecast - by Product Type
- 11.1.1. Body stockings
- 11.1.2. Socks
- 11.1.3. Knee highs, Hold-ups
- 11.1.4. Other Product Types
- 11.2. Market Analysis, Insights and Forecast - by End-User
- 11.2.1. Men
- 11.2.2. Women
- 11.3. Market Analysis, Insights and Forecast - by Distribution Channel
- 11.3.1. Supermarkets/Hypermarkets
- 11.3.2. Specialty Stores
- 11.3.3. Online Retail Stores
- 11.3.4. Other Distribution Channels
- 11.1. Market Analysis, Insights and Forecast - by Product Type
- 12. Competitive Analysis
- 12.1. Company Profiles
- 12.1.1 Skims*List Not Exhaustive
- 12.1.1.1. Company Overview
- 12.1.1.2. Products
- 12.1.1.3. Company Financials
- 12.1.1.4. SWOT Analysis
- 12.1.2 Hanesbrands Inc
- 12.1.2.1. Company Overview
- 12.1.2.2. Products
- 12.1.2.3. Company Financials
- 12.1.2.4. SWOT Analysis
- 12.1.3 Iconix Brand Group Inc
- 12.1.3.1. Company Overview
- 12.1.3.2. Products
- 12.1.3.3. Company Financials
- 12.1.3.4. SWOT Analysis
- 12.1.4 Jockey International Inc
- 12.1.4.1. Company Overview
- 12.1.4.2. Products
- 12.1.4.3. Company Financials
- 12.1.4.4. SWOT Analysis
- 12.1.5 Falke KGaA
- 12.1.5.1. Company Overview
- 12.1.5.2. Products
- 12.1.5.3. Company Financials
- 12.1.5.4. SWOT Analysis
- 12.1.6 Gilfin S P A (Golden Lady Company S P A)
- 12.1.6.1. Company Overview
- 12.1.6.2. Products
- 12.1.6.3. Company Financials
- 12.1.6.4. SWOT Analysis
- 12.1.7 Lanvin Group (Wolford AG)
- 12.1.7.1. Company Overview
- 12.1.7.2. Products
- 12.1.7.3. Company Financials
- 12.1.7.4. SWOT Analysis
- 12.1.8 Spanx Inc
- 12.1.8.1. Company Overview
- 12.1.8.2. Products
- 12.1.8.3. Company Financials
- 12.1.8.4. SWOT Analysis
- 12.1.9 Heist Studios
- 12.1.9.1. Company Overview
- 12.1.9.2. Products
- 12.1.9.3. Company Financials
- 12.1.9.4. SWOT Analysis
- 12.1.10 CSP International Fashion Group S P A
- 12.1.10.1. Company Overview
- 12.1.10.2. Products
- 12.1.10.3. Company Financials
- 12.1.10.4. SWOT Analysis
- 12.1.11 Carolina Hosiery Mill Inc (Carolina Ultimate Real Tree)
- 12.1.11.1. Company Overview
- 12.1.11.2. Products
- 12.1.11.3. Company Financials
- 12.1.11.4. SWOT Analysis
- 12.1.12 G-III Apparel Group (Donna Karan International)
- 12.1.12.1. Company Overview
- 12.1.12.2. Products
- 12.1.12.3. Company Financials
- 12.1.12.4. SWOT Analysis
- 12.1.1 Skims*List Not Exhaustive
- 12.2. Market Entropy
- 12.2.1 Company's Key Areas Served
- 12.2.2 Recent Developments
- 12.3. Company Market Share Analysis 2025
- 12.3.1 Top 5 Companies Market Share Analysis
- 12.3.2 Top 3 Companies Market Share Analysis
- 12.4. List of Potential Customers
- 13. Research Methodology
List of Figures
- Figure 1: Global Hosiery Industry Revenue Breakdown (Million, %) by Region 2025 & 2033
- Figure 2: Global Hosiery Industry Volume Breakdown (K Units, %) by Region 2025 & 2033
- Figure 3: North America Hosiery Industry Revenue (Million), by Product Type 2025 & 2033
- Figure 4: North America Hosiery Industry Volume (K Units), by Product Type 2025 & 2033
- Figure 5: North America Hosiery Industry Revenue Share (%), by Product Type 2025 & 2033
- Figure 6: North America Hosiery Industry Volume Share (%), by Product Type 2025 & 2033
- Figure 7: North America Hosiery Industry Revenue (Million), by End-User 2025 & 2033
- Figure 8: North America Hosiery Industry Volume (K Units), by End-User 2025 & 2033
- Figure 9: North America Hosiery Industry Revenue Share (%), by End-User 2025 & 2033
- Figure 10: North America Hosiery Industry Volume Share (%), by End-User 2025 & 2033
- Figure 11: North America Hosiery Industry Revenue (Million), by Distribution Channel 2025 & 2033
- Figure 12: North America Hosiery Industry Volume (K Units), by Distribution Channel 2025 & 2033
- Figure 13: North America Hosiery Industry Revenue Share (%), by Distribution Channel 2025 & 2033
- Figure 14: North America Hosiery Industry Volume Share (%), by Distribution Channel 2025 & 2033
- Figure 15: North America Hosiery Industry Revenue (Million), by Country 2025 & 2033
- Figure 16: North America Hosiery Industry Volume (K Units), by Country 2025 & 2033
- Figure 17: North America Hosiery Industry Revenue Share (%), by Country 2025 & 2033
- Figure 18: North America Hosiery Industry Volume Share (%), by Country 2025 & 2033
- Figure 19: Europe Hosiery Industry Revenue (Million), by Product Type 2025 & 2033
- Figure 20: Europe Hosiery Industry Volume (K Units), by Product Type 2025 & 2033
- Figure 21: Europe Hosiery Industry Revenue Share (%), by Product Type 2025 & 2033
- Figure 22: Europe Hosiery Industry Volume Share (%), by Product Type 2025 & 2033
- Figure 23: Europe Hosiery Industry Revenue (Million), by End-User 2025 & 2033
- Figure 24: Europe Hosiery Industry Volume (K Units), by End-User 2025 & 2033
- Figure 25: Europe Hosiery Industry Revenue Share (%), by End-User 2025 & 2033
- Figure 26: Europe Hosiery Industry Volume Share (%), by End-User 2025 & 2033
- Figure 27: Europe Hosiery Industry Revenue (Million), by Distribution Channel 2025 & 2033
- Figure 28: Europe Hosiery Industry Volume (K Units), by Distribution Channel 2025 & 2033
- Figure 29: Europe Hosiery Industry Revenue Share (%), by Distribution Channel 2025 & 2033
- Figure 30: Europe Hosiery Industry Volume Share (%), by Distribution Channel 2025 & 2033
- Figure 31: Europe Hosiery Industry Revenue (Million), by Country 2025 & 2033
- Figure 32: Europe Hosiery Industry Volume (K Units), by Country 2025 & 2033
- Figure 33: Europe Hosiery Industry Revenue Share (%), by Country 2025 & 2033
- Figure 34: Europe Hosiery Industry Volume Share (%), by Country 2025 & 2033
- Figure 35: Asia Pacific Hosiery Industry Revenue (Million), by Product Type 2025 & 2033
- Figure 36: Asia Pacific Hosiery Industry Volume (K Units), by Product Type 2025 & 2033
- Figure 37: Asia Pacific Hosiery Industry Revenue Share (%), by Product Type 2025 & 2033
- Figure 38: Asia Pacific Hosiery Industry Volume Share (%), by Product Type 2025 & 2033
- Figure 39: Asia Pacific Hosiery Industry Revenue (Million), by End-User 2025 & 2033
- Figure 40: Asia Pacific Hosiery Industry Volume (K Units), by End-User 2025 & 2033
- Figure 41: Asia Pacific Hosiery Industry Revenue Share (%), by End-User 2025 & 2033
- Figure 42: Asia Pacific Hosiery Industry Volume Share (%), by End-User 2025 & 2033
- Figure 43: Asia Pacific Hosiery Industry Revenue (Million), by Distribution Channel 2025 & 2033
- Figure 44: Asia Pacific Hosiery Industry Volume (K Units), by Distribution Channel 2025 & 2033
- Figure 45: Asia Pacific Hosiery Industry Revenue Share (%), by Distribution Channel 2025 & 2033
- Figure 46: Asia Pacific Hosiery Industry Volume Share (%), by Distribution Channel 2025 & 2033
- Figure 47: Asia Pacific Hosiery Industry Revenue (Million), by Country 2025 & 2033
- Figure 48: Asia Pacific Hosiery Industry Volume (K Units), by Country 2025 & 2033
- Figure 49: Asia Pacific Hosiery Industry Revenue Share (%), by Country 2025 & 2033
- Figure 50: Asia Pacific Hosiery Industry Volume Share (%), by Country 2025 & 2033
- Figure 51: South America Hosiery Industry Revenue (Million), by Product Type 2025 & 2033
- Figure 52: South America Hosiery Industry Volume (K Units), by Product Type 2025 & 2033
- Figure 53: South America Hosiery Industry Revenue Share (%), by Product Type 2025 & 2033
- Figure 54: South America Hosiery Industry Volume Share (%), by Product Type 2025 & 2033
- Figure 55: South America Hosiery Industry Revenue (Million), by End-User 2025 & 2033
- Figure 56: South America Hosiery Industry Volume (K Units), by End-User 2025 & 2033
- Figure 57: South America Hosiery Industry Revenue Share (%), by End-User 2025 & 2033
- Figure 58: South America Hosiery Industry Volume Share (%), by End-User 2025 & 2033
- Figure 59: South America Hosiery Industry Revenue (Million), by Distribution Channel 2025 & 2033
- Figure 60: South America Hosiery Industry Volume (K Units), by Distribution Channel 2025 & 2033
- Figure 61: South America Hosiery Industry Revenue Share (%), by Distribution Channel 2025 & 2033
- Figure 62: South America Hosiery Industry Volume Share (%), by Distribution Channel 2025 & 2033
- Figure 63: South America Hosiery Industry Revenue (Million), by Country 2025 & 2033
- Figure 64: South America Hosiery Industry Volume (K Units), by Country 2025 & 2033
- Figure 65: South America Hosiery Industry Revenue Share (%), by Country 2025 & 2033
- Figure 66: South America Hosiery Industry Volume Share (%), by Country 2025 & 2033
- Figure 67: Middle East and Africa Hosiery Industry Revenue (Million), by Product Type 2025 & 2033
- Figure 68: Middle East and Africa Hosiery Industry Volume (K Units), by Product Type 2025 & 2033
- Figure 69: Middle East and Africa Hosiery Industry Revenue Share (%), by Product Type 2025 & 2033
- Figure 70: Middle East and Africa Hosiery Industry Volume Share (%), by Product Type 2025 & 2033
- Figure 71: Middle East and Africa Hosiery Industry Revenue (Million), by End-User 2025 & 2033
- Figure 72: Middle East and Africa Hosiery Industry Volume (K Units), by End-User 2025 & 2033
- Figure 73: Middle East and Africa Hosiery Industry Revenue Share (%), by End-User 2025 & 2033
- Figure 74: Middle East and Africa Hosiery Industry Volume Share (%), by End-User 2025 & 2033
- Figure 75: Middle East and Africa Hosiery Industry Revenue (Million), by Distribution Channel 2025 & 2033
- Figure 76: Middle East and Africa Hosiery Industry Volume (K Units), by Distribution Channel 2025 & 2033
- Figure 77: Middle East and Africa Hosiery Industry Revenue Share (%), by Distribution Channel 2025 & 2033
- Figure 78: Middle East and Africa Hosiery Industry Volume Share (%), by Distribution Channel 2025 & 2033
- Figure 79: Middle East and Africa Hosiery Industry Revenue (Million), by Country 2025 & 2033
- Figure 80: Middle East and Africa Hosiery Industry Volume (K Units), by Country 2025 & 2033
- Figure 81: Middle East and Africa Hosiery Industry Revenue Share (%), by Country 2025 & 2033
- Figure 82: Middle East and Africa Hosiery Industry Volume Share (%), by Country 2025 & 2033
List of Tables
- Table 1: Global Hosiery Industry Revenue Million Forecast, by Product Type 2020 & 2033
- Table 2: Global Hosiery Industry Volume K Units Forecast, by Product Type 2020 & 2033
- Table 3: Global Hosiery Industry Revenue Million Forecast, by End-User 2020 & 2033
- Table 4: Global Hosiery Industry Volume K Units Forecast, by End-User 2020 & 2033
- Table 5: Global Hosiery Industry Revenue Million Forecast, by Distribution Channel 2020 & 2033
- Table 6: Global Hosiery Industry Volume K Units Forecast, by Distribution Channel 2020 & 2033
- Table 7: Global Hosiery Industry Revenue Million Forecast, by Region 2020 & 2033
- Table 8: Global Hosiery Industry Volume K Units Forecast, by Region 2020 & 2033
- Table 9: Global Hosiery Industry Revenue Million Forecast, by Product Type 2020 & 2033
- Table 10: Global Hosiery Industry Volume K Units Forecast, by Product Type 2020 & 2033
- Table 11: Global Hosiery Industry Revenue Million Forecast, by End-User 2020 & 2033
- Table 12: Global Hosiery Industry Volume K Units Forecast, by End-User 2020 & 2033
- Table 13: Global Hosiery Industry Revenue Million Forecast, by Distribution Channel 2020 & 2033
- Table 14: Global Hosiery Industry Volume K Units Forecast, by Distribution Channel 2020 & 2033
- Table 15: Global Hosiery Industry Revenue Million Forecast, by Country 2020 & 2033
- Table 16: Global Hosiery Industry Volume K Units Forecast, by Country 2020 & 2033
- Table 17: United States Hosiery Industry Revenue (Million) Forecast, by Application 2020 & 2033
- Table 18: United States Hosiery Industry Volume (K Units) Forecast, by Application 2020 & 2033
- Table 19: Canada Hosiery Industry Revenue (Million) Forecast, by Application 2020 & 2033
- Table 20: Canada Hosiery Industry Volume (K Units) Forecast, by Application 2020 & 2033
- Table 21: Mexico Hosiery Industry Revenue (Million) Forecast, by Application 2020 & 2033
- Table 22: Mexico Hosiery Industry Volume (K Units) Forecast, by Application 2020 & 2033
- Table 23: Rest of North America Hosiery Industry Revenue (Million) Forecast, by Application 2020 & 2033
- Table 24: Rest of North America Hosiery Industry Volume (K Units) Forecast, by Application 2020 & 2033
- Table 25: Global Hosiery Industry Revenue Million Forecast, by Product Type 2020 & 2033
- Table 26: Global Hosiery Industry Volume K Units Forecast, by Product Type 2020 & 2033
- Table 27: Global Hosiery Industry Revenue Million Forecast, by End-User 2020 & 2033
- Table 28: Global Hosiery Industry Volume K Units Forecast, by End-User 2020 & 2033
- Table 29: Global Hosiery Industry Revenue Million Forecast, by Distribution Channel 2020 & 2033
- Table 30: Global Hosiery Industry Volume K Units Forecast, by Distribution Channel 2020 & 2033
- Table 31: Global Hosiery Industry Revenue Million Forecast, by Country 2020 & 2033
- Table 32: Global Hosiery Industry Volume K Units Forecast, by Country 2020 & 2033
- Table 33: Spain Hosiery Industry Revenue (Million) Forecast, by Application 2020 & 2033
- Table 34: Spain Hosiery Industry Volume (K Units) Forecast, by Application 2020 & 2033
- Table 35: United Kingdom Hosiery Industry Revenue (Million) Forecast, by Application 2020 & 2033
- Table 36: United Kingdom Hosiery Industry Volume (K Units) Forecast, by Application 2020 & 2033
- Table 37: Germany Hosiery Industry Revenue (Million) Forecast, by Application 2020 & 2033
- Table 38: Germany Hosiery Industry Volume (K Units) Forecast, by Application 2020 & 2033
- Table 39: France Hosiery Industry Revenue (Million) Forecast, by Application 2020 & 2033
- Table 40: France Hosiery Industry Volume (K Units) Forecast, by Application 2020 & 2033
- Table 41: Italy Hosiery Industry Revenue (Million) Forecast, by Application 2020 & 2033
- Table 42: Italy Hosiery Industry Volume (K Units) Forecast, by Application 2020 & 2033
- Table 43: Russia Hosiery Industry Revenue (Million) Forecast, by Application 2020 & 2033
- Table 44: Russia Hosiery Industry Volume (K Units) Forecast, by Application 2020 & 2033
- Table 45: Rest of Europe Hosiery Industry Revenue (Million) Forecast, by Application 2020 & 2033
- Table 46: Rest of Europe Hosiery Industry Volume (K Units) Forecast, by Application 2020 & 2033
- Table 47: Global Hosiery Industry Revenue Million Forecast, by Product Type 2020 & 2033
- Table 48: Global Hosiery Industry Volume K Units Forecast, by Product Type 2020 & 2033
- Table 49: Global Hosiery Industry Revenue Million Forecast, by End-User 2020 & 2033
- Table 50: Global Hosiery Industry Volume K Units Forecast, by End-User 2020 & 2033
- Table 51: Global Hosiery Industry Revenue Million Forecast, by Distribution Channel 2020 & 2033
- Table 52: Global Hosiery Industry Volume K Units Forecast, by Distribution Channel 2020 & 2033
- Table 53: Global Hosiery Industry Revenue Million Forecast, by Country 2020 & 2033
- Table 54: Global Hosiery Industry Volume K Units Forecast, by Country 2020 & 2033
- Table 55: China Hosiery Industry Revenue (Million) Forecast, by Application 2020 & 2033
- Table 56: China Hosiery Industry Volume (K Units) Forecast, by Application 2020 & 2033
- Table 57: Japan Hosiery Industry Revenue (Million) Forecast, by Application 2020 & 2033
- Table 58: Japan Hosiery Industry Volume (K Units) Forecast, by Application 2020 & 2033
- Table 59: India Hosiery Industry Revenue (Million) Forecast, by Application 2020 & 2033
- Table 60: India Hosiery Industry Volume (K Units) Forecast, by Application 2020 & 2033
- Table 61: Australia Hosiery Industry Revenue (Million) Forecast, by Application 2020 & 2033
- Table 62: Australia Hosiery Industry Volume (K Units) Forecast, by Application 2020 & 2033
- Table 63: Rest of Asia Pacific Hosiery Industry Revenue (Million) Forecast, by Application 2020 & 2033
- Table 64: Rest of Asia Pacific Hosiery Industry Volume (K Units) Forecast, by Application 2020 & 2033
- Table 65: Global Hosiery Industry Revenue Million Forecast, by Product Type 2020 & 2033
- Table 66: Global Hosiery Industry Volume K Units Forecast, by Product Type 2020 & 2033
- Table 67: Global Hosiery Industry Revenue Million Forecast, by End-User 2020 & 2033
- Table 68: Global Hosiery Industry Volume K Units Forecast, by End-User 2020 & 2033
- Table 69: Global Hosiery Industry Revenue Million Forecast, by Distribution Channel 2020 & 2033
- Table 70: Global Hosiery Industry Volume K Units Forecast, by Distribution Channel 2020 & 2033
- Table 71: Global Hosiery Industry Revenue Million Forecast, by Country 2020 & 2033
- Table 72: Global Hosiery Industry Volume K Units Forecast, by Country 2020 & 2033
- Table 73: Brazil Hosiery Industry Revenue (Million) Forecast, by Application 2020 & 2033
- Table 74: Brazil Hosiery Industry Volume (K Units) Forecast, by Application 2020 & 2033
- Table 75: Argentina Hosiery Industry Revenue (Million) Forecast, by Application 2020 & 2033
- Table 76: Argentina Hosiery Industry Volume (K Units) Forecast, by Application 2020 & 2033
- Table 77: Rest of South America Hosiery Industry Revenue (Million) Forecast, by Application 2020 & 2033
- Table 78: Rest of South America Hosiery Industry Volume (K Units) Forecast, by Application 2020 & 2033
- Table 79: Global Hosiery Industry Revenue Million Forecast, by Product Type 2020 & 2033
- Table 80: Global Hosiery Industry Volume K Units Forecast, by Product Type 2020 & 2033
- Table 81: Global Hosiery Industry Revenue Million Forecast, by End-User 2020 & 2033
- Table 82: Global Hosiery Industry Volume K Units Forecast, by End-User 2020 & 2033
- Table 83: Global Hosiery Industry Revenue Million Forecast, by Distribution Channel 2020 & 2033
- Table 84: Global Hosiery Industry Volume K Units Forecast, by Distribution Channel 2020 & 2033
- Table 85: Global Hosiery Industry Revenue Million Forecast, by Country 2020 & 2033
- Table 86: Global Hosiery Industry Volume K Units Forecast, by Country 2020 & 2033
- Table 87: South Africa Hosiery Industry Revenue (Million) Forecast, by Application 2020 & 2033
- Table 88: South Africa Hosiery Industry Volume (K Units) Forecast, by Application 2020 & 2033
- Table 89: Saudi Arabia Hosiery Industry Revenue (Million) Forecast, by Application 2020 & 2033
- Table 90: Saudi Arabia Hosiery Industry Volume (K Units) Forecast, by Application 2020 & 2033
- Table 91: Rest of Middle East and Africa Hosiery Industry Revenue (Million) Forecast, by Application 2020 & 2033
- Table 92: Rest of Middle East and Africa Hosiery Industry Volume (K Units) Forecast, by Application 2020 & 2033
Frequently Asked Questions
1. What is the projected Compound Annual Growth Rate (CAGR) of the Hosiery Industry?
The projected CAGR is approximately 4.86%.
2. Which companies are prominent players in the Hosiery Industry?
Key companies in the market include Skims*List Not Exhaustive, Hanesbrands Inc, Iconix Brand Group Inc, Jockey International Inc, Falke KGaA, Gilfin S P A (Golden Lady Company S P A), Lanvin Group (Wolford AG), Spanx Inc, Heist Studios, CSP International Fashion Group S P A, Carolina Hosiery Mill Inc (Carolina Ultimate Real Tree), G-III Apparel Group (Donna Karan International).
3. What are the main segments of the Hosiery Industry?
The market segments include Product Type, End-User, Distribution Channel.
4. Can you provide details about the market size?
The market size is estimated to be USD 59.72 Million as of 2022.
5. What are some drivers contributing to market growth?
Fast Fashion Trend; Inflating Income Level of Individuals.
6. What are the notable trends driving market growth?
Innovative Garments Dominates the Market.
7. Are there any restraints impacting market growth?
The Presence Of Counterfeit Products.
8. Can you provide examples of recent developments in the market?
In May 2022, Falke Introduced New Pressure-Free Running Socks. Falke's new Pressure-Free sock incorporates a unique design feature to reduce the potential hotspot across the bridge of the foot. Falke has inserted a striated pad of channels on top of the foot that may move dynamically in response to foot movements. This helps to spread movement pressure and relieve pressure buildup in this area.
9. What pricing options are available for accessing the report?
Pricing options include single-user, multi-user, and enterprise licenses priced at USD 4750, USD 5250, and USD 8750 respectively.
10. Is the market size provided in terms of value or volume?
The market size is provided in terms of value, measured in Million and volume, measured in K Units.
11. Are there any specific market keywords associated with the report?
Yes, the market keyword associated with the report is "Hosiery Industry," which aids in identifying and referencing the specific market segment covered.
12. How do I determine which pricing option suits my needs best?
The pricing options vary based on user requirements and access needs. Individual users may opt for single-user licenses, while businesses requiring broader access may choose multi-user or enterprise licenses for cost-effective access to the report.
13. Are there any additional resources or data provided in the Hosiery Industry report?
While the report offers comprehensive insights, it's advisable to review the specific contents or supplementary materials provided to ascertain if additional resources or data are available.
14. How can I stay updated on further developments or reports in the Hosiery Industry?
To stay informed about further developments, trends, and reports in the Hosiery Industry, consider subscribing to industry newsletters, following relevant companies and organizations, or regularly checking reputable industry news sources and publications.
Methodology
Step 1 - Identification of Relevant Samples Size from Population Database


Step 2 - Approaches for Defining Global Market Size (Value, Volume* & Price*)

Note*: In applicable scenarios
Step 3 - Data Sources
Primary Research
- Web Analytics
- Survey Reports
- Research Institute
- Latest Research Reports
- Opinion Leaders
Secondary Research
- Annual Reports
- White Paper
- Latest Press Release
- Industry Association
- Paid Database
- Investor Presentations

Step 4 - Data Triangulation
Involves using different sources of information in order to increase the validity of a study
These sources are likely to be stakeholders in a program - participants, other researchers, program staff, other community members, and so on.
Then we put all data in single framework & apply various statistical tools to find out the dynamic on the market.
During the analysis stage, feedback from the stakeholder groups would be compared to determine areas of agreement as well as areas of divergence