

Key Insights
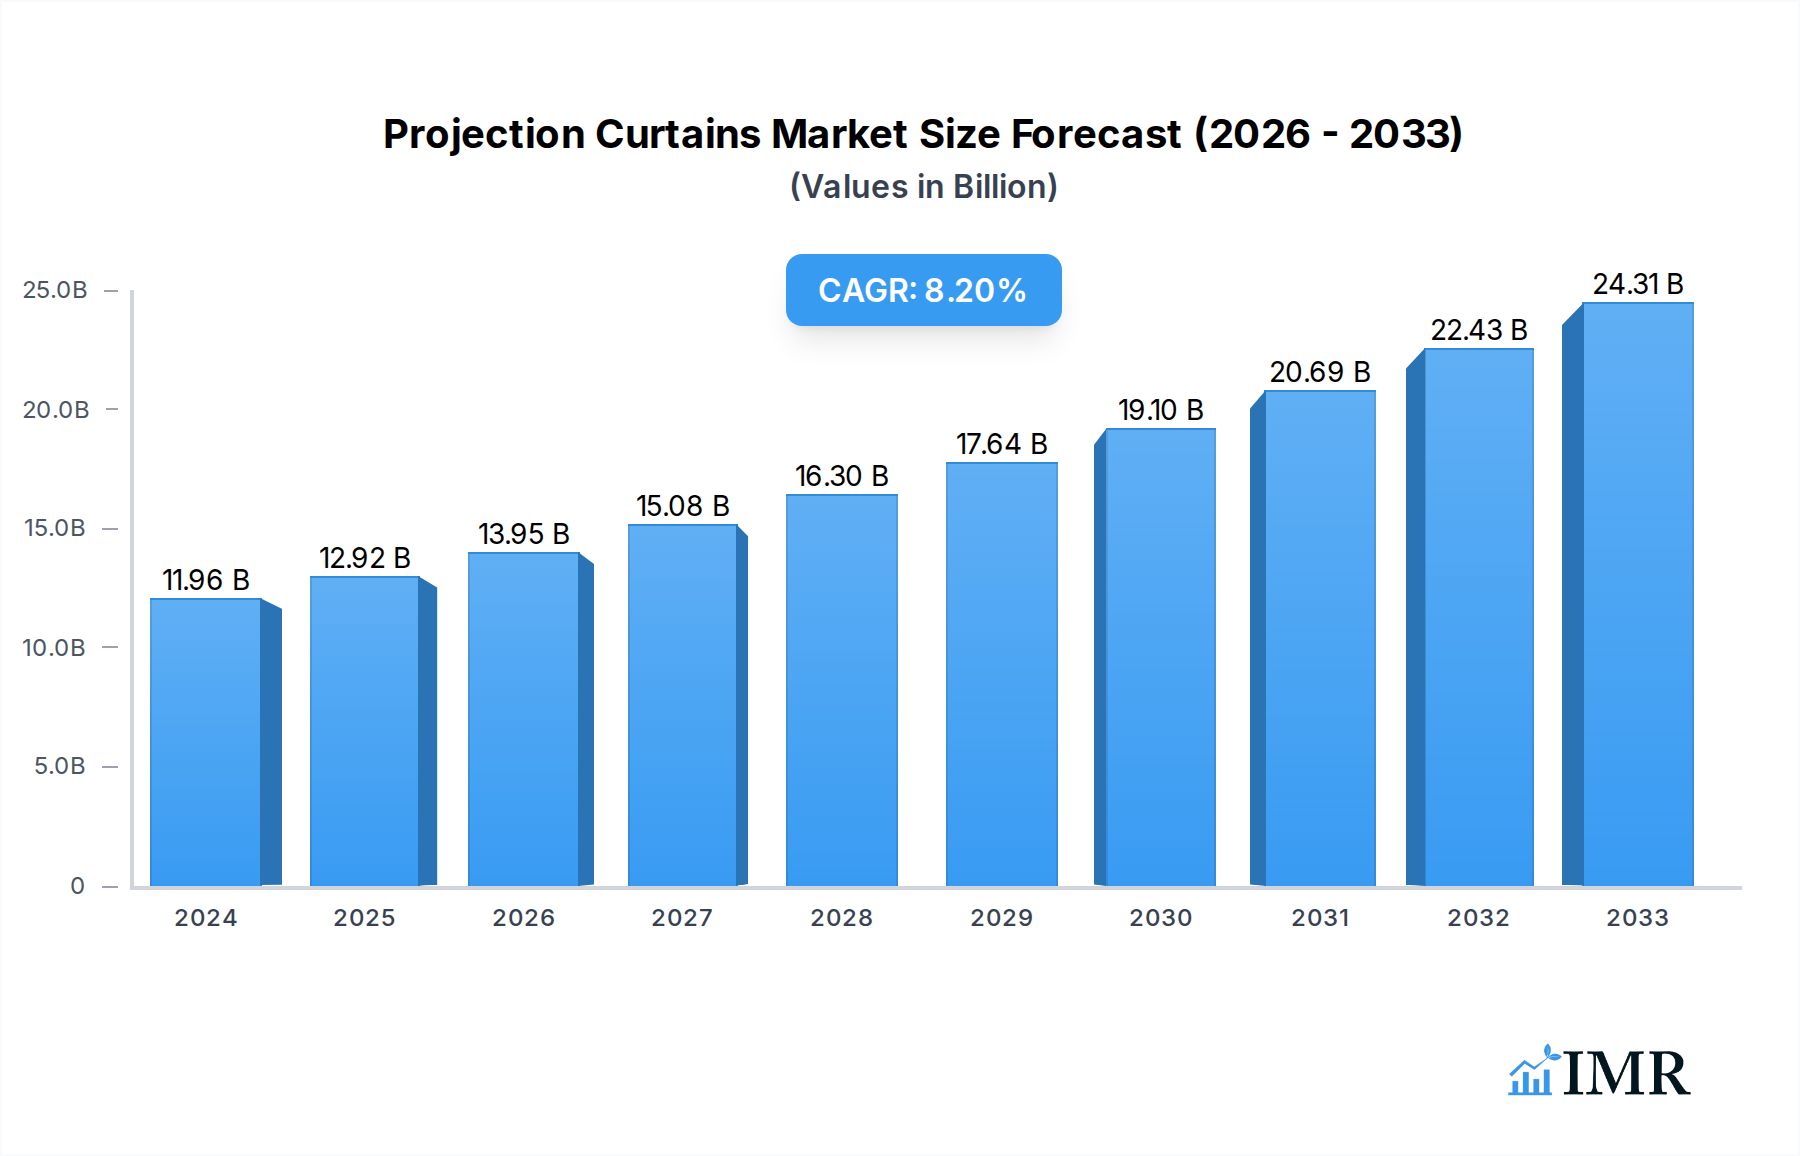
The global Projection Curtains market is poised for substantial growth, estimated at $11.96 billion in 2024, and is projected to expand at a robust Compound Annual Growth Rate (CAGR) of 8% over the forecast period of 2025-2033. This significant market expansion is driven by several key factors. The increasing adoption of home theaters and sophisticated audio-visual setups in residential spaces, coupled with the growing demand for immersive presentation experiences in commercial environments such as boardrooms, educational institutions, and entertainment venues, are primary growth catalysts. Furthermore, advancements in screen technology, including improved material science for better reflectivity and light management, and the development of innovative features like motorized retraction and integrated audio solutions, are contributing to market dynamism. The trend towards larger, higher-resolution displays, including 4K and 8K, necessitates projection screens that can deliver optimal image quality, further fueling market demand.

Projection Curtains Market Size (In Billion)
The market's trajectory is also influenced by emerging trends such as the integration of smart home technologies with projection systems, offering enhanced convenience and user experience. The growing popularity of large-format displays in public spaces, digital signage, and virtual reality (VR) applications also presents new avenues for growth. While the market demonstrates strong upward momentum, certain factors could present challenges. The initial cost of high-quality projection screens and the availability of alternative display technologies like large OLED panels in certain applications might pose restraints. However, the superior viewing experience and scalability offered by projection screens, especially in larger formats, are expected to maintain their competitive edge. The market is segmented by application into Household and Commercial, and by type into Electric and Unpowered, catering to diverse user needs and preferences. Leading companies like Da-Lite, EPV Screens, and Screen Innovations are continuously innovating to capture market share and drive technological advancements in this evolving sector.
Projection Curtains Company Market Share
Projection Curtains Market Dynamics & Structure
The global projection curtain market exhibits a moderately concentrated structure, with a mix of established global players and emerging regional manufacturers. Technological innovation remains a primary driver, fueled by advancements in screen materials, ambient light rejection capabilities, and automated deployment systems. The market is influenced by evolving regulatory frameworks, primarily concerning safety standards and environmental impact, though these are generally supportive of technological progress. Competitive product substitutes, such as large-format displays and interactive whiteboards, pose a challenge, yet projection curtains retain their appeal for their scalability, immersive experience, and cost-effectiveness in larger viewing scenarios. End-user demographics are diverse, spanning both residential consumers seeking enhanced home theater experiences and commercial clients in sectors like education, corporate presentations, and entertainment. Merger and acquisition (M&A) trends are observed as companies seek to expand their product portfolios, gain market access, and achieve economies of scale. For instance, the historical period (2019-2024) saw several strategic acquisitions aimed at consolidating market share.
- Market Concentration: Dominated by a few key global manufacturers, with a growing number of specialized regional players.
- Technological Innovation Drivers: Enhanced ambient light rejection (ALR) technology, advanced material science for improved image fidelity, smart integration for automated control, and development of ultra-short-throw (UST) compatible screens.
- Regulatory Frameworks: Focus on fire retardancy, material safety, and energy efficiency in automated systems.
- Competitive Product Substitutes: Large format LED displays, interactive flat panel displays (IFPDs), and direct view LED walls.
- End-User Demographics: Home theater enthusiasts, educational institutions, corporate offices, conference centers, entertainment venues, and digital signage applications.
- M&A Trends: Consolidation of smaller players, strategic alliances for technology sharing, and acquisitions by larger AV equipment manufacturers seeking to offer integrated solutions.
Projection Curtains Growth Trends & Insights
The global projection curtain market is poised for significant expansion throughout the study period (2019–2033). The base year (2025) estimates the market at approximately $8.5 billion, with a projected compound annual growth rate (CAGR) of 6.8% during the forecast period (2025–2033). This robust growth trajectory is underpinned by several key trends. Increasing consumer demand for premium home entertainment experiences, driven by the proliferation of high-resolution content and the desire for cinematic immersion at home, is a major catalyst. The commercial segment is witnessing accelerated adoption due to the growing emphasis on engaging presentations, collaborative workspaces, and advanced digital signage solutions across industries. Technological advancements are continuously enhancing the performance and versatility of projection curtains. Innovations in ambient light rejection (ALR) technology have made projection viable in brighter environments, significantly broadening its application scope beyond dedicated dark rooms. Furthermore, the development of specialized screen materials tailored for ultra-short-throw (UST) projectors is opening new avenues for space-saving and aesthetically pleasing projection setups.
The adoption rates of electric projection curtains are steadily increasing as consumers and businesses recognize the convenience and professional finish they offer. The shift towards more sophisticated audio-visual setups in both residential and commercial spaces fuels the demand for high-quality projection surfaces. Consumer behavior is evolving towards seeking integrated and seamless AV solutions. This trend favors projection curtains that can be easily deployed and retracted, often with smart home integration capabilities, contributing to a cleaner and more sophisticated aesthetic. The historical period (2019–2024) laid the groundwork for this expansion, with steady year-over-year growth driven by early adopters and the growing awareness of the benefits of high-quality projection. The estimated year (2025) represents a pivotal point where widespread adoption and technological maturity are set to propel the market into its next phase of accelerated growth. The increasing affordability of high-definition projectors and the continuous innovation in screen technologies are further democratizing access to superior visual experiences, further solidifying the market's upward trend.
Dominant Regions, Countries, or Segments in Projection Curtains
The Commercial segment is currently the dominant force driving growth within the global projection curtain market, representing a substantial share of the market value estimated at $5.2 billion in the base year (2025). This dominance is fueled by several interconnected factors. In North America and Europe, there is a strong and consistent demand from corporate sectors for high-quality projection solutions in meeting rooms, boardrooms, and training facilities. The increasing adoption of interactive and collaborative technologies in these environments necessitates robust projection surfaces that can deliver crisp visuals for presentations, video conferencing, and data visualization. Economic policies in these regions often encourage investment in advanced office infrastructure, directly benefiting the commercial projection curtain market.
Furthermore, the education sector in Asia-Pacific is a significant growth engine for commercial projection curtains. Government initiatives focused on digitizing classrooms and improving the learning experience are leading to widespread installations in schools and universities. The potential for market penetration in emerging economies within Asia-Pacific and Latin America, driven by rapid infrastructure development and a growing emphasis on modern educational tools, is immense. The market share within the commercial segment is further segmented by application:
- Corporate & Education: This sub-segment accounts for the largest portion, driven by the need for effective visual communication and learning tools. Estimated to reach $3.5 billion in 2025.
- Entertainment & Hospitality: Includes cinemas, theaters, event venues, and hotels, where large-format projection is crucial for immersive experiences. Projected to be valued at $1.2 billion in 2025.
- Digital Signage & Retail: Growing adoption for dynamic in-store advertising and information displays. Expected to reach $0.5 billion in 2025.
The Electric types of projection curtains also hold a leading position within the overall market, capturing a significant share estimated at $6.0 billion in 2025. The convenience, aesthetic appeal, and professional deployment associated with electric screens make them the preferred choice for both commercial and premium residential applications. Their integration with smart home systems and automated control interfaces further enhances their appeal, contributing to their dominance.
Projection Curtains Product Landscape
The projection curtain market is characterized by continuous product innovation focused on enhancing visual performance and user experience. Manufacturers are developing advanced screen materials with superior gain properties, wider viewing angles, and exceptional color accuracy. A key area of development is the integration of ambient light rejection (ALR) technology, enabling projection in well-lit rooms without significant degradation of image quality. Furthermore, the landscape is evolving to cater to the growing popularity of ultra-short-throw (UST) projectors, with specialized screen designs that minimize keystone distortion and maximize image uniformity. Product offerings range from fixed-frame screens for dedicated home theaters to retractable electric screens for versatile multipurpose spaces.
Key Drivers, Barriers & Challenges in Projection Curtains
The projection curtain market is propelled by several key drivers. Technological advancements in screen materials and projector compatibility are enhancing image quality and expanding application possibilities. The growing demand for immersive home entertainment and the increasing adoption of sophisticated AV setups in commercial environments are significant economic drivers. Supportive government initiatives in education and smart city projects also contribute to market expansion.
However, the market faces key challenges and restraints. The high initial cost of premium projection curtain systems can be a barrier for some consumers and smaller businesses. The availability and performance of competing display technologies, such as large LED panels, pose a constant competitive pressure. Supply chain disruptions and the fluctuating costs of raw materials can impact manufacturing and pricing. Furthermore, regulatory compliance regarding fire safety and material standards adds to production complexity.
Emerging Opportunities in Projection Curtains
Emerging opportunities in the projection curtain industry lie in the expansion of smart home integration and the development of eco-friendly and sustainable screen materials. The increasing adoption of virtual and augmented reality (VR/AR) experiences, which can be enhanced by high-quality projection surfaces for shared viewing, presents a novel application area. Furthermore, the untapped potential in developing economies and the growing demand for interactive projection solutions in education and corporate training offer significant growth avenues. The market can also capitalize on the trend towards personalized and customizable display solutions for unique architectural spaces.
Growth Accelerators in the Projection Curtains Industry
Several catalysts are accelerating the long-term growth of the projection curtain industry. Continuous breakthroughs in material science, leading to screens with unparalleled color reproduction and light management, are a primary accelerator. Strategic partnerships between projector manufacturers and screen producers are fostering integrated solutions and driving innovation. The global expansion of high-speed internet infrastructure is enabling higher quality content streaming, thus boosting demand for superior viewing experiences. Furthermore, market expansion strategies focusing on emerging economies and niche applications, such as large-format displays for outdoor events and retail environments, are crucial growth accelerators.
Key Players Shaping the Projection Curtains Market
- Da-Lite
- EPV Screens
- Screen Excellence
- dnp denmark
- Goo Systems
- Screen Innovations
- Draper
- Grandview Screens
- Severtson
- Elite Screens
- Optoma
- Stewart Filmscreen
Notable Milestones in Projection Curtains Sector
- 2019: Introduction of advanced ALR screen technologies offering significantly improved performance in ambient light conditions.
- 2020: Increased focus on sustainable material sourcing and manufacturing processes by leading companies.
- 2021: Significant rise in the adoption of electric and automated projection screens for home automation integration.
- 2022: Launch of specialized screens designed for Ultra-Short-Throw (UST) projectors, enabling space-saving installations.
- 2023: Emergence of smart projection curtain solutions with app-based control and integration with voice assistants.
- 2024: Increased investment in research and development for next-generation screen materials with enhanced durability and visual fidelity.
In-Depth Projection Curtains Market Outlook
The outlook for the projection curtain market remains exceptionally strong, driven by a confluence of technological advancements and evolving consumer and commercial demands. The pervasive trend towards immersive visual experiences, whether for home entertainment or professional presentations, will continue to fuel demand for high-performance projection surfaces. Innovations in ambient light rejection and ultra-short-throw compatibility are expanding application horizons, making projection curtains a viable and attractive option in an ever-wider array of environments. Strategic collaborations, ongoing research into advanced materials, and a growing emphasis on smart home integration are set to further accelerate market growth, solidifying projection curtains as a cornerstone of modern visual communication and entertainment solutions.
Projection Curtains Segmentation
-
1. Application
- 1.1. Household
- 1.2. Commercial
-
2. Types
- 2.1. Electric
- 2.2. Unpowered
Projection Curtains Segmentation By Geography
-
1. North America
- 1.1. United States
- 1.2. Canada
- 1.3. Mexico
-
2. South America
- 2.1. Brazil
- 2.2. Argentina
- 2.3. Rest of South America
-
3. Europe
- 3.1. United Kingdom
- 3.2. Germany
- 3.3. France
- 3.4. Italy
- 3.5. Spain
- 3.6. Russia
- 3.7. Benelux
- 3.8. Nordics
- 3.9. Rest of Europe
-
4. Middle East & Africa
- 4.1. Turkey
- 4.2. Israel
- 4.3. GCC
- 4.4. North Africa
- 4.5. South Africa
- 4.6. Rest of Middle East & Africa
-
5. Asia Pacific
- 5.1. China
- 5.2. India
- 5.3. Japan
- 5.4. South Korea
- 5.5. ASEAN
- 5.6. Oceania
- 5.7. Rest of Asia Pacific
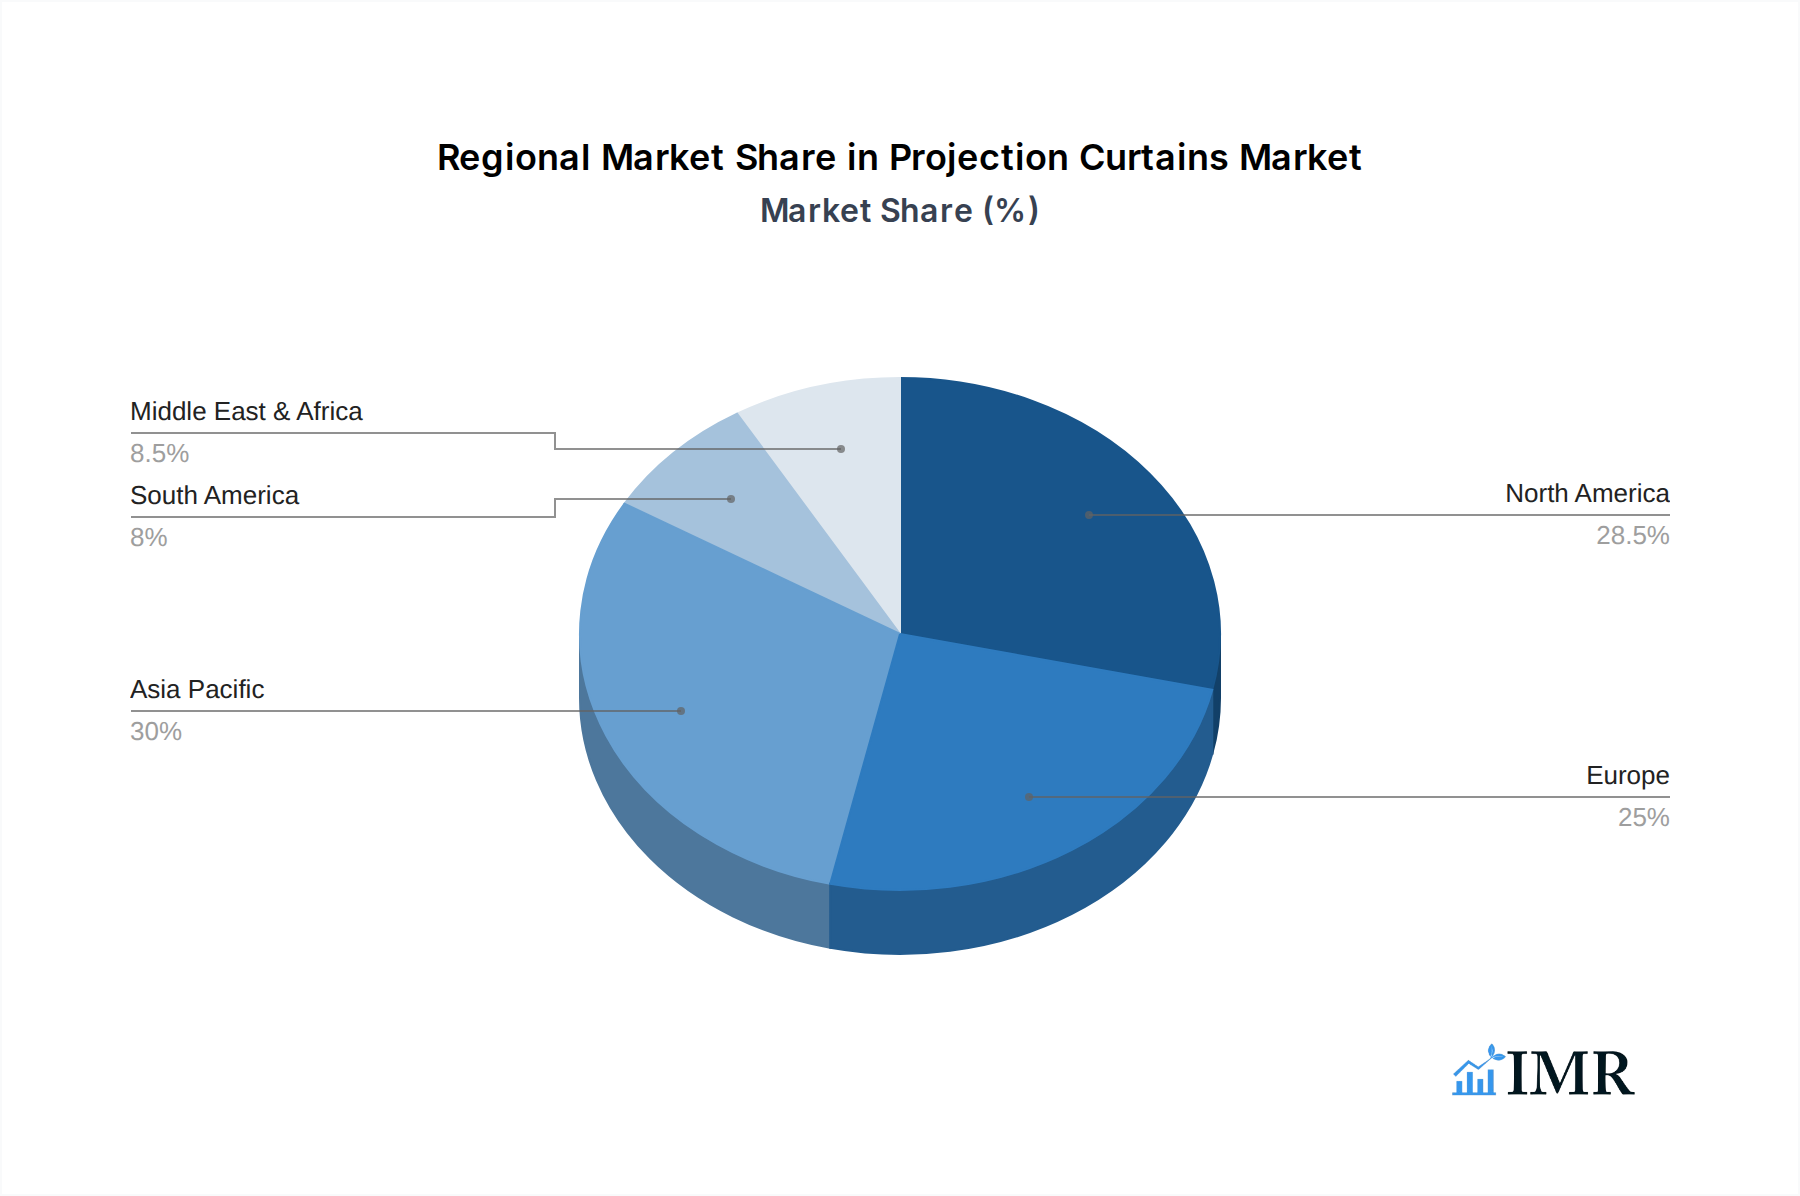
Projection Curtains Regional Market Share
Geographic Coverage of Projection Curtains
Projection Curtains REPORT HIGHLIGHTS
| Aspects | Details |
|---|---|
| Study Period | 2020-2034 |
| Base Year | 2025 |
| Estimated Year | 2026 |
| Forecast Period | 2026-2034 |
| Historical Period | 2020-2025 |
| Growth Rate | CAGR of 8% from 2020-2034 |
| Segmentation |
|
Table of Contents
- 1. Introduction
- 1.1. Research Scope
- 1.2. Market Segmentation
- 1.3. Research Methodology
- 1.4. Definitions and Assumptions
- 2. Executive Summary
- 2.1. Introduction
- 3. Market Dynamics
- 3.1. Introduction
- 3.2. Market Drivers
- 3.3. Market Restrains
- 3.4. Market Trends
- 4. Market Factor Analysis
- 4.1. Porters Five Forces
- 4.2. Supply/Value Chain
- 4.3. PESTEL analysis
- 4.4. Market Entropy
- 4.5. Patent/Trademark Analysis
- 5. Global Projection Curtains Analysis, Insights and Forecast, 2020-2032
- 5.1. Market Analysis, Insights and Forecast - by Application
- 5.1.1. Household
- 5.1.2. Commercial
- 5.2. Market Analysis, Insights and Forecast - by Types
- 5.2.1. Electric
- 5.2.2. Unpowered
- 5.3. Market Analysis, Insights and Forecast - by Region
- 5.3.1. North America
- 5.3.2. South America
- 5.3.3. Europe
- 5.3.4. Middle East & Africa
- 5.3.5. Asia Pacific
- 5.1. Market Analysis, Insights and Forecast - by Application
- 6. North America Projection Curtains Analysis, Insights and Forecast, 2020-2032
- 6.1. Market Analysis, Insights and Forecast - by Application
- 6.1.1. Household
- 6.1.2. Commercial
- 6.2. Market Analysis, Insights and Forecast - by Types
- 6.2.1. Electric
- 6.2.2. Unpowered
- 6.1. Market Analysis, Insights and Forecast - by Application
- 7. South America Projection Curtains Analysis, Insights and Forecast, 2020-2032
- 7.1. Market Analysis, Insights and Forecast - by Application
- 7.1.1. Household
- 7.1.2. Commercial
- 7.2. Market Analysis, Insights and Forecast - by Types
- 7.2.1. Electric
- 7.2.2. Unpowered
- 7.1. Market Analysis, Insights and Forecast - by Application
- 8. Europe Projection Curtains Analysis, Insights and Forecast, 2020-2032
- 8.1. Market Analysis, Insights and Forecast - by Application
- 8.1.1. Household
- 8.1.2. Commercial
- 8.2. Market Analysis, Insights and Forecast - by Types
- 8.2.1. Electric
- 8.2.2. Unpowered
- 8.1. Market Analysis, Insights and Forecast - by Application
- 9. Middle East & Africa Projection Curtains Analysis, Insights and Forecast, 2020-2032
- 9.1. Market Analysis, Insights and Forecast - by Application
- 9.1.1. Household
- 9.1.2. Commercial
- 9.2. Market Analysis, Insights and Forecast - by Types
- 9.2.1. Electric
- 9.2.2. Unpowered
- 9.1. Market Analysis, Insights and Forecast - by Application
- 10. Asia Pacific Projection Curtains Analysis, Insights and Forecast, 2020-2032
- 10.1. Market Analysis, Insights and Forecast - by Application
- 10.1.1. Household
- 10.1.2. Commercial
- 10.2. Market Analysis, Insights and Forecast - by Types
- 10.2.1. Electric
- 10.2.2. Unpowered
- 10.1. Market Analysis, Insights and Forecast - by Application
- 11. Competitive Analysis
- 11.1. Global Market Share Analysis 2025
- 11.2. Company Profiles
- 11.2.1 Da-Lite
- 11.2.1.1. Overview
- 11.2.1.2. Products
- 11.2.1.3. SWOT Analysis
- 11.2.1.4. Recent Developments
- 11.2.1.5. Financials (Based on Availability)
- 11.2.2 EPV Screens
- 11.2.2.1. Overview
- 11.2.2.2. Products
- 11.2.2.3. SWOT Analysis
- 11.2.2.4. Recent Developments
- 11.2.2.5. Financials (Based on Availability)
- 11.2.3 Screen Excellence
- 11.2.3.1. Overview
- 11.2.3.2. Products
- 11.2.3.3. SWOT Analysis
- 11.2.3.4. Recent Developments
- 11.2.3.5. Financials (Based on Availability)
- 11.2.4 dnp denmark
- 11.2.4.1. Overview
- 11.2.4.2. Products
- 11.2.4.3. SWOT Analysis
- 11.2.4.4. Recent Developments
- 11.2.4.5. Financials (Based on Availability)
- 11.2.5 Goo Systems
- 11.2.5.1. Overview
- 11.2.5.2. Products
- 11.2.5.3. SWOT Analysis
- 11.2.5.4. Recent Developments
- 11.2.5.5. Financials (Based on Availability)
- 11.2.6 Screen Innovations
- 11.2.6.1. Overview
- 11.2.6.2. Products
- 11.2.6.3. SWOT Analysis
- 11.2.6.4. Recent Developments
- 11.2.6.5. Financials (Based on Availability)
- 11.2.7 Draper
- 11.2.7.1. Overview
- 11.2.7.2. Products
- 11.2.7.3. SWOT Analysis
- 11.2.7.4. Recent Developments
- 11.2.7.5. Financials (Based on Availability)
- 11.2.8 Grandview Screens
- 11.2.8.1. Overview
- 11.2.8.2. Products
- 11.2.8.3. SWOT Analysis
- 11.2.8.4. Recent Developments
- 11.2.8.5. Financials (Based on Availability)
- 11.2.9 Severtson
- 11.2.9.1. Overview
- 11.2.9.2. Products
- 11.2.9.3. SWOT Analysis
- 11.2.9.4. Recent Developments
- 11.2.9.5. Financials (Based on Availability)
- 11.2.10 Elite Screens
- 11.2.10.1. Overview
- 11.2.10.2. Products
- 11.2.10.3. SWOT Analysis
- 11.2.10.4. Recent Developments
- 11.2.10.5. Financials (Based on Availability)
- 11.2.11 Optoma
- 11.2.11.1. Overview
- 11.2.11.2. Products
- 11.2.11.3. SWOT Analysis
- 11.2.11.4. Recent Developments
- 11.2.11.5. Financials (Based on Availability)
- 11.2.12 Stewart Filmscreen
- 11.2.12.1. Overview
- 11.2.12.2. Products
- 11.2.12.3. SWOT Analysis
- 11.2.12.4. Recent Developments
- 11.2.12.5. Financials (Based on Availability)
- 11.2.1 Da-Lite
List of Figures
- Figure 1: Global Projection Curtains Revenue Breakdown (undefined, %) by Region 2025 & 2033
- Figure 2: North America Projection Curtains Revenue (undefined), by Application 2025 & 2033
- Figure 3: North America Projection Curtains Revenue Share (%), by Application 2025 & 2033
- Figure 4: North America Projection Curtains Revenue (undefined), by Types 2025 & 2033
- Figure 5: North America Projection Curtains Revenue Share (%), by Types 2025 & 2033
- Figure 6: North America Projection Curtains Revenue (undefined), by Country 2025 & 2033
- Figure 7: North America Projection Curtains Revenue Share (%), by Country 2025 & 2033
- Figure 8: South America Projection Curtains Revenue (undefined), by Application 2025 & 2033
- Figure 9: South America Projection Curtains Revenue Share (%), by Application 2025 & 2033
- Figure 10: South America Projection Curtains Revenue (undefined), by Types 2025 & 2033
- Figure 11: South America Projection Curtains Revenue Share (%), by Types 2025 & 2033
- Figure 12: South America Projection Curtains Revenue (undefined), by Country 2025 & 2033
- Figure 13: South America Projection Curtains Revenue Share (%), by Country 2025 & 2033
- Figure 14: Europe Projection Curtains Revenue (undefined), by Application 2025 & 2033
- Figure 15: Europe Projection Curtains Revenue Share (%), by Application 2025 & 2033
- Figure 16: Europe Projection Curtains Revenue (undefined), by Types 2025 & 2033
- Figure 17: Europe Projection Curtains Revenue Share (%), by Types 2025 & 2033
- Figure 18: Europe Projection Curtains Revenue (undefined), by Country 2025 & 2033
- Figure 19: Europe Projection Curtains Revenue Share (%), by Country 2025 & 2033
- Figure 20: Middle East & Africa Projection Curtains Revenue (undefined), by Application 2025 & 2033
- Figure 21: Middle East & Africa Projection Curtains Revenue Share (%), by Application 2025 & 2033
- Figure 22: Middle East & Africa Projection Curtains Revenue (undefined), by Types 2025 & 2033
- Figure 23: Middle East & Africa Projection Curtains Revenue Share (%), by Types 2025 & 2033
- Figure 24: Middle East & Africa Projection Curtains Revenue (undefined), by Country 2025 & 2033
- Figure 25: Middle East & Africa Projection Curtains Revenue Share (%), by Country 2025 & 2033
- Figure 26: Asia Pacific Projection Curtains Revenue (undefined), by Application 2025 & 2033
- Figure 27: Asia Pacific Projection Curtains Revenue Share (%), by Application 2025 & 2033
- Figure 28: Asia Pacific Projection Curtains Revenue (undefined), by Types 2025 & 2033
- Figure 29: Asia Pacific Projection Curtains Revenue Share (%), by Types 2025 & 2033
- Figure 30: Asia Pacific Projection Curtains Revenue (undefined), by Country 2025 & 2033
- Figure 31: Asia Pacific Projection Curtains Revenue Share (%), by Country 2025 & 2033
List of Tables
- Table 1: Global Projection Curtains Revenue undefined Forecast, by Application 2020 & 2033
- Table 2: Global Projection Curtains Revenue undefined Forecast, by Types 2020 & 2033
- Table 3: Global Projection Curtains Revenue undefined Forecast, by Region 2020 & 2033
- Table 4: Global Projection Curtains Revenue undefined Forecast, by Application 2020 & 2033
- Table 5: Global Projection Curtains Revenue undefined Forecast, by Types 2020 & 2033
- Table 6: Global Projection Curtains Revenue undefined Forecast, by Country 2020 & 2033
- Table 7: United States Projection Curtains Revenue (undefined) Forecast, by Application 2020 & 2033
- Table 8: Canada Projection Curtains Revenue (undefined) Forecast, by Application 2020 & 2033
- Table 9: Mexico Projection Curtains Revenue (undefined) Forecast, by Application 2020 & 2033
- Table 10: Global Projection Curtains Revenue undefined Forecast, by Application 2020 & 2033
- Table 11: Global Projection Curtains Revenue undefined Forecast, by Types 2020 & 2033
- Table 12: Global Projection Curtains Revenue undefined Forecast, by Country 2020 & 2033
- Table 13: Brazil Projection Curtains Revenue (undefined) Forecast, by Application 2020 & 2033
- Table 14: Argentina Projection Curtains Revenue (undefined) Forecast, by Application 2020 & 2033
- Table 15: Rest of South America Projection Curtains Revenue (undefined) Forecast, by Application 2020 & 2033
- Table 16: Global Projection Curtains Revenue undefined Forecast, by Application 2020 & 2033
- Table 17: Global Projection Curtains Revenue undefined Forecast, by Types 2020 & 2033
- Table 18: Global Projection Curtains Revenue undefined Forecast, by Country 2020 & 2033
- Table 19: United Kingdom Projection Curtains Revenue (undefined) Forecast, by Application 2020 & 2033
- Table 20: Germany Projection Curtains Revenue (undefined) Forecast, by Application 2020 & 2033
- Table 21: France Projection Curtains Revenue (undefined) Forecast, by Application 2020 & 2033
- Table 22: Italy Projection Curtains Revenue (undefined) Forecast, by Application 2020 & 2033
- Table 23: Spain Projection Curtains Revenue (undefined) Forecast, by Application 2020 & 2033
- Table 24: Russia Projection Curtains Revenue (undefined) Forecast, by Application 2020 & 2033
- Table 25: Benelux Projection Curtains Revenue (undefined) Forecast, by Application 2020 & 2033
- Table 26: Nordics Projection Curtains Revenue (undefined) Forecast, by Application 2020 & 2033
- Table 27: Rest of Europe Projection Curtains Revenue (undefined) Forecast, by Application 2020 & 2033
- Table 28: Global Projection Curtains Revenue undefined Forecast, by Application 2020 & 2033
- Table 29: Global Projection Curtains Revenue undefined Forecast, by Types 2020 & 2033
- Table 30: Global Projection Curtains Revenue undefined Forecast, by Country 2020 & 2033
- Table 31: Turkey Projection Curtains Revenue (undefined) Forecast, by Application 2020 & 2033
- Table 32: Israel Projection Curtains Revenue (undefined) Forecast, by Application 2020 & 2033
- Table 33: GCC Projection Curtains Revenue (undefined) Forecast, by Application 2020 & 2033
- Table 34: North Africa Projection Curtains Revenue (undefined) Forecast, by Application 2020 & 2033
- Table 35: South Africa Projection Curtains Revenue (undefined) Forecast, by Application 2020 & 2033
- Table 36: Rest of Middle East & Africa Projection Curtains Revenue (undefined) Forecast, by Application 2020 & 2033
- Table 37: Global Projection Curtains Revenue undefined Forecast, by Application 2020 & 2033
- Table 38: Global Projection Curtains Revenue undefined Forecast, by Types 2020 & 2033
- Table 39: Global Projection Curtains Revenue undefined Forecast, by Country 2020 & 2033
- Table 40: China Projection Curtains Revenue (undefined) Forecast, by Application 2020 & 2033
- Table 41: India Projection Curtains Revenue (undefined) Forecast, by Application 2020 & 2033
- Table 42: Japan Projection Curtains Revenue (undefined) Forecast, by Application 2020 & 2033
- Table 43: South Korea Projection Curtains Revenue (undefined) Forecast, by Application 2020 & 2033
- Table 44: ASEAN Projection Curtains Revenue (undefined) Forecast, by Application 2020 & 2033
- Table 45: Oceania Projection Curtains Revenue (undefined) Forecast, by Application 2020 & 2033
- Table 46: Rest of Asia Pacific Projection Curtains Revenue (undefined) Forecast, by Application 2020 & 2033
Frequently Asked Questions
1. What is the projected Compound Annual Growth Rate (CAGR) of the Projection Curtains?
The projected CAGR is approximately 8%.
2. Which companies are prominent players in the Projection Curtains?
Key companies in the market include Da-Lite, EPV Screens, Screen Excellence, dnp denmark, Goo Systems, Screen Innovations, Draper, Grandview Screens, Severtson, Elite Screens, Optoma, Stewart Filmscreen.
3. What are the main segments of the Projection Curtains?
The market segments include Application, Types.
4. Can you provide details about the market size?
The market size is estimated to be USD XXX N/A as of 2022.
5. What are some drivers contributing to market growth?
N/A
6. What are the notable trends driving market growth?
N/A
7. Are there any restraints impacting market growth?
N/A
8. Can you provide examples of recent developments in the market?
N/A
9. What pricing options are available for accessing the report?
Pricing options include single-user, multi-user, and enterprise licenses priced at USD 4900.00, USD 7350.00, and USD 9800.00 respectively.
10. Is the market size provided in terms of value or volume?
The market size is provided in terms of value, measured in N/A.
11. Are there any specific market keywords associated with the report?
Yes, the market keyword associated with the report is "Projection Curtains," which aids in identifying and referencing the specific market segment covered.
12. How do I determine which pricing option suits my needs best?
The pricing options vary based on user requirements and access needs. Individual users may opt for single-user licenses, while businesses requiring broader access may choose multi-user or enterprise licenses for cost-effective access to the report.
13. Are there any additional resources or data provided in the Projection Curtains report?
While the report offers comprehensive insights, it's advisable to review the specific contents or supplementary materials provided to ascertain if additional resources or data are available.
14. How can I stay updated on further developments or reports in the Projection Curtains?
To stay informed about further developments, trends, and reports in the Projection Curtains, consider subscribing to industry newsletters, following relevant companies and organizations, or regularly checking reputable industry news sources and publications.
Methodology
Step 1 - Identification of Relevant Samples Size from Population Database


Step 2 - Approaches for Defining Global Market Size (Value, Volume* & Price*)

Note*: In applicable scenarios
Step 3 - Data Sources
Primary Research
- Web Analytics
- Survey Reports
- Research Institute
- Latest Research Reports
- Opinion Leaders
Secondary Research
- Annual Reports
- White Paper
- Latest Press Release
- Industry Association
- Paid Database
- Investor Presentations

Step 4 - Data Triangulation
Involves using different sources of information in order to increase the validity of a study
These sources are likely to be stakeholders in a program - participants, other researchers, program staff, other community members, and so on.
Then we put all data in single framework & apply various statistical tools to find out the dynamic on the market.
During the analysis stage, feedback from the stakeholder groups would be compared to determine areas of agreement as well as areas of divergence