

Key Insights
The global Service Robots market is poised for remarkable expansion, projected to reach USD 33965.8 million by 2025, driven by an impressive Compound Annual Growth Rate (CAGR) of 21.4% through 2033. This robust growth is fueled by a confluence of factors, including the increasing demand for automation across various sectors, advancements in artificial intelligence and machine learning, and the growing need for efficient and cost-effective solutions. Household robots, encompassing cleaning and vacuuming robots, are witnessing significant adoption due to their ability to enhance convenience and quality of life. Simultaneously, the healthcare sector is a major growth engine, with nursing, rehabilitation, and surgical robots transforming patient care, improving surgical precision, and aiding in recovery processes. Educational and entertainment robots are also gaining traction, offering engaging learning experiences and interactive companionship.
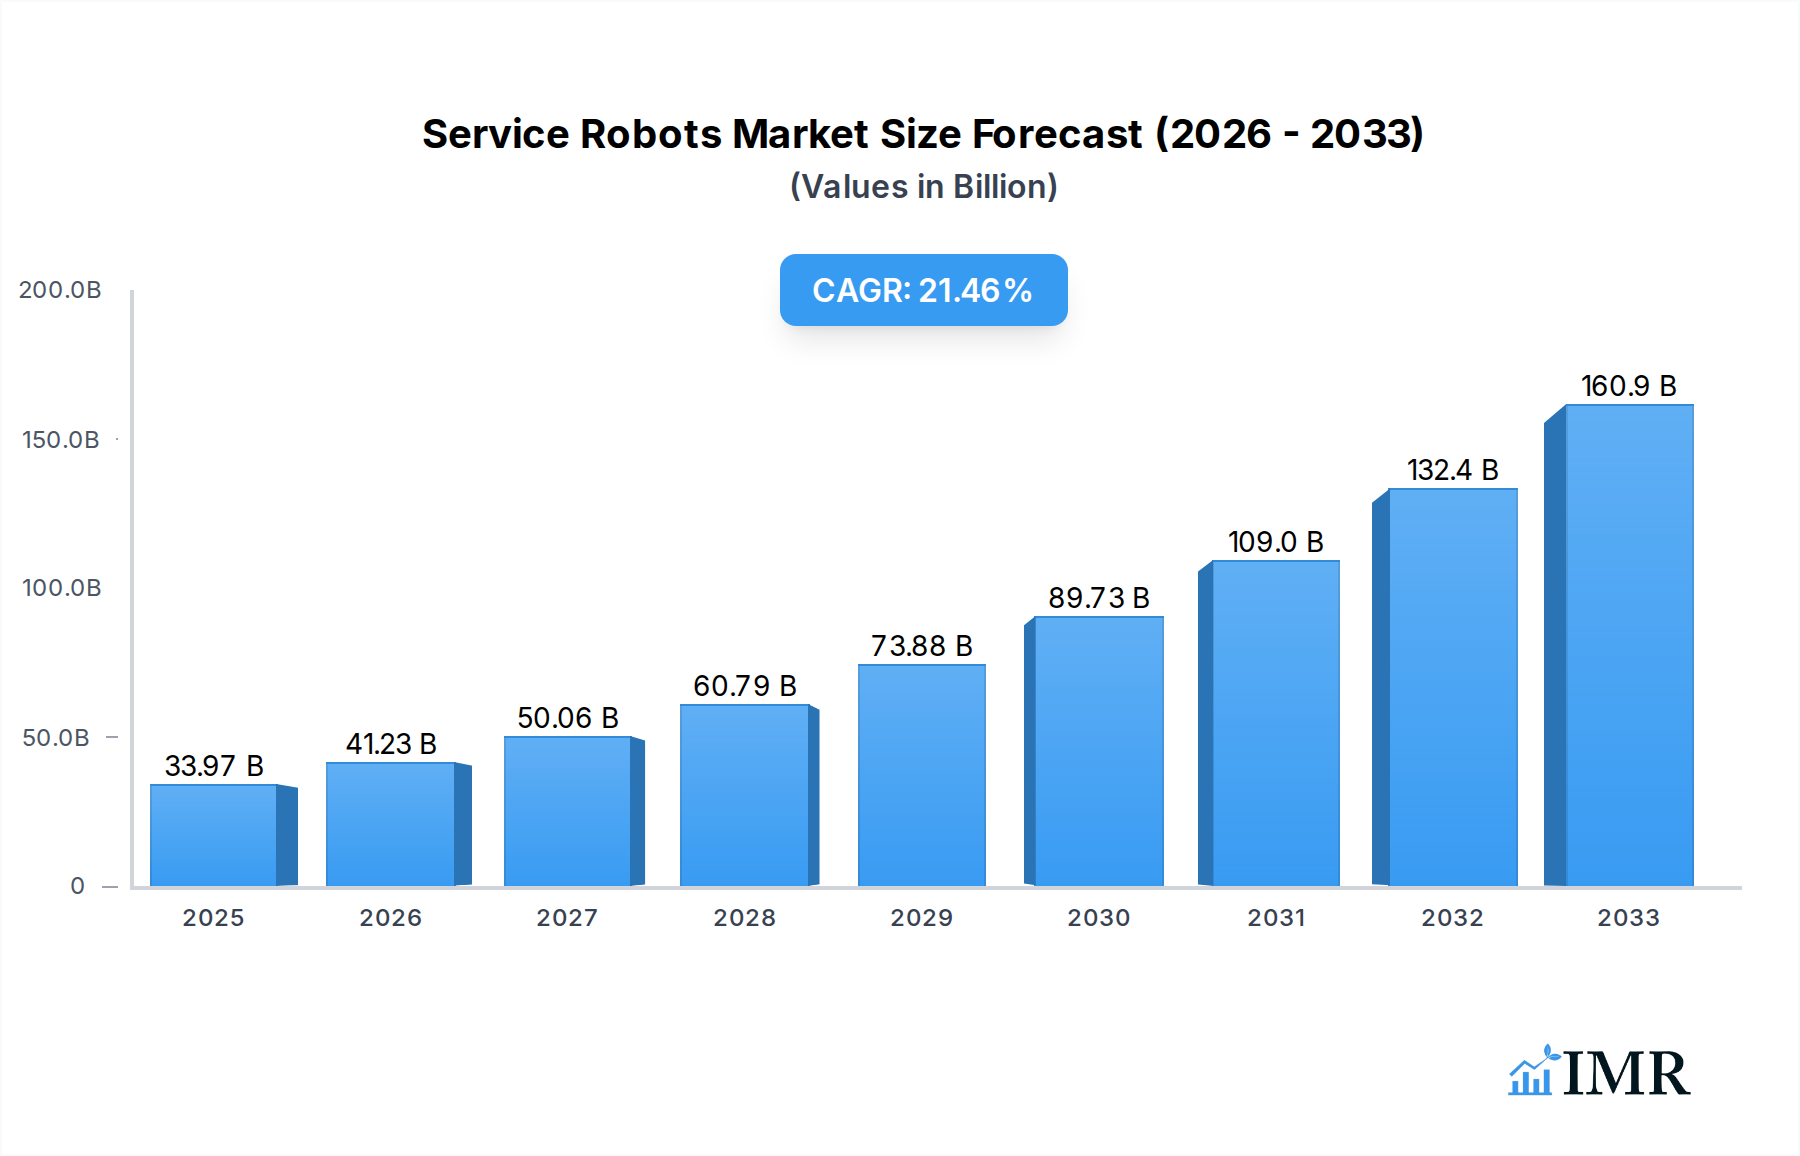
Service Robots Market Size (In Billion)
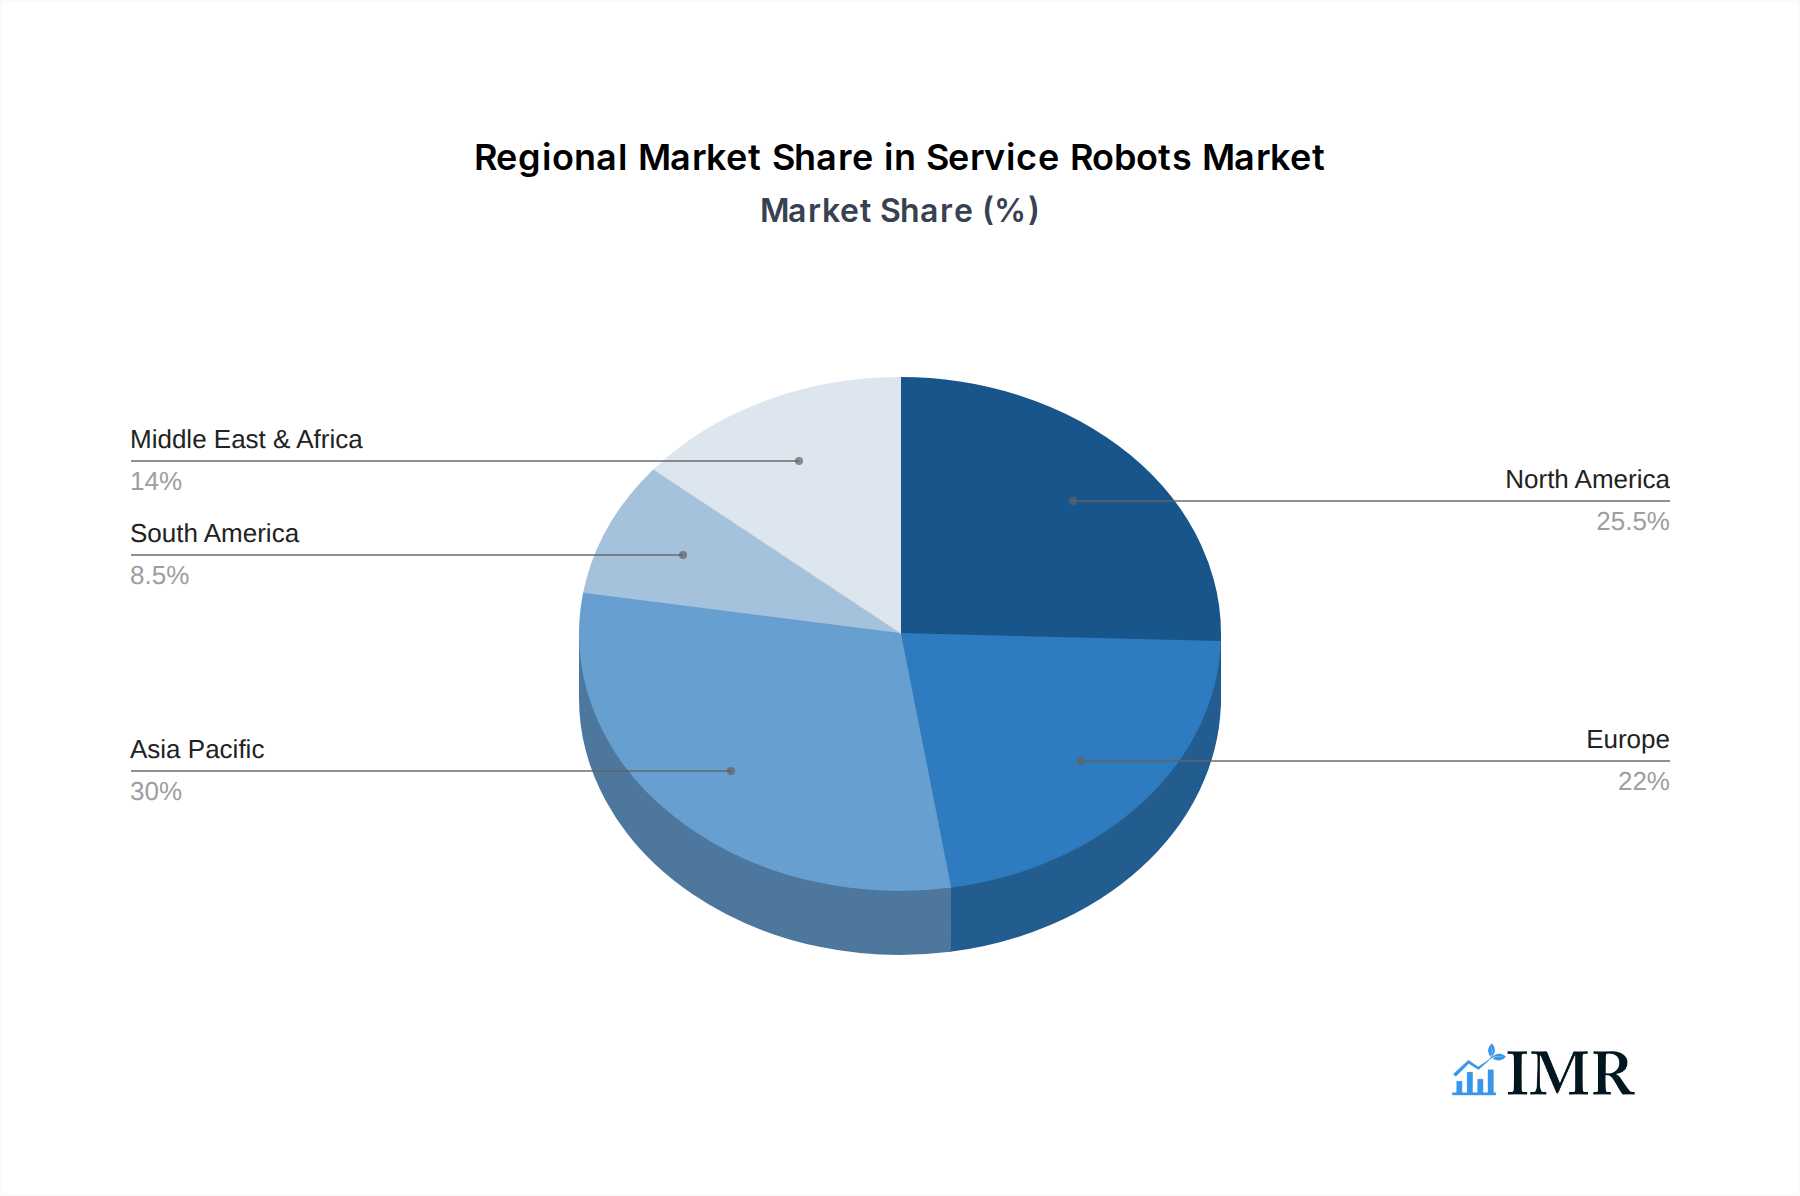
The service robot landscape is characterized by diverse applications and a dynamic competitive environment. Beyond household and healthcare, significant opportunities lie in agriculture, forestry, livestock farming, and fisheries, where robots are being deployed for precision farming, monitoring, and automated tasks, contributing to increased productivity and sustainability. While the market exhibits strong growth, potential restraints such as high initial investment costs, regulatory hurdles, and the need for skilled maintenance personnel could present challenges. However, ongoing innovation in robot design, enhanced sensor technologies, and the development of more affordable solutions are expected to mitigate these restraints. Leading companies like Intuitive Surgical, iRobot, and Dyson are at the forefront of this revolution, introducing cutting-edge technologies and expanding market reach, indicating a highly competitive yet lucrative market. The Asia Pacific region, particularly China and Japan, is expected to emerge as a dominant force due to rapid technological adoption and a substantial manufacturing base.

Service Robots Company Market Share
This in-depth report provides a detailed analysis of the global Service Robots market, encompassing a comprehensive study period from 2019 to 2033, with the base and estimated year of 2025 and a forecast period spanning 2025–2033. The report meticulously examines the market's evolution, driven by technological advancements and increasing adoption across various sectors. With a focus on both parent and child markets, this report offers actionable insights for industry stakeholders, investors, and strategists. All quantitative values are presented in million units.
Service Robots Market Dynamics & Structure
The global Service Robots market exhibits a moderately concentrated structure, with a few key players holding significant market share, especially in specialized segments like surgical and industrial robotics. Technological innovation is the primary driver, fueled by advancements in Artificial Intelligence (AI), machine learning, computer vision, and sensor technologies. These innovations enable robots to perform increasingly complex tasks with greater autonomy and precision. The regulatory landscape is evolving, with a growing emphasis on safety standards, data privacy, and ethical considerations, particularly for robots operating in close proximity to humans. Competitive product substitutes include traditional automation solutions and human labor, though the unique capabilities of service robots are increasingly differentiating them. End-user demographics are expanding, with growing demand from healthcare, logistics, agriculture, and household sectors. Mergers and Acquisitions (M&A) are a significant trend, with companies consolidating to acquire new technologies, expand market reach, and achieve economies of scale.
- Market Concentration: Top 5 companies hold approximately 45% of the market share in 2025.
- Technological Innovation: Driven by AI, ML, and advanced sensor integration.
- Regulatory Frameworks: Focus on safety certifications (e.g., ISO standards) and data security.
- Competitive Substitutes: Human labor, traditional automation systems.
- End-User Demographics: Expanding across healthcare, logistics, agriculture, and residential sectors.
- M&A Trends: Average of 15 significant M&A deals per year observed between 2021-2024.
Service Robots Growth Trends & Insights
The global Service Robots market is poised for remarkable growth, projected to expand at a Compound Annual Growth Rate (CAGR) of 17.5% from 2025 to 2033. This robust expansion is underpinned by a confluence of factors, including the escalating demand for automation in diverse industries and the continuous refinement of robotic capabilities. In the base year of 2025, the global market size is estimated at $35,500 million units, with projections indicating a significant surge by the end of the forecast period. Adoption rates are accelerating, particularly in sectors such as healthcare, where nursing and rehabilitation robots are proving instrumental in enhancing patient care and alleviating the burden on medical professionals. Medical robots, including surgical robots, are experiencing a surge in demand due to their precision and minimally invasive capabilities, driving down recovery times and improving patient outcomes.
In the household segment, cleaning robots, encompassing vacuuming and mopping robots, have achieved widespread market penetration, becoming commonplace in many homes globally. The increasing disposable incomes and a growing preference for convenience are key drivers here. Furthermore, the education and entertainment sectors are witnessing the integration of sophisticated robots designed to engage and educate younger generations, fostering early interest in STEM fields. Agricultural robots are also gaining traction, addressing labor shortages and enhancing efficiency in farming operations through tasks like automated harvesting and crop monitoring. The ongoing technological disruptions, including advancements in swarm robotics and collaborative robots (cobots), are further shaping the market by enabling robots to work alongside humans seamlessly and efficiently.
Consumer behavior is also shifting, with a greater acceptance and expectation of robotic assistance in daily life. The convenience offered by personal mobility assist robots for the elderly and individuals with disabilities is a critical factor in their growing adoption. Pet exercising robots are also carving out a niche, catering to the evolving needs of pet owners in busy urban environments. The underlying economic factors, such as the rising cost of labor and the need for increased productivity, are compelling businesses and individuals alike to invest in service robot solutions. The continued investment in research and development by leading companies such as Intuitive Surgical, iRobot, and Dyson is ensuring a steady stream of innovative products that further stimulate market demand. The penetration of these robots into less explored segments like livestock farming, with milking robots leading the charge, signals a broad and deep integration across the entire service robotics ecosystem.
Dominant Regions, Countries, or Segments in Service Robots
The Medical Robots segment, particularly Surgical Robots, is a dominant force driving growth in the global Service Robots market. In 2025, this segment is estimated to hold a market share of approximately 28%, demonstrating its critical importance and rapid expansion. The increasing prevalence of chronic diseases, an aging global population, and the relentless pursuit of enhanced surgical precision and patient recovery are the primary catalysts for this dominance. Countries like the United States, Germany, and Japan are at the forefront of surgical robot adoption, supported by advanced healthcare infrastructure, high R&D spending, and favorable reimbursement policies.
North America, led by the United States, is the dominant region, accounting for an estimated 35% of the global Service Robots market in 2025. This leadership is attributed to substantial investments in medical and healthcare robotics, coupled with a strong presence of innovative companies. The region's robust economy and high disposable income also fuel the adoption of household robots, including vacuuming and mopping robots, contributing significantly to the overall market size.
- Dominant Segment: Medical Robots (especially Surgical Robots)
- Market Share (2025): ~28%
- Key Drivers: Aging population, chronic disease prevalence, demand for minimally invasive procedures, advancements in robotic surgery technology.
- Leading Countries: United States, Germany, Japan.
- Dominant Region: North America
- Market Share (2025): ~35%
- Key Drivers: High healthcare spending, strong R&D in robotics, advanced technological adoption, significant household robot penetration.
- Key Countries: United States, Canada.
- Emerging Growth Area: Agriculture, Forestry, Livestock Farming and Fisheries Robots
- Market Share (2025): ~12% and growing
- Key Drivers: Labor shortages, need for increased efficiency and sustainability, technological advancements in precision agriculture.
- Key Countries: Netherlands, Australia, United States.
- Key Type Drivers: Cleaning Robots (Vacuuming & Mopping)
- Market Penetration: High in developed economies, increasing in emerging markets.
- Key Drivers: Convenience, improved home hygiene standards, increasing urbanization.
The Household Robots segment, with cleaning robots (vacuuming and mopping robots) at its core, represents another significant contributor, estimated at 25% of the market in 2025. Factors such as increasing urbanization, busy lifestyles, and a growing emphasis on home cleanliness are propelling its growth. Asia-Pacific is also a rapidly growing region, driven by its large population, increasing disposable incomes, and the burgeoning manufacturing sector adopting robots for various applications.
Service Robots Product Landscape
The Service Robots product landscape is characterized by increasing sophistication and specialization. Innovations in AI and sensor technology are enabling robots to perform tasks with unprecedented autonomy and precision. Surgical robots, such as those developed by Intuitive Surgical, are revolutionizing minimally invasive procedures, offering enhanced dexterity and visualization. In the consumer space, cleaning robots from companies like iRobot and Dyson have become integral to modern households, with advanced mapping and navigation capabilities. Personal Mobility Assist Robots are emerging as crucial aids for the elderly and disabled, offering improved independence and quality of life. The integration of cloud connectivity and machine learning allows these robots to continuously learn and adapt, enhancing their performance and user experience.
Key Drivers, Barriers & Challenges in Service Robots
Key Drivers: The Service Robots market is propelled by a confluence of powerful drivers. Technological advancements in AI, machine learning, and sensor technology are creating robots with enhanced capabilities. The growing demand for automation across industries like healthcare, logistics, and agriculture to improve efficiency and address labor shortages is a significant factor. Government initiatives and funding supporting robotics research and development further accelerate market growth. The aging global population is a key driver for nursing, rehabilitation, and personal mobility robots. Finally, increasing disposable incomes and a desire for convenience are fueling the adoption of household robots.
Barriers & Challenges: Despite the positive outlook, the market faces several challenges. High initial investment costs can be a significant barrier, especially for Small and Medium-sized Enterprises (SMEs) and in developing economies. Complex regulatory frameworks and safety standards, while necessary, can also slow down product development and market entry. Public perception and acceptance of robots in certain sensitive roles, such as elder care, remain a consideration. Cybersecurity threats and data privacy concerns associated with connected robots require robust solutions. Integration challenges with existing infrastructure and the need for skilled personnel to operate and maintain these advanced systems also pose hurdles. Supply chain disruptions, as seen in recent global events, can impact the availability and cost of components.
Emerging Opportunities in Service Robots
Emerging opportunities in the Service Robots sector are vast and diverse. The expansion of robotics in agriculture, including precision farming and livestock management, presents a significant growth avenue, addressing global food security concerns and labor scarcity. The healthcare sector continues to offer immense potential, not just for surgical and rehabilitation robots but also for diagnostic assistants and telepresence robots facilitating remote patient care. The integration of service robots in logistics and warehousing, particularly in e-commerce fulfillment, is another rapidly growing area. Furthermore, the development of companion robots for the elderly and socially isolated individuals taps into the demographic shifts. The burgeoning "robot-as-a-service" (RaaS) model is democratizing access to advanced robotics, enabling businesses to leverage robotic capabilities without substantial upfront capital expenditure.
Growth Accelerators in the Service Robots Industry
Several catalysts are accelerating the long-term growth of the Service Robots industry. Continuous innovation in AI and machine learning algorithms is leading to more intelligent and adaptable robots capable of complex decision-making. The development of more cost-effective and miniaturized sensor technologies is making robots more affordable and versatile. Strategic partnerships and collaborations between technology providers, end-users, and research institutions are fostering rapid development and market penetration. The increasing focus on sustainability and resource efficiency across industries is driving the adoption of robots for optimized operations. Finally, the expansion of the Robotics-as-a-Service (RaaS) business model is lowering adoption barriers and making advanced robotic solutions accessible to a wider range of businesses.
Key Players Shaping the Service Robots Market
- Intuitive Surgical
- iRobot
- Dyson
- Neato Robotics
- Sharp
- Toshiba
- Panasonic
- Gecko Systems
- Northrop Grumman Corporation
- ECA Group
- Kongsberg Maritim
- Fujitsu Frontech Limited
- Kawasaki
- REWALK
- Sony
- Honda
- Toyota
- Aldebaran
- Hitachi
- ALSOK
Notable Milestones in Service Robots Sector
- 2019: Launch of advanced AI-powered surgical robots enabling greater precision in complex procedures.
- 2020: Significant increase in demand for disinfection robots due to the global pandemic.
- 2021: Introduction of next-generation autonomous mobile robots (AMRs) for logistics and warehousing.
- 2022: Development of new exoskeleton technologies for rehabilitation and industrial assistance.
- 2023: Expansion of agricultural robotics to include automated pollination and precision spraying.
- 2024: Increased adoption of collaborative robots (cobots) in manufacturing and service industries.
In-Depth Service Robots Market Outlook
The future of the Service Robots market is exceptionally promising, driven by sustained technological innovation and expanding application areas. Growth accelerators like advancements in AI, sensor technology, and the burgeoning RaaS model will continue to fuel market expansion. The healthcare sector, in particular, will remain a significant growth engine, with surgical, rehabilitation, and elder care robots playing increasingly vital roles. The agricultural and logistics sectors are also set for substantial transformation through robotic integration. Strategic partnerships and a growing global acceptance of robotic assistance will further solidify the market's upward trajectory, making service robots an indispensable part of future economies and societies.
Service Robots Segmentation
-
1. Application
- 1.1. Household Robots
- 1.2. Education/Entertainment Robots
- 1.3. Nursing/Rehabilitation Robots
- 1.4. Medical Robots
- 1.5. Agriculture, Forestry, Livestock Farming and Fisheries Robots
- 1.6. Others
-
2. Types
- 2.1. Surgical Robots
- 2.2. Cleaning Robots
- 2.3. Vacuuming Robots
- 2.4. Mopping Robots
- 2.5. Personal Mobility Assist Robots
- 2.6. Pet Exercising Robots
- 2.7. Milking Robots
- 2.8. Others
Service Robots Segmentation By Geography
-
1. North America
- 1.1. United States
- 1.2. Canada
- 1.3. Mexico
-
2. South America
- 2.1. Brazil
- 2.2. Argentina
- 2.3. Rest of South America
-
3. Europe
- 3.1. United Kingdom
- 3.2. Germany
- 3.3. France
- 3.4. Italy
- 3.5. Spain
- 3.6. Russia
- 3.7. Benelux
- 3.8. Nordics
- 3.9. Rest of Europe
-
4. Middle East & Africa
- 4.1. Turkey
- 4.2. Israel
- 4.3. GCC
- 4.4. North Africa
- 4.5. South Africa
- 4.6. Rest of Middle East & Africa
-
5. Asia Pacific
- 5.1. China
- 5.2. India
- 5.3. Japan
- 5.4. South Korea
- 5.5. ASEAN
- 5.6. Oceania
- 5.7. Rest of Asia Pacific
Service Robots Regional Market Share
Geographic Coverage of Service Robots
Service Robots REPORT HIGHLIGHTS
| Aspects | Details |
|---|---|
| Study Period | 2020-2034 |
| Base Year | 2025 |
| Estimated Year | 2026 |
| Forecast Period | 2026-2034 |
| Historical Period | 2020-2025 |
| Growth Rate | CAGR of 21.4% from 2020-2034 |
| Segmentation |
|
Table of Contents
- 1. Introduction
- 1.1. Research Scope
- 1.2. Market Segmentation
- 1.3. Research Methodology
- 1.4. Definitions and Assumptions
- 2. Executive Summary
- 2.1. Introduction
- 3. Market Dynamics
- 3.1. Introduction
- 3.2. Market Drivers
- 3.3. Market Restrains
- 3.4. Market Trends
- 4. Market Factor Analysis
- 4.1. Porters Five Forces
- 4.2. Supply/Value Chain
- 4.3. PESTEL analysis
- 4.4. Market Entropy
- 4.5. Patent/Trademark Analysis
- 5. Global Service Robots Analysis, Insights and Forecast, 2020-2032
- 5.1. Market Analysis, Insights and Forecast - by Application
- 5.1.1. Household Robots
- 5.1.2. Education/Entertainment Robots
- 5.1.3. Nursing/Rehabilitation Robots
- 5.1.4. Medical Robots
- 5.1.5. Agriculture, Forestry, Livestock Farming and Fisheries Robots
- 5.1.6. Others
- 5.2. Market Analysis, Insights and Forecast - by Types
- 5.2.1. Surgical Robots
- 5.2.2. Cleaning Robots
- 5.2.3. Vacuuming Robots
- 5.2.4. Mopping Robots
- 5.2.5. Personal Mobility Assist Robots
- 5.2.6. Pet Exercising Robots
- 5.2.7. Milking Robots
- 5.2.8. Others
- 5.3. Market Analysis, Insights and Forecast - by Region
- 5.3.1. North America
- 5.3.2. South America
- 5.3.3. Europe
- 5.3.4. Middle East & Africa
- 5.3.5. Asia Pacific
- 5.1. Market Analysis, Insights and Forecast - by Application
- 6. North America Service Robots Analysis, Insights and Forecast, 2020-2032
- 6.1. Market Analysis, Insights and Forecast - by Application
- 6.1.1. Household Robots
- 6.1.2. Education/Entertainment Robots
- 6.1.3. Nursing/Rehabilitation Robots
- 6.1.4. Medical Robots
- 6.1.5. Agriculture, Forestry, Livestock Farming and Fisheries Robots
- 6.1.6. Others
- 6.2. Market Analysis, Insights and Forecast - by Types
- 6.2.1. Surgical Robots
- 6.2.2. Cleaning Robots
- 6.2.3. Vacuuming Robots
- 6.2.4. Mopping Robots
- 6.2.5. Personal Mobility Assist Robots
- 6.2.6. Pet Exercising Robots
- 6.2.7. Milking Robots
- 6.2.8. Others
- 6.1. Market Analysis, Insights and Forecast - by Application
- 7. South America Service Robots Analysis, Insights and Forecast, 2020-2032
- 7.1. Market Analysis, Insights and Forecast - by Application
- 7.1.1. Household Robots
- 7.1.2. Education/Entertainment Robots
- 7.1.3. Nursing/Rehabilitation Robots
- 7.1.4. Medical Robots
- 7.1.5. Agriculture, Forestry, Livestock Farming and Fisheries Robots
- 7.1.6. Others
- 7.2. Market Analysis, Insights and Forecast - by Types
- 7.2.1. Surgical Robots
- 7.2.2. Cleaning Robots
- 7.2.3. Vacuuming Robots
- 7.2.4. Mopping Robots
- 7.2.5. Personal Mobility Assist Robots
- 7.2.6. Pet Exercising Robots
- 7.2.7. Milking Robots
- 7.2.8. Others
- 7.1. Market Analysis, Insights and Forecast - by Application
- 8. Europe Service Robots Analysis, Insights and Forecast, 2020-2032
- 8.1. Market Analysis, Insights and Forecast - by Application
- 8.1.1. Household Robots
- 8.1.2. Education/Entertainment Robots
- 8.1.3. Nursing/Rehabilitation Robots
- 8.1.4. Medical Robots
- 8.1.5. Agriculture, Forestry, Livestock Farming and Fisheries Robots
- 8.1.6. Others
- 8.2. Market Analysis, Insights and Forecast - by Types
- 8.2.1. Surgical Robots
- 8.2.2. Cleaning Robots
- 8.2.3. Vacuuming Robots
- 8.2.4. Mopping Robots
- 8.2.5. Personal Mobility Assist Robots
- 8.2.6. Pet Exercising Robots
- 8.2.7. Milking Robots
- 8.2.8. Others
- 8.1. Market Analysis, Insights and Forecast - by Application
- 9. Middle East & Africa Service Robots Analysis, Insights and Forecast, 2020-2032
- 9.1. Market Analysis, Insights and Forecast - by Application
- 9.1.1. Household Robots
- 9.1.2. Education/Entertainment Robots
- 9.1.3. Nursing/Rehabilitation Robots
- 9.1.4. Medical Robots
- 9.1.5. Agriculture, Forestry, Livestock Farming and Fisheries Robots
- 9.1.6. Others
- 9.2. Market Analysis, Insights and Forecast - by Types
- 9.2.1. Surgical Robots
- 9.2.2. Cleaning Robots
- 9.2.3. Vacuuming Robots
- 9.2.4. Mopping Robots
- 9.2.5. Personal Mobility Assist Robots
- 9.2.6. Pet Exercising Robots
- 9.2.7. Milking Robots
- 9.2.8. Others
- 9.1. Market Analysis, Insights and Forecast - by Application
- 10. Asia Pacific Service Robots Analysis, Insights and Forecast, 2020-2032
- 10.1. Market Analysis, Insights and Forecast - by Application
- 10.1.1. Household Robots
- 10.1.2. Education/Entertainment Robots
- 10.1.3. Nursing/Rehabilitation Robots
- 10.1.4. Medical Robots
- 10.1.5. Agriculture, Forestry, Livestock Farming and Fisheries Robots
- 10.1.6. Others
- 10.2. Market Analysis, Insights and Forecast - by Types
- 10.2.1. Surgical Robots
- 10.2.2. Cleaning Robots
- 10.2.3. Vacuuming Robots
- 10.2.4. Mopping Robots
- 10.2.5. Personal Mobility Assist Robots
- 10.2.6. Pet Exercising Robots
- 10.2.7. Milking Robots
- 10.2.8. Others
- 10.1. Market Analysis, Insights and Forecast - by Application
- 11. Competitive Analysis
- 11.1. Global Market Share Analysis 2025
- 11.2. Company Profiles
- 11.2.1 Intuitive Surgical
- 11.2.1.1. Overview
- 11.2.1.2. Products
- 11.2.1.3. SWOT Analysis
- 11.2.1.4. Recent Developments
- 11.2.1.5. Financials (Based on Availability)
- 11.2.2 IRobot
- 11.2.2.1. Overview
- 11.2.2.2. Products
- 11.2.2.3. SWOT Analysis
- 11.2.2.4. Recent Developments
- 11.2.2.5. Financials (Based on Availability)
- 11.2.3 Dyson
- 11.2.3.1. Overview
- 11.2.3.2. Products
- 11.2.3.3. SWOT Analysis
- 11.2.3.4. Recent Developments
- 11.2.3.5. Financials (Based on Availability)
- 11.2.4 Neato Robotics
- 11.2.4.1. Overview
- 11.2.4.2. Products
- 11.2.4.3. SWOT Analysis
- 11.2.4.4. Recent Developments
- 11.2.4.5. Financials (Based on Availability)
- 11.2.5 Sharp
- 11.2.5.1. Overview
- 11.2.5.2. Products
- 11.2.5.3. SWOT Analysis
- 11.2.5.4. Recent Developments
- 11.2.5.5. Financials (Based on Availability)
- 11.2.6 Toshiba
- 11.2.6.1. Overview
- 11.2.6.2. Products
- 11.2.6.3. SWOT Analysis
- 11.2.6.4. Recent Developments
- 11.2.6.5. Financials (Based on Availability)
- 11.2.7 Panasonic
- 11.2.7.1. Overview
- 11.2.7.2. Products
- 11.2.7.3. SWOT Analysis
- 11.2.7.4. Recent Developments
- 11.2.7.5. Financials (Based on Availability)
- 11.2.8 Gecko Systems
- 11.2.8.1. Overview
- 11.2.8.2. Products
- 11.2.8.3. SWOT Analysis
- 11.2.8.4. Recent Developments
- 11.2.8.5. Financials (Based on Availability)
- 11.2.9 Northrop Grumman Corporation
- 11.2.9.1. Overview
- 11.2.9.2. Products
- 11.2.9.3. SWOT Analysis
- 11.2.9.4. Recent Developments
- 11.2.9.5. Financials (Based on Availability)
- 11.2.10 ECA Group
- 11.2.10.1. Overview
- 11.2.10.2. Products
- 11.2.10.3. SWOT Analysis
- 11.2.10.4. Recent Developments
- 11.2.10.5. Financials (Based on Availability)
- 11.2.11 Kongsberg Maritim
- 11.2.11.1. Overview
- 11.2.11.2. Products
- 11.2.11.3. SWOT Analysis
- 11.2.11.4. Recent Developments
- 11.2.11.5. Financials (Based on Availability)
- 11.2.12 Fujitsu Frontech Limited
- 11.2.12.1. Overview
- 11.2.12.2. Products
- 11.2.12.3. SWOT Analysis
- 11.2.12.4. Recent Developments
- 11.2.12.5. Financials (Based on Availability)
- 11.2.13 Kawasaki
- 11.2.13.1. Overview
- 11.2.13.2. Products
- 11.2.13.3. SWOT Analysis
- 11.2.13.4. Recent Developments
- 11.2.13.5. Financials (Based on Availability)
- 11.2.14 REWALK
- 11.2.14.1. Overview
- 11.2.14.2. Products
- 11.2.14.3. SWOT Analysis
- 11.2.14.4. Recent Developments
- 11.2.14.5. Financials (Based on Availability)
- 11.2.15 Sony
- 11.2.15.1. Overview
- 11.2.15.2. Products
- 11.2.15.3. SWOT Analysis
- 11.2.15.4. Recent Developments
- 11.2.15.5. Financials (Based on Availability)
- 11.2.16 Honda
- 11.2.16.1. Overview
- 11.2.16.2. Products
- 11.2.16.3. SWOT Analysis
- 11.2.16.4. Recent Developments
- 11.2.16.5. Financials (Based on Availability)
- 11.2.17 Toyota
- 11.2.17.1. Overview
- 11.2.17.2. Products
- 11.2.17.3. SWOT Analysis
- 11.2.17.4. Recent Developments
- 11.2.17.5. Financials (Based on Availability)
- 11.2.18 Aldebaran
- 11.2.18.1. Overview
- 11.2.18.2. Products
- 11.2.18.3. SWOT Analysis
- 11.2.18.4. Recent Developments
- 11.2.18.5. Financials (Based on Availability)
- 11.2.19 Hitachi
- 11.2.19.1. Overview
- 11.2.19.2. Products
- 11.2.19.3. SWOT Analysis
- 11.2.19.4. Recent Developments
- 11.2.19.5. Financials (Based on Availability)
- 11.2.20 ALSOK
- 11.2.20.1. Overview
- 11.2.20.2. Products
- 11.2.20.3. SWOT Analysis
- 11.2.20.4. Recent Developments
- 11.2.20.5. Financials (Based on Availability)
- 11.2.1 Intuitive Surgical
List of Figures
- Figure 1: Global Service Robots Revenue Breakdown (undefined, %) by Region 2025 & 2033
- Figure 2: Global Service Robots Volume Breakdown (K, %) by Region 2025 & 2033
- Figure 3: North America Service Robots Revenue (undefined), by Application 2025 & 2033
- Figure 4: North America Service Robots Volume (K), by Application 2025 & 2033
- Figure 5: North America Service Robots Revenue Share (%), by Application 2025 & 2033
- Figure 6: North America Service Robots Volume Share (%), by Application 2025 & 2033
- Figure 7: North America Service Robots Revenue (undefined), by Types 2025 & 2033
- Figure 8: North America Service Robots Volume (K), by Types 2025 & 2033
- Figure 9: North America Service Robots Revenue Share (%), by Types 2025 & 2033
- Figure 10: North America Service Robots Volume Share (%), by Types 2025 & 2033
- Figure 11: North America Service Robots Revenue (undefined), by Country 2025 & 2033
- Figure 12: North America Service Robots Volume (K), by Country 2025 & 2033
- Figure 13: North America Service Robots Revenue Share (%), by Country 2025 & 2033
- Figure 14: North America Service Robots Volume Share (%), by Country 2025 & 2033
- Figure 15: South America Service Robots Revenue (undefined), by Application 2025 & 2033
- Figure 16: South America Service Robots Volume (K), by Application 2025 & 2033
- Figure 17: South America Service Robots Revenue Share (%), by Application 2025 & 2033
- Figure 18: South America Service Robots Volume Share (%), by Application 2025 & 2033
- Figure 19: South America Service Robots Revenue (undefined), by Types 2025 & 2033
- Figure 20: South America Service Robots Volume (K), by Types 2025 & 2033
- Figure 21: South America Service Robots Revenue Share (%), by Types 2025 & 2033
- Figure 22: South America Service Robots Volume Share (%), by Types 2025 & 2033
- Figure 23: South America Service Robots Revenue (undefined), by Country 2025 & 2033
- Figure 24: South America Service Robots Volume (K), by Country 2025 & 2033
- Figure 25: South America Service Robots Revenue Share (%), by Country 2025 & 2033
- Figure 26: South America Service Robots Volume Share (%), by Country 2025 & 2033
- Figure 27: Europe Service Robots Revenue (undefined), by Application 2025 & 2033
- Figure 28: Europe Service Robots Volume (K), by Application 2025 & 2033
- Figure 29: Europe Service Robots Revenue Share (%), by Application 2025 & 2033
- Figure 30: Europe Service Robots Volume Share (%), by Application 2025 & 2033
- Figure 31: Europe Service Robots Revenue (undefined), by Types 2025 & 2033
- Figure 32: Europe Service Robots Volume (K), by Types 2025 & 2033
- Figure 33: Europe Service Robots Revenue Share (%), by Types 2025 & 2033
- Figure 34: Europe Service Robots Volume Share (%), by Types 2025 & 2033
- Figure 35: Europe Service Robots Revenue (undefined), by Country 2025 & 2033
- Figure 36: Europe Service Robots Volume (K), by Country 2025 & 2033
- Figure 37: Europe Service Robots Revenue Share (%), by Country 2025 & 2033
- Figure 38: Europe Service Robots Volume Share (%), by Country 2025 & 2033
- Figure 39: Middle East & Africa Service Robots Revenue (undefined), by Application 2025 & 2033
- Figure 40: Middle East & Africa Service Robots Volume (K), by Application 2025 & 2033
- Figure 41: Middle East & Africa Service Robots Revenue Share (%), by Application 2025 & 2033
- Figure 42: Middle East & Africa Service Robots Volume Share (%), by Application 2025 & 2033
- Figure 43: Middle East & Africa Service Robots Revenue (undefined), by Types 2025 & 2033
- Figure 44: Middle East & Africa Service Robots Volume (K), by Types 2025 & 2033
- Figure 45: Middle East & Africa Service Robots Revenue Share (%), by Types 2025 & 2033
- Figure 46: Middle East & Africa Service Robots Volume Share (%), by Types 2025 & 2033
- Figure 47: Middle East & Africa Service Robots Revenue (undefined), by Country 2025 & 2033
- Figure 48: Middle East & Africa Service Robots Volume (K), by Country 2025 & 2033
- Figure 49: Middle East & Africa Service Robots Revenue Share (%), by Country 2025 & 2033
- Figure 50: Middle East & Africa Service Robots Volume Share (%), by Country 2025 & 2033
- Figure 51: Asia Pacific Service Robots Revenue (undefined), by Application 2025 & 2033
- Figure 52: Asia Pacific Service Robots Volume (K), by Application 2025 & 2033
- Figure 53: Asia Pacific Service Robots Revenue Share (%), by Application 2025 & 2033
- Figure 54: Asia Pacific Service Robots Volume Share (%), by Application 2025 & 2033
- Figure 55: Asia Pacific Service Robots Revenue (undefined), by Types 2025 & 2033
- Figure 56: Asia Pacific Service Robots Volume (K), by Types 2025 & 2033
- Figure 57: Asia Pacific Service Robots Revenue Share (%), by Types 2025 & 2033
- Figure 58: Asia Pacific Service Robots Volume Share (%), by Types 2025 & 2033
- Figure 59: Asia Pacific Service Robots Revenue (undefined), by Country 2025 & 2033
- Figure 60: Asia Pacific Service Robots Volume (K), by Country 2025 & 2033
- Figure 61: Asia Pacific Service Robots Revenue Share (%), by Country 2025 & 2033
- Figure 62: Asia Pacific Service Robots Volume Share (%), by Country 2025 & 2033
List of Tables
- Table 1: Global Service Robots Revenue undefined Forecast, by Application 2020 & 2033
- Table 2: Global Service Robots Volume K Forecast, by Application 2020 & 2033
- Table 3: Global Service Robots Revenue undefined Forecast, by Types 2020 & 2033
- Table 4: Global Service Robots Volume K Forecast, by Types 2020 & 2033
- Table 5: Global Service Robots Revenue undefined Forecast, by Region 2020 & 2033
- Table 6: Global Service Robots Volume K Forecast, by Region 2020 & 2033
- Table 7: Global Service Robots Revenue undefined Forecast, by Application 2020 & 2033
- Table 8: Global Service Robots Volume K Forecast, by Application 2020 & 2033
- Table 9: Global Service Robots Revenue undefined Forecast, by Types 2020 & 2033
- Table 10: Global Service Robots Volume K Forecast, by Types 2020 & 2033
- Table 11: Global Service Robots Revenue undefined Forecast, by Country 2020 & 2033
- Table 12: Global Service Robots Volume K Forecast, by Country 2020 & 2033
- Table 13: United States Service Robots Revenue (undefined) Forecast, by Application 2020 & 2033
- Table 14: United States Service Robots Volume (K) Forecast, by Application 2020 & 2033
- Table 15: Canada Service Robots Revenue (undefined) Forecast, by Application 2020 & 2033
- Table 16: Canada Service Robots Volume (K) Forecast, by Application 2020 & 2033
- Table 17: Mexico Service Robots Revenue (undefined) Forecast, by Application 2020 & 2033
- Table 18: Mexico Service Robots Volume (K) Forecast, by Application 2020 & 2033
- Table 19: Global Service Robots Revenue undefined Forecast, by Application 2020 & 2033
- Table 20: Global Service Robots Volume K Forecast, by Application 2020 & 2033
- Table 21: Global Service Robots Revenue undefined Forecast, by Types 2020 & 2033
- Table 22: Global Service Robots Volume K Forecast, by Types 2020 & 2033
- Table 23: Global Service Robots Revenue undefined Forecast, by Country 2020 & 2033
- Table 24: Global Service Robots Volume K Forecast, by Country 2020 & 2033
- Table 25: Brazil Service Robots Revenue (undefined) Forecast, by Application 2020 & 2033
- Table 26: Brazil Service Robots Volume (K) Forecast, by Application 2020 & 2033
- Table 27: Argentina Service Robots Revenue (undefined) Forecast, by Application 2020 & 2033
- Table 28: Argentina Service Robots Volume (K) Forecast, by Application 2020 & 2033
- Table 29: Rest of South America Service Robots Revenue (undefined) Forecast, by Application 2020 & 2033
- Table 30: Rest of South America Service Robots Volume (K) Forecast, by Application 2020 & 2033
- Table 31: Global Service Robots Revenue undefined Forecast, by Application 2020 & 2033
- Table 32: Global Service Robots Volume K Forecast, by Application 2020 & 2033
- Table 33: Global Service Robots Revenue undefined Forecast, by Types 2020 & 2033
- Table 34: Global Service Robots Volume K Forecast, by Types 2020 & 2033
- Table 35: Global Service Robots Revenue undefined Forecast, by Country 2020 & 2033
- Table 36: Global Service Robots Volume K Forecast, by Country 2020 & 2033
- Table 37: United Kingdom Service Robots Revenue (undefined) Forecast, by Application 2020 & 2033
- Table 38: United Kingdom Service Robots Volume (K) Forecast, by Application 2020 & 2033
- Table 39: Germany Service Robots Revenue (undefined) Forecast, by Application 2020 & 2033
- Table 40: Germany Service Robots Volume (K) Forecast, by Application 2020 & 2033
- Table 41: France Service Robots Revenue (undefined) Forecast, by Application 2020 & 2033
- Table 42: France Service Robots Volume (K) Forecast, by Application 2020 & 2033
- Table 43: Italy Service Robots Revenue (undefined) Forecast, by Application 2020 & 2033
- Table 44: Italy Service Robots Volume (K) Forecast, by Application 2020 & 2033
- Table 45: Spain Service Robots Revenue (undefined) Forecast, by Application 2020 & 2033
- Table 46: Spain Service Robots Volume (K) Forecast, by Application 2020 & 2033
- Table 47: Russia Service Robots Revenue (undefined) Forecast, by Application 2020 & 2033
- Table 48: Russia Service Robots Volume (K) Forecast, by Application 2020 & 2033
- Table 49: Benelux Service Robots Revenue (undefined) Forecast, by Application 2020 & 2033
- Table 50: Benelux Service Robots Volume (K) Forecast, by Application 2020 & 2033
- Table 51: Nordics Service Robots Revenue (undefined) Forecast, by Application 2020 & 2033
- Table 52: Nordics Service Robots Volume (K) Forecast, by Application 2020 & 2033
- Table 53: Rest of Europe Service Robots Revenue (undefined) Forecast, by Application 2020 & 2033
- Table 54: Rest of Europe Service Robots Volume (K) Forecast, by Application 2020 & 2033
- Table 55: Global Service Robots Revenue undefined Forecast, by Application 2020 & 2033
- Table 56: Global Service Robots Volume K Forecast, by Application 2020 & 2033
- Table 57: Global Service Robots Revenue undefined Forecast, by Types 2020 & 2033
- Table 58: Global Service Robots Volume K Forecast, by Types 2020 & 2033
- Table 59: Global Service Robots Revenue undefined Forecast, by Country 2020 & 2033
- Table 60: Global Service Robots Volume K Forecast, by Country 2020 & 2033
- Table 61: Turkey Service Robots Revenue (undefined) Forecast, by Application 2020 & 2033
- Table 62: Turkey Service Robots Volume (K) Forecast, by Application 2020 & 2033
- Table 63: Israel Service Robots Revenue (undefined) Forecast, by Application 2020 & 2033
- Table 64: Israel Service Robots Volume (K) Forecast, by Application 2020 & 2033
- Table 65: GCC Service Robots Revenue (undefined) Forecast, by Application 2020 & 2033
- Table 66: GCC Service Robots Volume (K) Forecast, by Application 2020 & 2033
- Table 67: North Africa Service Robots Revenue (undefined) Forecast, by Application 2020 & 2033
- Table 68: North Africa Service Robots Volume (K) Forecast, by Application 2020 & 2033
- Table 69: South Africa Service Robots Revenue (undefined) Forecast, by Application 2020 & 2033
- Table 70: South Africa Service Robots Volume (K) Forecast, by Application 2020 & 2033
- Table 71: Rest of Middle East & Africa Service Robots Revenue (undefined) Forecast, by Application 2020 & 2033
- Table 72: Rest of Middle East & Africa Service Robots Volume (K) Forecast, by Application 2020 & 2033
- Table 73: Global Service Robots Revenue undefined Forecast, by Application 2020 & 2033
- Table 74: Global Service Robots Volume K Forecast, by Application 2020 & 2033
- Table 75: Global Service Robots Revenue undefined Forecast, by Types 2020 & 2033
- Table 76: Global Service Robots Volume K Forecast, by Types 2020 & 2033
- Table 77: Global Service Robots Revenue undefined Forecast, by Country 2020 & 2033
- Table 78: Global Service Robots Volume K Forecast, by Country 2020 & 2033
- Table 79: China Service Robots Revenue (undefined) Forecast, by Application 2020 & 2033
- Table 80: China Service Robots Volume (K) Forecast, by Application 2020 & 2033
- Table 81: India Service Robots Revenue (undefined) Forecast, by Application 2020 & 2033
- Table 82: India Service Robots Volume (K) Forecast, by Application 2020 & 2033
- Table 83: Japan Service Robots Revenue (undefined) Forecast, by Application 2020 & 2033
- Table 84: Japan Service Robots Volume (K) Forecast, by Application 2020 & 2033
- Table 85: South Korea Service Robots Revenue (undefined) Forecast, by Application 2020 & 2033
- Table 86: South Korea Service Robots Volume (K) Forecast, by Application 2020 & 2033
- Table 87: ASEAN Service Robots Revenue (undefined) Forecast, by Application 2020 & 2033
- Table 88: ASEAN Service Robots Volume (K) Forecast, by Application 2020 & 2033
- Table 89: Oceania Service Robots Revenue (undefined) Forecast, by Application 2020 & 2033
- Table 90: Oceania Service Robots Volume (K) Forecast, by Application 2020 & 2033
- Table 91: Rest of Asia Pacific Service Robots Revenue (undefined) Forecast, by Application 2020 & 2033
- Table 92: Rest of Asia Pacific Service Robots Volume (K) Forecast, by Application 2020 & 2033
Frequently Asked Questions
1. What is the projected Compound Annual Growth Rate (CAGR) of the Service Robots?
The projected CAGR is approximately 21.4%.
2. Which companies are prominent players in the Service Robots?
Key companies in the market include Intuitive Surgical, IRobot, Dyson, Neato Robotics, Sharp, Toshiba, Panasonic, Gecko Systems, Northrop Grumman Corporation, ECA Group, Kongsberg Maritim, Fujitsu Frontech Limited, Kawasaki, REWALK, Sony, Honda, Toyota, Aldebaran, Hitachi, ALSOK.
3. What are the main segments of the Service Robots?
The market segments include Application, Types.
4. Can you provide details about the market size?
The market size is estimated to be USD XXX N/A as of 2022.
5. What are some drivers contributing to market growth?
N/A
6. What are the notable trends driving market growth?
N/A
7. Are there any restraints impacting market growth?
N/A
8. Can you provide examples of recent developments in the market?
N/A
9. What pricing options are available for accessing the report?
Pricing options include single-user, multi-user, and enterprise licenses priced at USD 3350.00, USD 5025.00, and USD 6700.00 respectively.
10. Is the market size provided in terms of value or volume?
The market size is provided in terms of value, measured in N/A and volume, measured in K.
11. Are there any specific market keywords associated with the report?
Yes, the market keyword associated with the report is "Service Robots," which aids in identifying and referencing the specific market segment covered.
12. How do I determine which pricing option suits my needs best?
The pricing options vary based on user requirements and access needs. Individual users may opt for single-user licenses, while businesses requiring broader access may choose multi-user or enterprise licenses for cost-effective access to the report.
13. Are there any additional resources or data provided in the Service Robots report?
While the report offers comprehensive insights, it's advisable to review the specific contents or supplementary materials provided to ascertain if additional resources or data are available.
14. How can I stay updated on further developments or reports in the Service Robots?
To stay informed about further developments, trends, and reports in the Service Robots, consider subscribing to industry newsletters, following relevant companies and organizations, or regularly checking reputable industry news sources and publications.
Methodology
Step 1 - Identification of Relevant Samples Size from Population Database


Step 2 - Approaches for Defining Global Market Size (Value, Volume* & Price*)

Note*: In applicable scenarios
Step 3 - Data Sources
Primary Research
- Web Analytics
- Survey Reports
- Research Institute
- Latest Research Reports
- Opinion Leaders
Secondary Research
- Annual Reports
- White Paper
- Latest Press Release
- Industry Association
- Paid Database
- Investor Presentations

Step 4 - Data Triangulation
Involves using different sources of information in order to increase the validity of a study
These sources are likely to be stakeholders in a program - participants, other researchers, program staff, other community members, and so on.
Then we put all data in single framework & apply various statistical tools to find out the dynamic on the market.
During the analysis stage, feedback from the stakeholder groups would be compared to determine areas of agreement as well as areas of divergence