

Key Insights
The global Smart RFID Ear Tag market is poised for significant expansion, driven by the increasing adoption of advanced livestock management technologies. Valued at an estimated $14.58 billion in 2025, the market is projected to grow at a robust Compound Annual Growth Rate (CAGR) of 8.5% from 2025 to 2033. This growth is fueled by a confluence of factors, including the rising demand for efficient animal identification, tracking, and health monitoring solutions in the agricultural sector. The burgeoning need for enhanced biosecurity measures, disease outbreak prevention, and improved supply chain traceability further propels market expansion. Furthermore, technological advancements in RFID, such as miniaturization, enhanced durability, and increased data storage capacity, are making smart ear tags more accessible and appealing to a wider range of livestock producers. The market's trajectory is also influenced by government initiatives promoting precision agriculture and animal welfare.

Smart RFID Ear Tag Market Size (In Billion)
The market segments for smart RFID ear tags are diverse, catering to various animal types and technological preferences. The "Pig" and "Cattle" application segments are expected to lead the market due to their large population sizes and the established need for effective management. Sheep and other livestock also represent significant growth opportunities. In terms of technology, both LF (Low Frequency) and UHF (Ultra-High Frequency) ear tags are gaining traction, with UHF tags offering superior read range and data transfer capabilities, making them ideal for larger herds and automated systems. Key market players like Allflex, Ceres Tag, and Datamars are actively innovating and expanding their product portfolios to capture market share. Geographically, North America and Europe are anticipated to remain dominant markets, supported by advanced agricultural infrastructure and strong regulatory frameworks. However, the Asia Pacific region, particularly China and India, is expected to witness the fastest growth due to increasing investments in livestock modernization and a rising demand for high-quality animal products. The market also faces certain restraints, such as the initial cost of implementation and the need for specialized infrastructure, which may slightly temper its growth in some developing regions.

Smart RFID Ear Tag Company Market Share
Smart RFID Ear Tag Market: Comprehensive Analysis and Future Outlook (2019-2033)
This report offers an in-depth analysis of the global Smart RFID Ear Tag market, providing critical insights into its dynamics, growth trajectory, and future potential. Covering the period from 2019 to 2033, with a base and estimated year of 2025, this research is indispensable for stakeholders seeking to understand and capitalize on this rapidly evolving industry. The market is segmented by application (Pig, Cattle, Sheep, Others) and type (LF Ear Tag, UHF Ear Tag), with a detailed examination of leading players including Allflex, Ceres Tag, Quantified, Ardes, Luoyang Laipson Information, Kupsan, Stockbrands, CowManager, HerdDogg, MOOvement, Moocall, Drovers, Caisley International, Datamars, and Fofia.
Smart RFID Ear Tag Market Dynamics & Structure
The Smart RFID Ear Tag market is characterized by a moderate concentration, with a few key players holding significant market share, particularly in the cattle and sheep segments. Technological innovation serves as a primary driver, fueled by advancements in miniaturization, data transmission capabilities, and power efficiency of RFID chips. Regulatory frameworks, particularly concerning animal traceability and food safety, are increasingly mandating the adoption of such technologies, thereby stimulating market growth. Competitive product substitutes include traditional ear tags and other identification methods, but the enhanced data analytics and real-time monitoring offered by smart RFID tags are creating a distinct competitive advantage. End-user demographics range from large-scale commercial farms to smaller family operations, each with varying adoption rates influenced by cost-effectiveness and perceived ROI. Mergers and acquisitions (M&A) are becoming more prevalent as larger companies seek to consolidate market share and acquire innovative technologies.
- Market Concentration: Moderate, with key players dominating specific application segments.
- Technological Innovation Drivers: Miniaturization, improved data transmission, enhanced power efficiency.
- Regulatory Frameworks: Increasing mandates for animal traceability and food safety.
- Competitive Product Substitutes: Traditional ear tags, barcode systems, manual record-keeping.
- End-User Demographics: Broad spectrum from large commercial farms to smallholders.
- M&A Trends: Growing consolidation to enhance market reach and technological portfolios.
Smart RFID Ear Tag Growth Trends & Insights
The global Smart RFID Ear Tag market is projected to experience robust growth, with an estimated market size of $1.5 billion in 2025, escalating to an impressive $4.8 billion by 2033, reflecting a Compound Annual Growth Rate (CAGR) of 15.7% during the forecast period (2025-2033). This expansion is underpinned by a significant surge in adoption rates across various livestock sectors, driven by the increasing demand for efficient animal management, disease prevention, and supply chain transparency. Technological disruptions, such as the integration of AI and IoT with RFID data, are enabling sophisticated analytics for herd health monitoring, performance optimization, and early disease detection. Consumer behavior shifts towards ethically sourced and traceable food products are also compelling farmers to invest in advanced identification systems. The market penetration of smart RFID ear tags, currently at approximately 18% in 2025, is anticipated to climb to over 40% by 2033, signifying a substantial transformation in livestock management practices. The historical period (2019-2024) witnessed a steady upward trend, setting the stage for this accelerated growth phase. The parent market for animal identification and tracking solutions is valued at an estimated $8.2 billion in 2025, with Smart RFID Ear Tags representing a significant and rapidly growing segment.
Dominant Regions, Countries, or Segments in Smart RFID Ear Tag
The Cattle application segment, projected to be valued at $850 million in 2025, is the dominant force driving the global Smart RFID Ear Tag market. This dominance is attributed to several key factors, including the sheer scale of the global cattle population, the economic importance of cattle farming worldwide, and the stringent regulatory requirements for cattle traceability in major markets such as North America and Europe. The economic policies in these regions actively promote the adoption of technologies that enhance food safety and facilitate rapid recall in case of disease outbreaks, making Smart RFID Ear Tags a vital investment for cattle ranchers. Furthermore, the growing emphasis on precision livestock farming and herd management for optimizing milk and beef production in the cattle industry necessitates sophisticated identification and monitoring solutions.
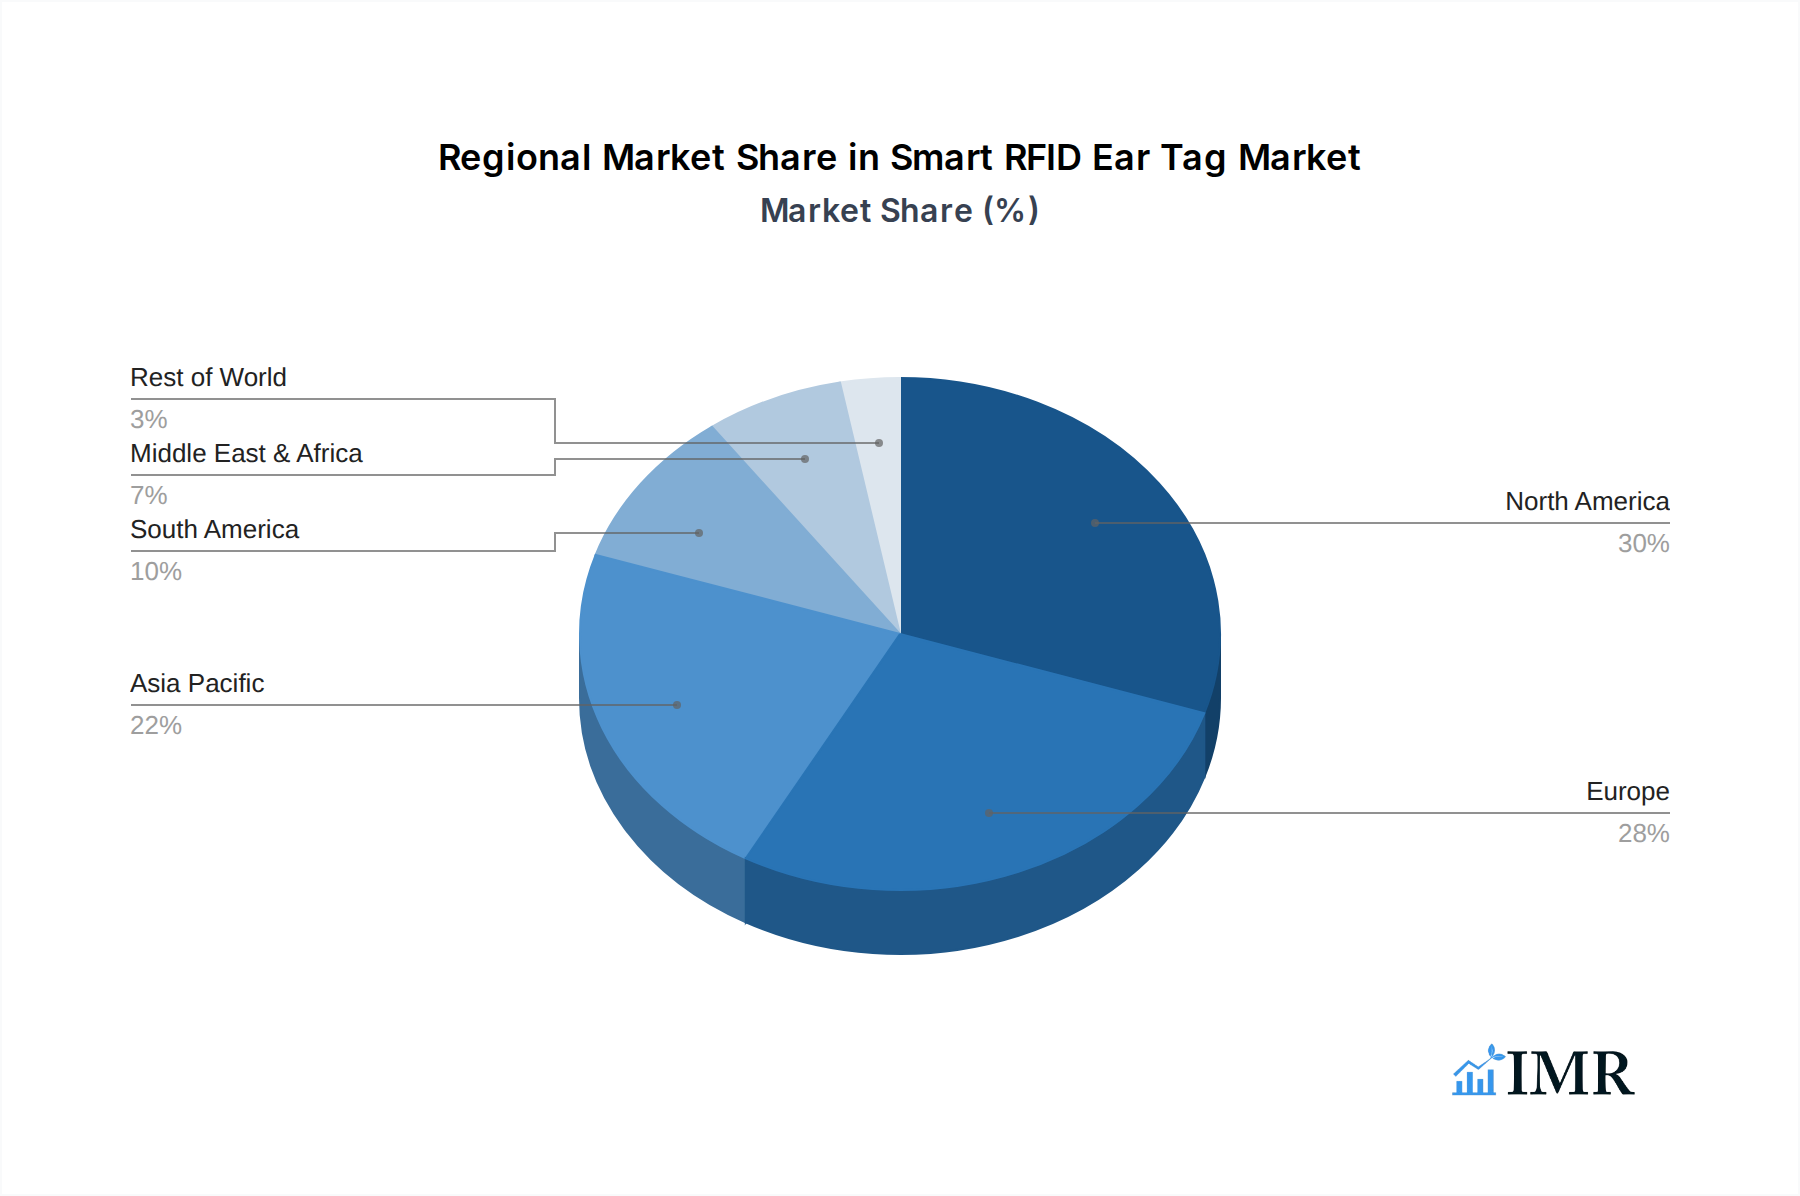
In terms of regional dominance, North America is expected to lead the market in 2025, with an estimated market share of 30%, driven by its advanced agricultural infrastructure, high adoption rate of technology in farming, and supportive government initiatives. The country-level analysis reveals the United States as the leading market within North America. The UHF Ear Tag type, valued at $620 million in 2025, is also a significant growth driver, offering longer read ranges and higher data storage capacities compared to LF Ear Tags, making them ideal for large-scale operations and complex data management.
- Dominant Application Segment: Cattle ($850 million in 2025)
- Drivers: Large global cattle population, economic significance, stringent traceability regulations.
- Market Share: Expected to contribute over 55% of the total application market.
- Dominant Region: North America (30% market share in 2025)
- Key Drivers: Advanced agricultural infrastructure, technological adoption, supportive government policies.
- Country-Level Lead: United States.
- Dominant Type: UHF Ear Tag ($620 million in 2025)
- Advantages: Longer read range, higher data capacity, suitable for large-scale operations.
- Growth Potential: Significant expansion projected due to increasing demand for precision livestock farming and herd health monitoring.
Smart RFID Ear Tag Product Landscape
The Smart RFID Ear Tag product landscape is marked by continuous innovation focused on enhancing durability, data security, and integration capabilities. Manufacturers are developing ear tags with advanced materials resistant to harsh environmental conditions, ensuring long-term functionality. Miniaturized RFID chips are enabling smaller and lighter tags, reducing stress on animals. Furthermore, the integration of sensors within ear tags for real-time monitoring of vital signs, temperature, and activity levels is a significant technological advancement. These innovations allow for proactive health management, early detection of diseases, and optimization of breeding programs. The performance metrics are continuously improving, with increased read accuracy, extended battery life for active tags, and enhanced data transmission speeds, all contributing to a more comprehensive and efficient animal management system.
Key Drivers, Barriers & Challenges in Smart RFID Ear Tag
Key Drivers:
- Increasing Demand for Food Safety and Traceability: Global consumers and regulatory bodies are demanding greater transparency in food supply chains, pushing for reliable animal identification and tracking solutions.
- Advancements in RFID Technology: Miniaturization, increased read range, and enhanced data storage capabilities are making smart RFID ear tags more effective and cost-efficient.
- Precision Livestock Farming: The growing adoption of precision agriculture techniques to optimize herd health, productivity, and resource management relies heavily on data-driven insights provided by smart ear tags.
- Government Initiatives and Subsidies: Many governments are promoting the adoption of livestock identification technologies through incentives and mandatory regulations.
Barriers & Challenges:
- High Initial Investment Cost: For some smaller farms, the upfront cost of implementing smart RFID systems can be a significant barrier to adoption.
- Connectivity and Infrastructure Limitations: In remote agricultural areas, consistent internet connectivity and the necessary infrastructure for data transmission can be a challenge.
- Data Management and Interpretation Skills: Effectively utilizing the vast amounts of data generated by smart ear tags requires specialized skills and software, which may not be readily available to all farmers.
- Potential for Tag Damage or Loss: While durable, tags can still be damaged or lost due to animal behavior or environmental factors, leading to disruptions in tracking.
- Interoperability Issues: Ensuring seamless data exchange between different RFID systems and farm management software can be complex.
Emerging Opportunities in Smart RFID Ear Tag
Emerging opportunities lie in the development of integrated smart ear tag solutions that combine RFID with advanced sensor technologies for comprehensive animal health monitoring. This includes real-time detection of illness through body temperature and activity patterns, potentially preventing widespread outbreaks and reducing veterinary costs. Furthermore, the untapped potential of the "Others" application segment, including companion animals and exotic livestock, presents a significant growth avenue as pet owners and specialized farmers seek advanced tracking and health management tools. The increasing focus on sustainable agriculture also opens doors for ear tags that can monitor environmental impact and resource utilization at an individual animal level. The development of AI-powered analytics platforms that provide actionable insights from RFID data will further enhance the value proposition for end-users.
Growth Accelerators in the Smart RFID Ear Tag Industry
The long-term growth of the Smart RFID Ear Tag industry will be significantly accelerated by technological breakthroughs in energy harvesting for active tags, eliminating the need for battery replacements and further reducing operational costs. Strategic partnerships between RFID technology providers, animal health companies, and farm management software developers will foster greater interoperability and create more comprehensive, end-to-end solutions. Market expansion strategies targeting developing economies with growing livestock sectors, coupled with tailored product offerings to address local needs and affordability, will unlock substantial growth potential. The increasing consumer demand for provenance and quality in animal products will continue to drive the adoption of advanced traceability solutions.
Key Players Shaping the Smart RFID Ear Tag Market
- Allflex
- Ceres Tag
- Quantified
- Ardes
- Luoyang Laipson Information
- Kupsan
- Stockbrands
- CowManager
- HerdDogg
- MOOvement
- Moocall
- Drovers
- Caisley International
- Datamars
- Fofia
Notable Milestones in Smart RFID Ear Tag Sector
- 2019: Increased investment in AI integration with RFID for predictive animal health analytics.
- 2020: Launch of more robust and environmentally resistant ear tag designs.
- 2021: Emergence of advanced sensor integration for real-time vital sign monitoring within ear tags.
- 2022: Significant growth in UHF ear tag adoption due to enhanced performance for large herds.
- 2023: Increased M&A activity as larger agricultural tech companies acquire specialized RFID providers.
- 2024: Focus on developing energy-harvesting technologies for active RFID ear tags.
- 2025 (Estimated): Widespread adoption of integrated IoT solutions for livestock management, powered by smart RFID ear tags.
- 2026-2033 (Forecast): Continuous evolution towards fully automated herd management systems and enhanced supply chain transparency.
In-Depth Smart RFID Ear Tag Market Outlook
The future outlook for the Smart RFID Ear Tag market is exceptionally bright, poised for sustained and accelerated growth. The fusion of RFID technology with artificial intelligence, IoT, and advanced sensor capabilities will revolutionize livestock management, moving beyond simple identification to comprehensive health monitoring and predictive analytics. This evolution will unlock significant economic benefits for farmers through increased productivity, reduced losses, and optimized resource allocation. Strategic collaborations and ongoing technological innovation will continue to drive down costs and improve performance, making these solutions accessible to a broader range of agricultural operations globally. The increasing emphasis on sustainable and ethical food production will further solidify the indispensable role of smart RFID ear tags in ensuring traceability and consumer trust. The market is well-positioned to capitalize on these trends, offering substantial opportunities for stakeholders across the value chain.
Smart RFID Ear Tag Segmentation
-
1. Application
- 1.1. Pig
- 1.2. Cattle
- 1.3. Sheep
- 1.4. Others
-
2. Types
- 2.1. LF Ear Tag
- 2.2. UHF Ear Tag
Smart RFID Ear Tag Segmentation By Geography
-
1. North America
- 1.1. United States
- 1.2. Canada
- 1.3. Mexico
-
2. South America
- 2.1. Brazil
- 2.2. Argentina
- 2.3. Rest of South America
-
3. Europe
- 3.1. United Kingdom
- 3.2. Germany
- 3.3. France
- 3.4. Italy
- 3.5. Spain
- 3.6. Russia
- 3.7. Benelux
- 3.8. Nordics
- 3.9. Rest of Europe
-
4. Middle East & Africa
- 4.1. Turkey
- 4.2. Israel
- 4.3. GCC
- 4.4. North Africa
- 4.5. South Africa
- 4.6. Rest of Middle East & Africa
-
5. Asia Pacific
- 5.1. China
- 5.2. India
- 5.3. Japan
- 5.4. South Korea
- 5.5. ASEAN
- 5.6. Oceania
- 5.7. Rest of Asia Pacific
Smart RFID Ear Tag Regional Market Share
Geographic Coverage of Smart RFID Ear Tag
Smart RFID Ear Tag REPORT HIGHLIGHTS
| Aspects | Details |
|---|---|
| Study Period | 2020-2034 |
| Base Year | 2025 |
| Estimated Year | 2026 |
| Forecast Period | 2026-2034 |
| Historical Period | 2020-2025 |
| Growth Rate | CAGR of 8.5% from 2020-2034 |
| Segmentation |
|
Table of Contents
- 1. Introduction
- 1.1. Research Scope
- 1.2. Market Segmentation
- 1.3. Research Methodology
- 1.4. Definitions and Assumptions
- 2. Executive Summary
- 2.1. Introduction
- 3. Market Dynamics
- 3.1. Introduction
- 3.2. Market Drivers
- 3.3. Market Restrains
- 3.4. Market Trends
- 4. Market Factor Analysis
- 4.1. Porters Five Forces
- 4.2. Supply/Value Chain
- 4.3. PESTEL analysis
- 4.4. Market Entropy
- 4.5. Patent/Trademark Analysis
- 5. Global Smart RFID Ear Tag Analysis, Insights and Forecast, 2020-2032
- 5.1. Market Analysis, Insights and Forecast - by Application
- 5.1.1. Pig
- 5.1.2. Cattle
- 5.1.3. Sheep
- 5.1.4. Others
- 5.2. Market Analysis, Insights and Forecast - by Types
- 5.2.1. LF Ear Tag
- 5.2.2. UHF Ear Tag
- 5.3. Market Analysis, Insights and Forecast - by Region
- 5.3.1. North America
- 5.3.2. South America
- 5.3.3. Europe
- 5.3.4. Middle East & Africa
- 5.3.5. Asia Pacific
- 5.1. Market Analysis, Insights and Forecast - by Application
- 6. North America Smart RFID Ear Tag Analysis, Insights and Forecast, 2020-2032
- 6.1. Market Analysis, Insights and Forecast - by Application
- 6.1.1. Pig
- 6.1.2. Cattle
- 6.1.3. Sheep
- 6.1.4. Others
- 6.2. Market Analysis, Insights and Forecast - by Types
- 6.2.1. LF Ear Tag
- 6.2.2. UHF Ear Tag
- 6.1. Market Analysis, Insights and Forecast - by Application
- 7. South America Smart RFID Ear Tag Analysis, Insights and Forecast, 2020-2032
- 7.1. Market Analysis, Insights and Forecast - by Application
- 7.1.1. Pig
- 7.1.2. Cattle
- 7.1.3. Sheep
- 7.1.4. Others
- 7.2. Market Analysis, Insights and Forecast - by Types
- 7.2.1. LF Ear Tag
- 7.2.2. UHF Ear Tag
- 7.1. Market Analysis, Insights and Forecast - by Application
- 8. Europe Smart RFID Ear Tag Analysis, Insights and Forecast, 2020-2032
- 8.1. Market Analysis, Insights and Forecast - by Application
- 8.1.1. Pig
- 8.1.2. Cattle
- 8.1.3. Sheep
- 8.1.4. Others
- 8.2. Market Analysis, Insights and Forecast - by Types
- 8.2.1. LF Ear Tag
- 8.2.2. UHF Ear Tag
- 8.1. Market Analysis, Insights and Forecast - by Application
- 9. Middle East & Africa Smart RFID Ear Tag Analysis, Insights and Forecast, 2020-2032
- 9.1. Market Analysis, Insights and Forecast - by Application
- 9.1.1. Pig
- 9.1.2. Cattle
- 9.1.3. Sheep
- 9.1.4. Others
- 9.2. Market Analysis, Insights and Forecast - by Types
- 9.2.1. LF Ear Tag
- 9.2.2. UHF Ear Tag
- 9.1. Market Analysis, Insights and Forecast - by Application
- 10. Asia Pacific Smart RFID Ear Tag Analysis, Insights and Forecast, 2020-2032
- 10.1. Market Analysis, Insights and Forecast - by Application
- 10.1.1. Pig
- 10.1.2. Cattle
- 10.1.3. Sheep
- 10.1.4. Others
- 10.2. Market Analysis, Insights and Forecast - by Types
- 10.2.1. LF Ear Tag
- 10.2.2. UHF Ear Tag
- 10.1. Market Analysis, Insights and Forecast - by Application
- 11. Competitive Analysis
- 11.1. Global Market Share Analysis 2025
- 11.2. Company Profiles
- 11.2.1 Allflex
- 11.2.1.1. Overview
- 11.2.1.2. Products
- 11.2.1.3. SWOT Analysis
- 11.2.1.4. Recent Developments
- 11.2.1.5. Financials (Based on Availability)
- 11.2.2 Ceres Tag
- 11.2.2.1. Overview
- 11.2.2.2. Products
- 11.2.2.3. SWOT Analysis
- 11.2.2.4. Recent Developments
- 11.2.2.5. Financials (Based on Availability)
- 11.2.3 Quantified
- 11.2.3.1. Overview
- 11.2.3.2. Products
- 11.2.3.3. SWOT Analysis
- 11.2.3.4. Recent Developments
- 11.2.3.5. Financials (Based on Availability)
- 11.2.4 Ardes
- 11.2.4.1. Overview
- 11.2.4.2. Products
- 11.2.4.3. SWOT Analysis
- 11.2.4.4. Recent Developments
- 11.2.4.5. Financials (Based on Availability)
- 11.2.5 Luoyang Laipson Information
- 11.2.5.1. Overview
- 11.2.5.2. Products
- 11.2.5.3. SWOT Analysis
- 11.2.5.4. Recent Developments
- 11.2.5.5. Financials (Based on Availability)
- 11.2.6 Kupsan
- 11.2.6.1. Overview
- 11.2.6.2. Products
- 11.2.6.3. SWOT Analysis
- 11.2.6.4. Recent Developments
- 11.2.6.5. Financials (Based on Availability)
- 11.2.7 Stockbrands
- 11.2.7.1. Overview
- 11.2.7.2. Products
- 11.2.7.3. SWOT Analysis
- 11.2.7.4. Recent Developments
- 11.2.7.5. Financials (Based on Availability)
- 11.2.8 CowManager
- 11.2.8.1. Overview
- 11.2.8.2. Products
- 11.2.8.3. SWOT Analysis
- 11.2.8.4. Recent Developments
- 11.2.8.5. Financials (Based on Availability)
- 11.2.9 HerdDogg
- 11.2.9.1. Overview
- 11.2.9.2. Products
- 11.2.9.3. SWOT Analysis
- 11.2.9.4. Recent Developments
- 11.2.9.5. Financials (Based on Availability)
- 11.2.10 MOOvement
- 11.2.10.1. Overview
- 11.2.10.2. Products
- 11.2.10.3. SWOT Analysis
- 11.2.10.4. Recent Developments
- 11.2.10.5. Financials (Based on Availability)
- 11.2.11 Moocall
- 11.2.11.1. Overview
- 11.2.11.2. Products
- 11.2.11.3. SWOT Analysis
- 11.2.11.4. Recent Developments
- 11.2.11.5. Financials (Based on Availability)
- 11.2.12 Drovers
- 11.2.12.1. Overview
- 11.2.12.2. Products
- 11.2.12.3. SWOT Analysis
- 11.2.12.4. Recent Developments
- 11.2.12.5. Financials (Based on Availability)
- 11.2.13 Caisley International
- 11.2.13.1. Overview
- 11.2.13.2. Products
- 11.2.13.3. SWOT Analysis
- 11.2.13.4. Recent Developments
- 11.2.13.5. Financials (Based on Availability)
- 11.2.14 Datamars
- 11.2.14.1. Overview
- 11.2.14.2. Products
- 11.2.14.3. SWOT Analysis
- 11.2.14.4. Recent Developments
- 11.2.14.5. Financials (Based on Availability)
- 11.2.15 Fofia
- 11.2.15.1. Overview
- 11.2.15.2. Products
- 11.2.15.3. SWOT Analysis
- 11.2.15.4. Recent Developments
- 11.2.15.5. Financials (Based on Availability)
- 11.2.1 Allflex
List of Figures
- Figure 1: Global Smart RFID Ear Tag Revenue Breakdown (undefined, %) by Region 2025 & 2033
- Figure 2: Global Smart RFID Ear Tag Volume Breakdown (K, %) by Region 2025 & 2033
- Figure 3: North America Smart RFID Ear Tag Revenue (undefined), by Application 2025 & 2033
- Figure 4: North America Smart RFID Ear Tag Volume (K), by Application 2025 & 2033
- Figure 5: North America Smart RFID Ear Tag Revenue Share (%), by Application 2025 & 2033
- Figure 6: North America Smart RFID Ear Tag Volume Share (%), by Application 2025 & 2033
- Figure 7: North America Smart RFID Ear Tag Revenue (undefined), by Types 2025 & 2033
- Figure 8: North America Smart RFID Ear Tag Volume (K), by Types 2025 & 2033
- Figure 9: North America Smart RFID Ear Tag Revenue Share (%), by Types 2025 & 2033
- Figure 10: North America Smart RFID Ear Tag Volume Share (%), by Types 2025 & 2033
- Figure 11: North America Smart RFID Ear Tag Revenue (undefined), by Country 2025 & 2033
- Figure 12: North America Smart RFID Ear Tag Volume (K), by Country 2025 & 2033
- Figure 13: North America Smart RFID Ear Tag Revenue Share (%), by Country 2025 & 2033
- Figure 14: North America Smart RFID Ear Tag Volume Share (%), by Country 2025 & 2033
- Figure 15: South America Smart RFID Ear Tag Revenue (undefined), by Application 2025 & 2033
- Figure 16: South America Smart RFID Ear Tag Volume (K), by Application 2025 & 2033
- Figure 17: South America Smart RFID Ear Tag Revenue Share (%), by Application 2025 & 2033
- Figure 18: South America Smart RFID Ear Tag Volume Share (%), by Application 2025 & 2033
- Figure 19: South America Smart RFID Ear Tag Revenue (undefined), by Types 2025 & 2033
- Figure 20: South America Smart RFID Ear Tag Volume (K), by Types 2025 & 2033
- Figure 21: South America Smart RFID Ear Tag Revenue Share (%), by Types 2025 & 2033
- Figure 22: South America Smart RFID Ear Tag Volume Share (%), by Types 2025 & 2033
- Figure 23: South America Smart RFID Ear Tag Revenue (undefined), by Country 2025 & 2033
- Figure 24: South America Smart RFID Ear Tag Volume (K), by Country 2025 & 2033
- Figure 25: South America Smart RFID Ear Tag Revenue Share (%), by Country 2025 & 2033
- Figure 26: South America Smart RFID Ear Tag Volume Share (%), by Country 2025 & 2033
- Figure 27: Europe Smart RFID Ear Tag Revenue (undefined), by Application 2025 & 2033
- Figure 28: Europe Smart RFID Ear Tag Volume (K), by Application 2025 & 2033
- Figure 29: Europe Smart RFID Ear Tag Revenue Share (%), by Application 2025 & 2033
- Figure 30: Europe Smart RFID Ear Tag Volume Share (%), by Application 2025 & 2033
- Figure 31: Europe Smart RFID Ear Tag Revenue (undefined), by Types 2025 & 2033
- Figure 32: Europe Smart RFID Ear Tag Volume (K), by Types 2025 & 2033
- Figure 33: Europe Smart RFID Ear Tag Revenue Share (%), by Types 2025 & 2033
- Figure 34: Europe Smart RFID Ear Tag Volume Share (%), by Types 2025 & 2033
- Figure 35: Europe Smart RFID Ear Tag Revenue (undefined), by Country 2025 & 2033
- Figure 36: Europe Smart RFID Ear Tag Volume (K), by Country 2025 & 2033
- Figure 37: Europe Smart RFID Ear Tag Revenue Share (%), by Country 2025 & 2033
- Figure 38: Europe Smart RFID Ear Tag Volume Share (%), by Country 2025 & 2033
- Figure 39: Middle East & Africa Smart RFID Ear Tag Revenue (undefined), by Application 2025 & 2033
- Figure 40: Middle East & Africa Smart RFID Ear Tag Volume (K), by Application 2025 & 2033
- Figure 41: Middle East & Africa Smart RFID Ear Tag Revenue Share (%), by Application 2025 & 2033
- Figure 42: Middle East & Africa Smart RFID Ear Tag Volume Share (%), by Application 2025 & 2033
- Figure 43: Middle East & Africa Smart RFID Ear Tag Revenue (undefined), by Types 2025 & 2033
- Figure 44: Middle East & Africa Smart RFID Ear Tag Volume (K), by Types 2025 & 2033
- Figure 45: Middle East & Africa Smart RFID Ear Tag Revenue Share (%), by Types 2025 & 2033
- Figure 46: Middle East & Africa Smart RFID Ear Tag Volume Share (%), by Types 2025 & 2033
- Figure 47: Middle East & Africa Smart RFID Ear Tag Revenue (undefined), by Country 2025 & 2033
- Figure 48: Middle East & Africa Smart RFID Ear Tag Volume (K), by Country 2025 & 2033
- Figure 49: Middle East & Africa Smart RFID Ear Tag Revenue Share (%), by Country 2025 & 2033
- Figure 50: Middle East & Africa Smart RFID Ear Tag Volume Share (%), by Country 2025 & 2033
- Figure 51: Asia Pacific Smart RFID Ear Tag Revenue (undefined), by Application 2025 & 2033
- Figure 52: Asia Pacific Smart RFID Ear Tag Volume (K), by Application 2025 & 2033
- Figure 53: Asia Pacific Smart RFID Ear Tag Revenue Share (%), by Application 2025 & 2033
- Figure 54: Asia Pacific Smart RFID Ear Tag Volume Share (%), by Application 2025 & 2033
- Figure 55: Asia Pacific Smart RFID Ear Tag Revenue (undefined), by Types 2025 & 2033
- Figure 56: Asia Pacific Smart RFID Ear Tag Volume (K), by Types 2025 & 2033
- Figure 57: Asia Pacific Smart RFID Ear Tag Revenue Share (%), by Types 2025 & 2033
- Figure 58: Asia Pacific Smart RFID Ear Tag Volume Share (%), by Types 2025 & 2033
- Figure 59: Asia Pacific Smart RFID Ear Tag Revenue (undefined), by Country 2025 & 2033
- Figure 60: Asia Pacific Smart RFID Ear Tag Volume (K), by Country 2025 & 2033
- Figure 61: Asia Pacific Smart RFID Ear Tag Revenue Share (%), by Country 2025 & 2033
- Figure 62: Asia Pacific Smart RFID Ear Tag Volume Share (%), by Country 2025 & 2033
List of Tables
- Table 1: Global Smart RFID Ear Tag Revenue undefined Forecast, by Application 2020 & 2033
- Table 2: Global Smart RFID Ear Tag Volume K Forecast, by Application 2020 & 2033
- Table 3: Global Smart RFID Ear Tag Revenue undefined Forecast, by Types 2020 & 2033
- Table 4: Global Smart RFID Ear Tag Volume K Forecast, by Types 2020 & 2033
- Table 5: Global Smart RFID Ear Tag Revenue undefined Forecast, by Region 2020 & 2033
- Table 6: Global Smart RFID Ear Tag Volume K Forecast, by Region 2020 & 2033
- Table 7: Global Smart RFID Ear Tag Revenue undefined Forecast, by Application 2020 & 2033
- Table 8: Global Smart RFID Ear Tag Volume K Forecast, by Application 2020 & 2033
- Table 9: Global Smart RFID Ear Tag Revenue undefined Forecast, by Types 2020 & 2033
- Table 10: Global Smart RFID Ear Tag Volume K Forecast, by Types 2020 & 2033
- Table 11: Global Smart RFID Ear Tag Revenue undefined Forecast, by Country 2020 & 2033
- Table 12: Global Smart RFID Ear Tag Volume K Forecast, by Country 2020 & 2033
- Table 13: United States Smart RFID Ear Tag Revenue (undefined) Forecast, by Application 2020 & 2033
- Table 14: United States Smart RFID Ear Tag Volume (K) Forecast, by Application 2020 & 2033
- Table 15: Canada Smart RFID Ear Tag Revenue (undefined) Forecast, by Application 2020 & 2033
- Table 16: Canada Smart RFID Ear Tag Volume (K) Forecast, by Application 2020 & 2033
- Table 17: Mexico Smart RFID Ear Tag Revenue (undefined) Forecast, by Application 2020 & 2033
- Table 18: Mexico Smart RFID Ear Tag Volume (K) Forecast, by Application 2020 & 2033
- Table 19: Global Smart RFID Ear Tag Revenue undefined Forecast, by Application 2020 & 2033
- Table 20: Global Smart RFID Ear Tag Volume K Forecast, by Application 2020 & 2033
- Table 21: Global Smart RFID Ear Tag Revenue undefined Forecast, by Types 2020 & 2033
- Table 22: Global Smart RFID Ear Tag Volume K Forecast, by Types 2020 & 2033
- Table 23: Global Smart RFID Ear Tag Revenue undefined Forecast, by Country 2020 & 2033
- Table 24: Global Smart RFID Ear Tag Volume K Forecast, by Country 2020 & 2033
- Table 25: Brazil Smart RFID Ear Tag Revenue (undefined) Forecast, by Application 2020 & 2033
- Table 26: Brazil Smart RFID Ear Tag Volume (K) Forecast, by Application 2020 & 2033
- Table 27: Argentina Smart RFID Ear Tag Revenue (undefined) Forecast, by Application 2020 & 2033
- Table 28: Argentina Smart RFID Ear Tag Volume (K) Forecast, by Application 2020 & 2033
- Table 29: Rest of South America Smart RFID Ear Tag Revenue (undefined) Forecast, by Application 2020 & 2033
- Table 30: Rest of South America Smart RFID Ear Tag Volume (K) Forecast, by Application 2020 & 2033
- Table 31: Global Smart RFID Ear Tag Revenue undefined Forecast, by Application 2020 & 2033
- Table 32: Global Smart RFID Ear Tag Volume K Forecast, by Application 2020 & 2033
- Table 33: Global Smart RFID Ear Tag Revenue undefined Forecast, by Types 2020 & 2033
- Table 34: Global Smart RFID Ear Tag Volume K Forecast, by Types 2020 & 2033
- Table 35: Global Smart RFID Ear Tag Revenue undefined Forecast, by Country 2020 & 2033
- Table 36: Global Smart RFID Ear Tag Volume K Forecast, by Country 2020 & 2033
- Table 37: United Kingdom Smart RFID Ear Tag Revenue (undefined) Forecast, by Application 2020 & 2033
- Table 38: United Kingdom Smart RFID Ear Tag Volume (K) Forecast, by Application 2020 & 2033
- Table 39: Germany Smart RFID Ear Tag Revenue (undefined) Forecast, by Application 2020 & 2033
- Table 40: Germany Smart RFID Ear Tag Volume (K) Forecast, by Application 2020 & 2033
- Table 41: France Smart RFID Ear Tag Revenue (undefined) Forecast, by Application 2020 & 2033
- Table 42: France Smart RFID Ear Tag Volume (K) Forecast, by Application 2020 & 2033
- Table 43: Italy Smart RFID Ear Tag Revenue (undefined) Forecast, by Application 2020 & 2033
- Table 44: Italy Smart RFID Ear Tag Volume (K) Forecast, by Application 2020 & 2033
- Table 45: Spain Smart RFID Ear Tag Revenue (undefined) Forecast, by Application 2020 & 2033
- Table 46: Spain Smart RFID Ear Tag Volume (K) Forecast, by Application 2020 & 2033
- Table 47: Russia Smart RFID Ear Tag Revenue (undefined) Forecast, by Application 2020 & 2033
- Table 48: Russia Smart RFID Ear Tag Volume (K) Forecast, by Application 2020 & 2033
- Table 49: Benelux Smart RFID Ear Tag Revenue (undefined) Forecast, by Application 2020 & 2033
- Table 50: Benelux Smart RFID Ear Tag Volume (K) Forecast, by Application 2020 & 2033
- Table 51: Nordics Smart RFID Ear Tag Revenue (undefined) Forecast, by Application 2020 & 2033
- Table 52: Nordics Smart RFID Ear Tag Volume (K) Forecast, by Application 2020 & 2033
- Table 53: Rest of Europe Smart RFID Ear Tag Revenue (undefined) Forecast, by Application 2020 & 2033
- Table 54: Rest of Europe Smart RFID Ear Tag Volume (K) Forecast, by Application 2020 & 2033
- Table 55: Global Smart RFID Ear Tag Revenue undefined Forecast, by Application 2020 & 2033
- Table 56: Global Smart RFID Ear Tag Volume K Forecast, by Application 2020 & 2033
- Table 57: Global Smart RFID Ear Tag Revenue undefined Forecast, by Types 2020 & 2033
- Table 58: Global Smart RFID Ear Tag Volume K Forecast, by Types 2020 & 2033
- Table 59: Global Smart RFID Ear Tag Revenue undefined Forecast, by Country 2020 & 2033
- Table 60: Global Smart RFID Ear Tag Volume K Forecast, by Country 2020 & 2033
- Table 61: Turkey Smart RFID Ear Tag Revenue (undefined) Forecast, by Application 2020 & 2033
- Table 62: Turkey Smart RFID Ear Tag Volume (K) Forecast, by Application 2020 & 2033
- Table 63: Israel Smart RFID Ear Tag Revenue (undefined) Forecast, by Application 2020 & 2033
- Table 64: Israel Smart RFID Ear Tag Volume (K) Forecast, by Application 2020 & 2033
- Table 65: GCC Smart RFID Ear Tag Revenue (undefined) Forecast, by Application 2020 & 2033
- Table 66: GCC Smart RFID Ear Tag Volume (K) Forecast, by Application 2020 & 2033
- Table 67: North Africa Smart RFID Ear Tag Revenue (undefined) Forecast, by Application 2020 & 2033
- Table 68: North Africa Smart RFID Ear Tag Volume (K) Forecast, by Application 2020 & 2033
- Table 69: South Africa Smart RFID Ear Tag Revenue (undefined) Forecast, by Application 2020 & 2033
- Table 70: South Africa Smart RFID Ear Tag Volume (K) Forecast, by Application 2020 & 2033
- Table 71: Rest of Middle East & Africa Smart RFID Ear Tag Revenue (undefined) Forecast, by Application 2020 & 2033
- Table 72: Rest of Middle East & Africa Smart RFID Ear Tag Volume (K) Forecast, by Application 2020 & 2033
- Table 73: Global Smart RFID Ear Tag Revenue undefined Forecast, by Application 2020 & 2033
- Table 74: Global Smart RFID Ear Tag Volume K Forecast, by Application 2020 & 2033
- Table 75: Global Smart RFID Ear Tag Revenue undefined Forecast, by Types 2020 & 2033
- Table 76: Global Smart RFID Ear Tag Volume K Forecast, by Types 2020 & 2033
- Table 77: Global Smart RFID Ear Tag Revenue undefined Forecast, by Country 2020 & 2033
- Table 78: Global Smart RFID Ear Tag Volume K Forecast, by Country 2020 & 2033
- Table 79: China Smart RFID Ear Tag Revenue (undefined) Forecast, by Application 2020 & 2033
- Table 80: China Smart RFID Ear Tag Volume (K) Forecast, by Application 2020 & 2033
- Table 81: India Smart RFID Ear Tag Revenue (undefined) Forecast, by Application 2020 & 2033
- Table 82: India Smart RFID Ear Tag Volume (K) Forecast, by Application 2020 & 2033
- Table 83: Japan Smart RFID Ear Tag Revenue (undefined) Forecast, by Application 2020 & 2033
- Table 84: Japan Smart RFID Ear Tag Volume (K) Forecast, by Application 2020 & 2033
- Table 85: South Korea Smart RFID Ear Tag Revenue (undefined) Forecast, by Application 2020 & 2033
- Table 86: South Korea Smart RFID Ear Tag Volume (K) Forecast, by Application 2020 & 2033
- Table 87: ASEAN Smart RFID Ear Tag Revenue (undefined) Forecast, by Application 2020 & 2033
- Table 88: ASEAN Smart RFID Ear Tag Volume (K) Forecast, by Application 2020 & 2033
- Table 89: Oceania Smart RFID Ear Tag Revenue (undefined) Forecast, by Application 2020 & 2033
- Table 90: Oceania Smart RFID Ear Tag Volume (K) Forecast, by Application 2020 & 2033
- Table 91: Rest of Asia Pacific Smart RFID Ear Tag Revenue (undefined) Forecast, by Application 2020 & 2033
- Table 92: Rest of Asia Pacific Smart RFID Ear Tag Volume (K) Forecast, by Application 2020 & 2033
Frequently Asked Questions
1. What is the projected Compound Annual Growth Rate (CAGR) of the Smart RFID Ear Tag?
The projected CAGR is approximately 8.5%.
2. Which companies are prominent players in the Smart RFID Ear Tag?
Key companies in the market include Allflex, Ceres Tag, Quantified, Ardes, Luoyang Laipson Information, Kupsan, Stockbrands, CowManager, HerdDogg, MOOvement, Moocall, Drovers, Caisley International, Datamars, Fofia.
3. What are the main segments of the Smart RFID Ear Tag?
The market segments include Application, Types.
4. Can you provide details about the market size?
The market size is estimated to be USD XXX N/A as of 2022.
5. What are some drivers contributing to market growth?
N/A
6. What are the notable trends driving market growth?
N/A
7. Are there any restraints impacting market growth?
N/A
8. Can you provide examples of recent developments in the market?
N/A
9. What pricing options are available for accessing the report?
Pricing options include single-user, multi-user, and enterprise licenses priced at USD 3350.00, USD 5025.00, and USD 6700.00 respectively.
10. Is the market size provided in terms of value or volume?
The market size is provided in terms of value, measured in N/A and volume, measured in K.
11. Are there any specific market keywords associated with the report?
Yes, the market keyword associated with the report is "Smart RFID Ear Tag," which aids in identifying and referencing the specific market segment covered.
12. How do I determine which pricing option suits my needs best?
The pricing options vary based on user requirements and access needs. Individual users may opt for single-user licenses, while businesses requiring broader access may choose multi-user or enterprise licenses for cost-effective access to the report.
13. Are there any additional resources or data provided in the Smart RFID Ear Tag report?
While the report offers comprehensive insights, it's advisable to review the specific contents or supplementary materials provided to ascertain if additional resources or data are available.
14. How can I stay updated on further developments or reports in the Smart RFID Ear Tag?
To stay informed about further developments, trends, and reports in the Smart RFID Ear Tag, consider subscribing to industry newsletters, following relevant companies and organizations, or regularly checking reputable industry news sources and publications.
Methodology
Step 1 - Identification of Relevant Samples Size from Population Database


Step 2 - Approaches for Defining Global Market Size (Value, Volume* & Price*)

Note*: In applicable scenarios
Step 3 - Data Sources
Primary Research
- Web Analytics
- Survey Reports
- Research Institute
- Latest Research Reports
- Opinion Leaders
Secondary Research
- Annual Reports
- White Paper
- Latest Press Release
- Industry Association
- Paid Database
- Investor Presentations

Step 4 - Data Triangulation
Involves using different sources of information in order to increase the validity of a study
These sources are likely to be stakeholders in a program - participants, other researchers, program staff, other community members, and so on.
Then we put all data in single framework & apply various statistical tools to find out the dynamic on the market.
During the analysis stage, feedback from the stakeholder groups would be compared to determine areas of agreement as well as areas of divergence