

Key Insights
The global soft contact lens market is poised for significant expansion, projecting a Compound Annual Growth Rate (CAGR) of 6.21% between 2025 and 2033. This growth is propelled by the increasing incidence of refractive errors, particularly myopia and hyperopia, in younger demographics. Advances in lens materials, enhancing comfort and wearability, alongside the expanding reach of e-commerce platforms offering competitive pricing and diverse selections, are key market drivers. While potential health concerns and alternative vision correction methods like LASIK surgery present challenges, the overall market outlook remains robust.
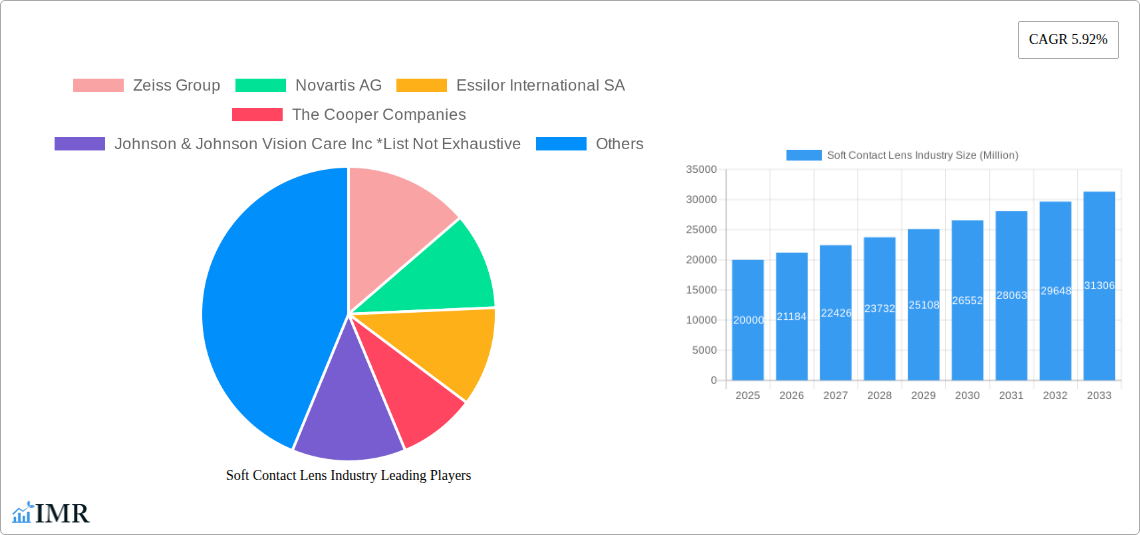
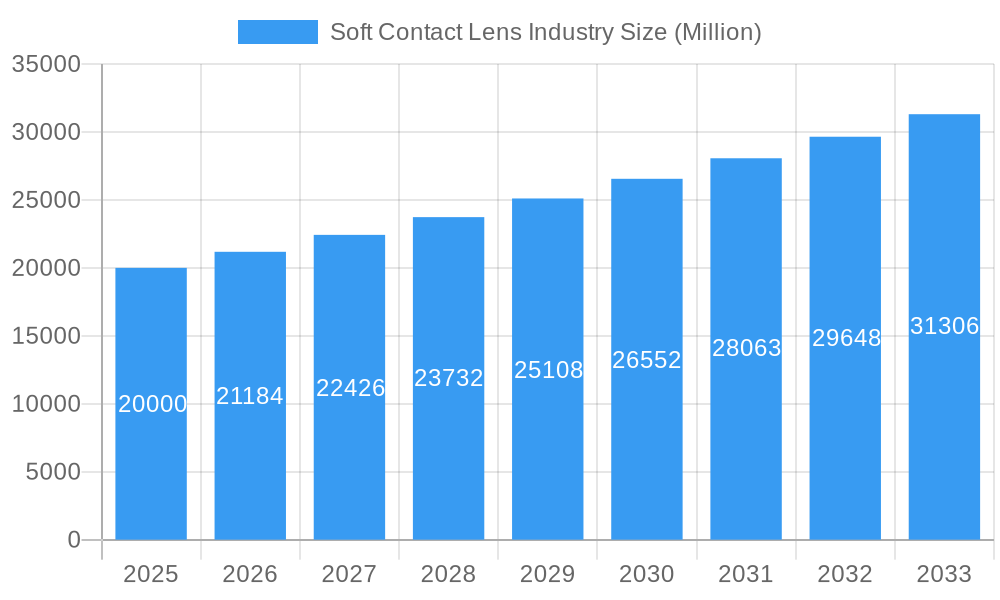
Soft Contact Lens Industry Market Size (In Billion)
Market segmentation highlights corrective contact lenses as the dominant usage. Within product types, soft contact lenses command the largest share due to their inherent comfort and user-friendliness. Distribution channels showcase a competitive landscape between traditional optical retailers and burgeoning online stores. Key industry leaders, including Johnson & Johnson Vision Care, Alcon, CooperVision, and EssilorLuxottica, are actively driving market evolution through innovation and strategic initiatives. Geographically, North America and Europe currently lead market share, supported by high disposable incomes and advanced healthcare systems. However, the Asia-Pacific region is anticipated to experience substantial growth, driven by increasing awareness, rising disposable incomes, and improved healthcare accessibility in emerging economies. The future of the soft contact lens market hinges on addressing risks, fostering innovation, and adapting to consumer demands for comfort, convenience, and advanced lens technologies.
Soft Contact Lens Industry Company Market Share
Soft Contact Lens Industry Market Report: 2019-2033
This comprehensive report provides a detailed analysis of the global soft contact lens industry, encompassing market dynamics, growth trends, regional performance, product landscape, competitive analysis, and future outlook. The report covers the period from 2019 to 2033, with a focus on the base year 2025 and a forecast period extending to 2033. The report is essential for industry professionals, investors, and anyone seeking a deep understanding of this dynamic market valued at xx Million Units in 2025.
Soft Contact Lens Industry Market Dynamics & Structure
This section analyzes the structure and dynamics of the soft contact lens market, encompassing market concentration, technological innovation, regulatory landscapes, competitive substitutes, end-user demographics, and merger and acquisition (M&A) trends. The global soft contact lens market is characterized by a moderately concentrated structure, with key players holding significant market share.
- Market Concentration: The top five companies (Zeiss Group, Novartis AG, Essilor International SA, The Cooper Companies, Johnson & Johnson Vision Care Inc) account for approximately xx% of the global market in 2025.
- Technological Innovation: Ongoing innovation in materials science, lens design, and manufacturing processes drives market growth, with a focus on enhanced comfort, breathability, and vision correction.
- Regulatory Frameworks: Stringent regulatory approvals and safety standards influence market dynamics, impacting product launches and market entry.
- Competitive Substitutes: Spectacles and refractive surgeries represent key competitive substitutes, influencing market penetration and adoption rates.
- End-User Demographics: The increasing prevalence of myopia and hyperopia, coupled with rising disposable incomes, fuels market growth, particularly in developing economies.
- M&A Trends: The past five years have witnessed xx M&A deals in the soft contact lens industry, mainly driven by strategic expansion and consolidation efforts, impacting market share distribution. Innovation barriers include high R&D costs and stringent regulatory hurdles.
Soft Contact Lens Industry Growth Trends & Insights
This section provides a detailed analysis of the global soft contact lens market's growth trajectory, leveraging historical data and future projections. The market exhibited a CAGR of xx% during the historical period (2019-2024) and is projected to grow at a CAGR of xx% during the forecast period (2025-2033), reaching a market size of xx Million Units by 2033. This growth is driven by several factors including rising prevalence of refractive errors, increasing consumer awareness, and technological advancements leading to improved lens comfort and performance. Market penetration is expected to increase significantly across various regions, particularly in emerging markets. Technological disruptions, such as the introduction of smart contact lenses and personalized lens designs, are reshaping consumer preferences and creating new growth opportunities. Changes in consumer behavior, such as increased online purchasing and demand for customized solutions, also impact market dynamics.
Dominant Regions, Countries, or Segments in Soft Contact Lens Industry
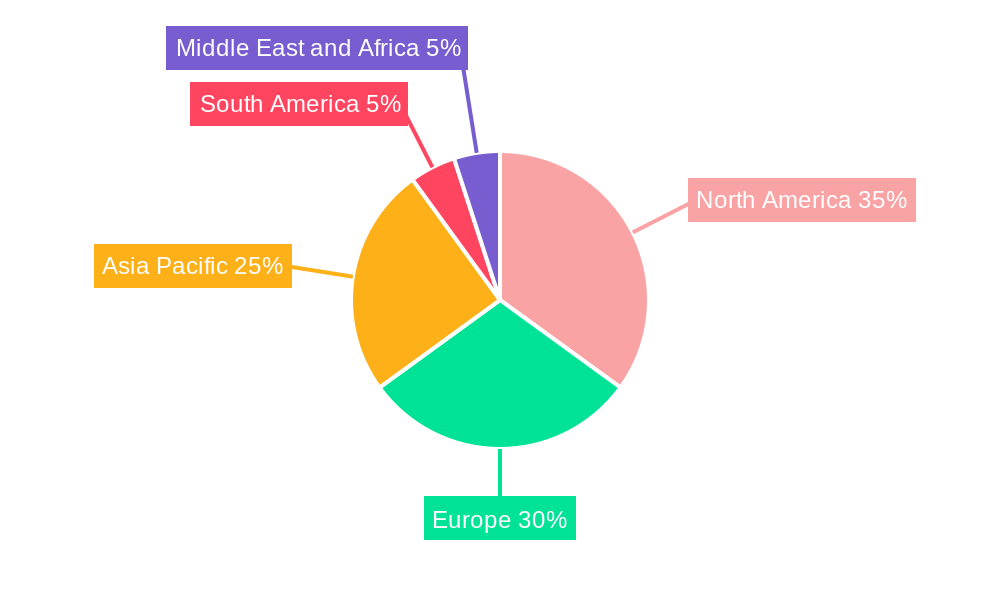
North America currently holds the largest market share in the soft contact lens industry, driven by high disposable incomes, advanced healthcare infrastructure, and increased awareness of vision correction options. However, Asia-Pacific is projected to experience the highest growth rate during the forecast period, fueled by a large and expanding population base, rising disposable incomes, and improving healthcare access.
Leading Segments:
- Product Type: Soft contact lenses dominate the market, accounting for xx% of total market share in 2025.
- Usage: Corrective contact lenses comprise the largest segment, representing approximately xx% of the market.
- Distribution Channel: Spectacle stores continue to be the primary distribution channel, but online stores are witnessing rapid growth, representing xx% of the total market.
Key Drivers by Region:
- North America: High healthcare expenditure, robust regulatory frameworks, and technological advancements.
- Europe: Growing prevalence of refractive errors, increasing adoption of advanced lens technologies.
- Asia-Pacific: Rising disposable incomes, expanding healthcare infrastructure, and a large young population.
Soft Contact Lens Industry Product Landscape
The soft contact lens market offers a diverse range of products, including daily disposable, monthly disposable, and extended-wear lenses. Innovations focus on improving lens comfort, material breathability (e.g., silicone hydrogel lenses), and vision correction accuracy. Unique selling propositions include features like UV protection, moisture retention, and customizable lens designs. Technological advancements in materials science and manufacturing processes are leading to thinner, more comfortable, and longer-lasting lenses.
Key Drivers, Barriers & Challenges in Soft Contact Lens Industry
Key Drivers:
- Rising prevalence of refractive errors globally.
- Increasing disposable incomes, particularly in emerging markets.
- Advancements in lens materials and designs enhancing comfort and performance.
- Growing consumer preference for convenient disposable lenses.
Key Barriers & Challenges:
- Stringent regulatory approvals and safety standards impacting product launches.
- Competition from refractive surgeries and spectacles.
- Supply chain disruptions affecting lens availability and pricing.
- Fluctuations in raw material prices impacting manufacturing costs. This resulted in a xx% increase in production costs in 2024.
Emerging Opportunities in Soft Contact Lens Industry
Emerging opportunities lie in:
- Expansion into untapped markets in developing countries.
- Development of innovative lens designs incorporating smart technology.
- Personalized lens solutions catering to individual needs and preferences.
- Growing demand for contact lenses for specific conditions (e.g., dry eye).
Growth Accelerators in the Soft Contact Lens Industry
Long-term growth will be driven by technological breakthroughs in materials science resulting in advanced lens functionalities, strategic partnerships between lens manufacturers and eye care professionals expanding market reach, and market expansion strategies focusing on underserved regions and patient demographics.
Key Players Shaping the Soft Contact Lens Industry Market
- Zeiss Group
- Novartis AG
- Essilor International SA
- The Cooper Companies
- Johnson & Johnson Vision Care Inc
- Bausch Health Companies Inc
- Hoya Corporation
Notable Milestones in Soft Contact Lens Industry Sector
- 2021: Launch of a new silicone hydrogel lens with enhanced breathability by Johnson & Johnson Vision.
- 2022: Acquisition of a smaller contact lens manufacturer by Alcon (Novartis).
- 2023: FDA approval of a new type of contact lens for the treatment of dry eye.
- 2024: Increased market adoption of daily disposable contact lenses.
In-Depth Soft Contact Lens Industry Market Outlook
The future of the soft contact lens market is bright, driven by continued technological advancements, increasing awareness, and expansion into new markets. Strategic partnerships, focused R&D, and the development of innovative products will shape the industry landscape in the coming years. The market's continued growth trajectory presents significant opportunities for established players and new entrants alike.
Soft Contact Lens Industry Segmentation
-
1. Product Type
- 1.1. Soft Contact Lens
- 1.2. Hybrid Contact Lens
- 1.3. Rigid Gas Permeable Contact Lens
- 1.4. Others
-
2. Usages
- 2.1. Corrective Contact Lens
- 2.2. Therapeutic Contact Lens
- 2.3. Other Usages
-
3. Distribution Channel
- 3.1. Spectacle Stores
- 3.2. Online Stores
- 3.3. Other channel
Soft Contact Lens Industry Segmentation By Geography
-
1. North America
- 1.1. United States
- 1.2. Canada
- 1.3. Mexico
- 1.4. Rest of North America
-
2. Europe
- 2.1. United Kingdom
- 2.2. Germany
- 2.3. France
- 2.4. Italy
- 2.5. Russia
- 2.6. Rest of Europe
-
3. Asia Pacific
- 3.1. China
- 3.2. Japan
- 3.3. India
- 3.4. Australia
- 3.5. Rest of Asia Pacific
-
4. South America
- 4.1. Brazil
- 4.2. Argentina
- 4.3. Rest of South America
-
5. Middle East and Africa
- 5.1. South Africa
- 5.2. United Arab Emirates
- 5.3. Rest of Middle East and Africa
Soft Contact Lens Industry Regional Market Share
Geographic Coverage of Soft Contact Lens Industry
Soft Contact Lens Industry REPORT HIGHLIGHTS
| Aspects | Details |
|---|---|
| Study Period | 2020-2034 |
| Base Year | 2025 |
| Estimated Year | 2026 |
| Forecast Period | 2026-2034 |
| Historical Period | 2020-2025 |
| Growth Rate | CAGR of 6.21% from 2020-2034 |
| Segmentation |
|
Table of Contents
- 1. Introduction
- 1.1. Research Scope
- 1.2. Market Segmentation
- 1.3. Research Objective
- 1.4. Definitions and Assumptions
- 2. Executive Summary
- 2.1. Market Snapshot
- 3. Market Dynamics
- 3.1. Market Drivers
- 3.2. Market Restrains
- 3.3. Market Trends
- 3.4. Market Opportunities
- 4. Market Factor Analysis
- 4.1. Porters Five Forces
- 4.1.1. Bargaining Power of Suppliers
- 4.1.2. Bargaining Power of Buyers
- 4.1.3. Threat of New Entrants
- 4.1.4. Threat of Substitutes
- 4.1.5. Competitive Rivalry
- 4.2. PESTEL analysis
- 4.3. BCG Analysis
- 4.3.1. Stars (High Growth, High Market Share)
- 4.3.2. Cash Cows (Low Growth, High Market Share)
- 4.3.3. Question Mark (High Growth, Low Market Share)
- 4.3.4. Dogs (Low Growth, Low Market Share)
- 4.4. Ansoff Matrix Analysis
- 4.5. Supply Chain Analysis
- 4.6. Regulatory Landscape
- 4.7. Current Market Potential and Opportunity Assessment (TAM–SAM–SOM Framework)
- 4.8. IMR Analyst Note
- 4.1. Porters Five Forces
- 5. Market Analysis, Insights and Forecast 2021-2033
- 5.1. Market Analysis, Insights and Forecast - by Product Type
- 5.1.1. Soft Contact Lens
- 5.1.2. Hybrid Contact Lens
- 5.1.3. Rigid Gas Permeable Contact Lens
- 5.1.4. Others
- 5.2. Market Analysis, Insights and Forecast - by Usages
- 5.2.1. Corrective Contact Lens
- 5.2.2. Therapeutic Contact Lens
- 5.2.3. Other Usages
- 5.3. Market Analysis, Insights and Forecast - by Distribution Channel
- 5.3.1. Spectacle Stores
- 5.3.2. Online Stores
- 5.3.3. Other channel
- 5.4. Market Analysis, Insights and Forecast - by Region
- 5.4.1. North America
- 5.4.2. Europe
- 5.4.3. Asia Pacific
- 5.4.4. South America
- 5.4.5. Middle East and Africa
- 5.1. Market Analysis, Insights and Forecast - by Product Type
- 6. Global Soft Contact Lens Industry Analysis, Insights and Forecast, 2021-2033
- 6.1. Market Analysis, Insights and Forecast - by Product Type
- 6.1.1. Soft Contact Lens
- 6.1.2. Hybrid Contact Lens
- 6.1.3. Rigid Gas Permeable Contact Lens
- 6.1.4. Others
- 6.2. Market Analysis, Insights and Forecast - by Usages
- 6.2.1. Corrective Contact Lens
- 6.2.2. Therapeutic Contact Lens
- 6.2.3. Other Usages
- 6.3. Market Analysis, Insights and Forecast - by Distribution Channel
- 6.3.1. Spectacle Stores
- 6.3.2. Online Stores
- 6.3.3. Other channel
- 6.1. Market Analysis, Insights and Forecast - by Product Type
- 7. North America Soft Contact Lens Industry Analysis, Insights and Forecast, 2020-2032
- 7.1. Market Analysis, Insights and Forecast - by Product Type
- 7.1.1. Soft Contact Lens
- 7.1.2. Hybrid Contact Lens
- 7.1.3. Rigid Gas Permeable Contact Lens
- 7.1.4. Others
- 7.2. Market Analysis, Insights and Forecast - by Usages
- 7.2.1. Corrective Contact Lens
- 7.2.2. Therapeutic Contact Lens
- 7.2.3. Other Usages
- 7.3. Market Analysis, Insights and Forecast - by Distribution Channel
- 7.3.1. Spectacle Stores
- 7.3.2. Online Stores
- 7.3.3. Other channel
- 7.1. Market Analysis, Insights and Forecast - by Product Type
- 8. Europe Soft Contact Lens Industry Analysis, Insights and Forecast, 2020-2032
- 8.1. Market Analysis, Insights and Forecast - by Product Type
- 8.1.1. Soft Contact Lens
- 8.1.2. Hybrid Contact Lens
- 8.1.3. Rigid Gas Permeable Contact Lens
- 8.1.4. Others
- 8.2. Market Analysis, Insights and Forecast - by Usages
- 8.2.1. Corrective Contact Lens
- 8.2.2. Therapeutic Contact Lens
- 8.2.3. Other Usages
- 8.3. Market Analysis, Insights and Forecast - by Distribution Channel
- 8.3.1. Spectacle Stores
- 8.3.2. Online Stores
- 8.3.3. Other channel
- 8.1. Market Analysis, Insights and Forecast - by Product Type
- 9. Asia Pacific Soft Contact Lens Industry Analysis, Insights and Forecast, 2020-2032
- 9.1. Market Analysis, Insights and Forecast - by Product Type
- 9.1.1. Soft Contact Lens
- 9.1.2. Hybrid Contact Lens
- 9.1.3. Rigid Gas Permeable Contact Lens
- 9.1.4. Others
- 9.2. Market Analysis, Insights and Forecast - by Usages
- 9.2.1. Corrective Contact Lens
- 9.2.2. Therapeutic Contact Lens
- 9.2.3. Other Usages
- 9.3. Market Analysis, Insights and Forecast - by Distribution Channel
- 9.3.1. Spectacle Stores
- 9.3.2. Online Stores
- 9.3.3. Other channel
- 9.1. Market Analysis, Insights and Forecast - by Product Type
- 10. South America Soft Contact Lens Industry Analysis, Insights and Forecast, 2020-2032
- 10.1. Market Analysis, Insights and Forecast - by Product Type
- 10.1.1. Soft Contact Lens
- 10.1.2. Hybrid Contact Lens
- 10.1.3. Rigid Gas Permeable Contact Lens
- 10.1.4. Others
- 10.2. Market Analysis, Insights and Forecast - by Usages
- 10.2.1. Corrective Contact Lens
- 10.2.2. Therapeutic Contact Lens
- 10.2.3. Other Usages
- 10.3. Market Analysis, Insights and Forecast - by Distribution Channel
- 10.3.1. Spectacle Stores
- 10.3.2. Online Stores
- 10.3.3. Other channel
- 10.1. Market Analysis, Insights and Forecast - by Product Type
- 11. Middle East and Africa Soft Contact Lens Industry Analysis, Insights and Forecast, 2020-2032
- 11.1. Market Analysis, Insights and Forecast - by Product Type
- 11.1.1. Soft Contact Lens
- 11.1.2. Hybrid Contact Lens
- 11.1.3. Rigid Gas Permeable Contact Lens
- 11.1.4. Others
- 11.2. Market Analysis, Insights and Forecast - by Usages
- 11.2.1. Corrective Contact Lens
- 11.2.2. Therapeutic Contact Lens
- 11.2.3. Other Usages
- 11.3. Market Analysis, Insights and Forecast - by Distribution Channel
- 11.3.1. Spectacle Stores
- 11.3.2. Online Stores
- 11.3.3. Other channel
- 11.1. Market Analysis, Insights and Forecast - by Product Type
- 12. Competitive Analysis
- 12.1. Company Profiles
- 12.1.1 Zeiss Group
- 12.1.1.1. Company Overview
- 12.1.1.2. Products
- 12.1.1.3. Company Financials
- 12.1.1.4. SWOT Analysis
- 12.1.2 Novartis AG
- 12.1.2.1. Company Overview
- 12.1.2.2. Products
- 12.1.2.3. Company Financials
- 12.1.2.4. SWOT Analysis
- 12.1.3 Essilor International SA
- 12.1.3.1. Company Overview
- 12.1.3.2. Products
- 12.1.3.3. Company Financials
- 12.1.3.4. SWOT Analysis
- 12.1.4 The Cooper Companies
- 12.1.4.1. Company Overview
- 12.1.4.2. Products
- 12.1.4.3. Company Financials
- 12.1.4.4. SWOT Analysis
- 12.1.5 Johnson & Johnson Vision Care Inc *List Not Exhaustive
- 12.1.5.1. Company Overview
- 12.1.5.2. Products
- 12.1.5.3. Company Financials
- 12.1.5.4. SWOT Analysis
- 12.1.6 Bausch Health Companies Inc
- 12.1.6.1. Company Overview
- 12.1.6.2. Products
- 12.1.6.3. Company Financials
- 12.1.6.4. SWOT Analysis
- 12.1.7 Hoya Corporation
- 12.1.7.1. Company Overview
- 12.1.7.2. Products
- 12.1.7.3. Company Financials
- 12.1.7.4. SWOT Analysis
- 12.1.1 Zeiss Group
- 12.2. Market Entropy
- 12.2.1 Company's Key Areas Served
- 12.2.2 Recent Developments
- 12.3. Company Market Share Analysis 2025
- 12.3.1 Top 5 Companies Market Share Analysis
- 12.3.2 Top 3 Companies Market Share Analysis
- 12.4. List of Potential Customers
- 13. Research Methodology
List of Figures
- Figure 1: Global Soft Contact Lens Industry Revenue Breakdown (billion, %) by Region 2025 & 2033
- Figure 2: Global Soft Contact Lens Industry Volume Breakdown (K Units, %) by Region 2025 & 2033
- Figure 3: North America Soft Contact Lens Industry Revenue (billion), by Product Type 2025 & 2033
- Figure 4: North America Soft Contact Lens Industry Volume (K Units), by Product Type 2025 & 2033
- Figure 5: North America Soft Contact Lens Industry Revenue Share (%), by Product Type 2025 & 2033
- Figure 6: North America Soft Contact Lens Industry Volume Share (%), by Product Type 2025 & 2033
- Figure 7: North America Soft Contact Lens Industry Revenue (billion), by Usages 2025 & 2033
- Figure 8: North America Soft Contact Lens Industry Volume (K Units), by Usages 2025 & 2033
- Figure 9: North America Soft Contact Lens Industry Revenue Share (%), by Usages 2025 & 2033
- Figure 10: North America Soft Contact Lens Industry Volume Share (%), by Usages 2025 & 2033
- Figure 11: North America Soft Contact Lens Industry Revenue (billion), by Distribution Channel 2025 & 2033
- Figure 12: North America Soft Contact Lens Industry Volume (K Units), by Distribution Channel 2025 & 2033
- Figure 13: North America Soft Contact Lens Industry Revenue Share (%), by Distribution Channel 2025 & 2033
- Figure 14: North America Soft Contact Lens Industry Volume Share (%), by Distribution Channel 2025 & 2033
- Figure 15: North America Soft Contact Lens Industry Revenue (billion), by Country 2025 & 2033
- Figure 16: North America Soft Contact Lens Industry Volume (K Units), by Country 2025 & 2033
- Figure 17: North America Soft Contact Lens Industry Revenue Share (%), by Country 2025 & 2033
- Figure 18: North America Soft Contact Lens Industry Volume Share (%), by Country 2025 & 2033
- Figure 19: Europe Soft Contact Lens Industry Revenue (billion), by Product Type 2025 & 2033
- Figure 20: Europe Soft Contact Lens Industry Volume (K Units), by Product Type 2025 & 2033
- Figure 21: Europe Soft Contact Lens Industry Revenue Share (%), by Product Type 2025 & 2033
- Figure 22: Europe Soft Contact Lens Industry Volume Share (%), by Product Type 2025 & 2033
- Figure 23: Europe Soft Contact Lens Industry Revenue (billion), by Usages 2025 & 2033
- Figure 24: Europe Soft Contact Lens Industry Volume (K Units), by Usages 2025 & 2033
- Figure 25: Europe Soft Contact Lens Industry Revenue Share (%), by Usages 2025 & 2033
- Figure 26: Europe Soft Contact Lens Industry Volume Share (%), by Usages 2025 & 2033
- Figure 27: Europe Soft Contact Lens Industry Revenue (billion), by Distribution Channel 2025 & 2033
- Figure 28: Europe Soft Contact Lens Industry Volume (K Units), by Distribution Channel 2025 & 2033
- Figure 29: Europe Soft Contact Lens Industry Revenue Share (%), by Distribution Channel 2025 & 2033
- Figure 30: Europe Soft Contact Lens Industry Volume Share (%), by Distribution Channel 2025 & 2033
- Figure 31: Europe Soft Contact Lens Industry Revenue (billion), by Country 2025 & 2033
- Figure 32: Europe Soft Contact Lens Industry Volume (K Units), by Country 2025 & 2033
- Figure 33: Europe Soft Contact Lens Industry Revenue Share (%), by Country 2025 & 2033
- Figure 34: Europe Soft Contact Lens Industry Volume Share (%), by Country 2025 & 2033
- Figure 35: Asia Pacific Soft Contact Lens Industry Revenue (billion), by Product Type 2025 & 2033
- Figure 36: Asia Pacific Soft Contact Lens Industry Volume (K Units), by Product Type 2025 & 2033
- Figure 37: Asia Pacific Soft Contact Lens Industry Revenue Share (%), by Product Type 2025 & 2033
- Figure 38: Asia Pacific Soft Contact Lens Industry Volume Share (%), by Product Type 2025 & 2033
- Figure 39: Asia Pacific Soft Contact Lens Industry Revenue (billion), by Usages 2025 & 2033
- Figure 40: Asia Pacific Soft Contact Lens Industry Volume (K Units), by Usages 2025 & 2033
- Figure 41: Asia Pacific Soft Contact Lens Industry Revenue Share (%), by Usages 2025 & 2033
- Figure 42: Asia Pacific Soft Contact Lens Industry Volume Share (%), by Usages 2025 & 2033
- Figure 43: Asia Pacific Soft Contact Lens Industry Revenue (billion), by Distribution Channel 2025 & 2033
- Figure 44: Asia Pacific Soft Contact Lens Industry Volume (K Units), by Distribution Channel 2025 & 2033
- Figure 45: Asia Pacific Soft Contact Lens Industry Revenue Share (%), by Distribution Channel 2025 & 2033
- Figure 46: Asia Pacific Soft Contact Lens Industry Volume Share (%), by Distribution Channel 2025 & 2033
- Figure 47: Asia Pacific Soft Contact Lens Industry Revenue (billion), by Country 2025 & 2033
- Figure 48: Asia Pacific Soft Contact Lens Industry Volume (K Units), by Country 2025 & 2033
- Figure 49: Asia Pacific Soft Contact Lens Industry Revenue Share (%), by Country 2025 & 2033
- Figure 50: Asia Pacific Soft Contact Lens Industry Volume Share (%), by Country 2025 & 2033
- Figure 51: South America Soft Contact Lens Industry Revenue (billion), by Product Type 2025 & 2033
- Figure 52: South America Soft Contact Lens Industry Volume (K Units), by Product Type 2025 & 2033
- Figure 53: South America Soft Contact Lens Industry Revenue Share (%), by Product Type 2025 & 2033
- Figure 54: South America Soft Contact Lens Industry Volume Share (%), by Product Type 2025 & 2033
- Figure 55: South America Soft Contact Lens Industry Revenue (billion), by Usages 2025 & 2033
- Figure 56: South America Soft Contact Lens Industry Volume (K Units), by Usages 2025 & 2033
- Figure 57: South America Soft Contact Lens Industry Revenue Share (%), by Usages 2025 & 2033
- Figure 58: South America Soft Contact Lens Industry Volume Share (%), by Usages 2025 & 2033
- Figure 59: South America Soft Contact Lens Industry Revenue (billion), by Distribution Channel 2025 & 2033
- Figure 60: South America Soft Contact Lens Industry Volume (K Units), by Distribution Channel 2025 & 2033
- Figure 61: South America Soft Contact Lens Industry Revenue Share (%), by Distribution Channel 2025 & 2033
- Figure 62: South America Soft Contact Lens Industry Volume Share (%), by Distribution Channel 2025 & 2033
- Figure 63: South America Soft Contact Lens Industry Revenue (billion), by Country 2025 & 2033
- Figure 64: South America Soft Contact Lens Industry Volume (K Units), by Country 2025 & 2033
- Figure 65: South America Soft Contact Lens Industry Revenue Share (%), by Country 2025 & 2033
- Figure 66: South America Soft Contact Lens Industry Volume Share (%), by Country 2025 & 2033
- Figure 67: Middle East and Africa Soft Contact Lens Industry Revenue (billion), by Product Type 2025 & 2033
- Figure 68: Middle East and Africa Soft Contact Lens Industry Volume (K Units), by Product Type 2025 & 2033
- Figure 69: Middle East and Africa Soft Contact Lens Industry Revenue Share (%), by Product Type 2025 & 2033
- Figure 70: Middle East and Africa Soft Contact Lens Industry Volume Share (%), by Product Type 2025 & 2033
- Figure 71: Middle East and Africa Soft Contact Lens Industry Revenue (billion), by Usages 2025 & 2033
- Figure 72: Middle East and Africa Soft Contact Lens Industry Volume (K Units), by Usages 2025 & 2033
- Figure 73: Middle East and Africa Soft Contact Lens Industry Revenue Share (%), by Usages 2025 & 2033
- Figure 74: Middle East and Africa Soft Contact Lens Industry Volume Share (%), by Usages 2025 & 2033
- Figure 75: Middle East and Africa Soft Contact Lens Industry Revenue (billion), by Distribution Channel 2025 & 2033
- Figure 76: Middle East and Africa Soft Contact Lens Industry Volume (K Units), by Distribution Channel 2025 & 2033
- Figure 77: Middle East and Africa Soft Contact Lens Industry Revenue Share (%), by Distribution Channel 2025 & 2033
- Figure 78: Middle East and Africa Soft Contact Lens Industry Volume Share (%), by Distribution Channel 2025 & 2033
- Figure 79: Middle East and Africa Soft Contact Lens Industry Revenue (billion), by Country 2025 & 2033
- Figure 80: Middle East and Africa Soft Contact Lens Industry Volume (K Units), by Country 2025 & 2033
- Figure 81: Middle East and Africa Soft Contact Lens Industry Revenue Share (%), by Country 2025 & 2033
- Figure 82: Middle East and Africa Soft Contact Lens Industry Volume Share (%), by Country 2025 & 2033
List of Tables
- Table 1: Global Soft Contact Lens Industry Revenue billion Forecast, by Product Type 2020 & 2033
- Table 2: Global Soft Contact Lens Industry Volume K Units Forecast, by Product Type 2020 & 2033
- Table 3: Global Soft Contact Lens Industry Revenue billion Forecast, by Usages 2020 & 2033
- Table 4: Global Soft Contact Lens Industry Volume K Units Forecast, by Usages 2020 & 2033
- Table 5: Global Soft Contact Lens Industry Revenue billion Forecast, by Distribution Channel 2020 & 2033
- Table 6: Global Soft Contact Lens Industry Volume K Units Forecast, by Distribution Channel 2020 & 2033
- Table 7: Global Soft Contact Lens Industry Revenue billion Forecast, by Region 2020 & 2033
- Table 8: Global Soft Contact Lens Industry Volume K Units Forecast, by Region 2020 & 2033
- Table 9: Global Soft Contact Lens Industry Revenue billion Forecast, by Product Type 2020 & 2033
- Table 10: Global Soft Contact Lens Industry Volume K Units Forecast, by Product Type 2020 & 2033
- Table 11: Global Soft Contact Lens Industry Revenue billion Forecast, by Usages 2020 & 2033
- Table 12: Global Soft Contact Lens Industry Volume K Units Forecast, by Usages 2020 & 2033
- Table 13: Global Soft Contact Lens Industry Revenue billion Forecast, by Distribution Channel 2020 & 2033
- Table 14: Global Soft Contact Lens Industry Volume K Units Forecast, by Distribution Channel 2020 & 2033
- Table 15: Global Soft Contact Lens Industry Revenue billion Forecast, by Country 2020 & 2033
- Table 16: Global Soft Contact Lens Industry Volume K Units Forecast, by Country 2020 & 2033
- Table 17: United States Soft Contact Lens Industry Revenue (billion) Forecast, by Application 2020 & 2033
- Table 18: United States Soft Contact Lens Industry Volume (K Units) Forecast, by Application 2020 & 2033
- Table 19: Canada Soft Contact Lens Industry Revenue (billion) Forecast, by Application 2020 & 2033
- Table 20: Canada Soft Contact Lens Industry Volume (K Units) Forecast, by Application 2020 & 2033
- Table 21: Mexico Soft Contact Lens Industry Revenue (billion) Forecast, by Application 2020 & 2033
- Table 22: Mexico Soft Contact Lens Industry Volume (K Units) Forecast, by Application 2020 & 2033
- Table 23: Rest of North America Soft Contact Lens Industry Revenue (billion) Forecast, by Application 2020 & 2033
- Table 24: Rest of North America Soft Contact Lens Industry Volume (K Units) Forecast, by Application 2020 & 2033
- Table 25: Global Soft Contact Lens Industry Revenue billion Forecast, by Product Type 2020 & 2033
- Table 26: Global Soft Contact Lens Industry Volume K Units Forecast, by Product Type 2020 & 2033
- Table 27: Global Soft Contact Lens Industry Revenue billion Forecast, by Usages 2020 & 2033
- Table 28: Global Soft Contact Lens Industry Volume K Units Forecast, by Usages 2020 & 2033
- Table 29: Global Soft Contact Lens Industry Revenue billion Forecast, by Distribution Channel 2020 & 2033
- Table 30: Global Soft Contact Lens Industry Volume K Units Forecast, by Distribution Channel 2020 & 2033
- Table 31: Global Soft Contact Lens Industry Revenue billion Forecast, by Country 2020 & 2033
- Table 32: Global Soft Contact Lens Industry Volume K Units Forecast, by Country 2020 & 2033
- Table 33: United Kingdom Soft Contact Lens Industry Revenue (billion) Forecast, by Application 2020 & 2033
- Table 34: United Kingdom Soft Contact Lens Industry Volume (K Units) Forecast, by Application 2020 & 2033
- Table 35: Germany Soft Contact Lens Industry Revenue (billion) Forecast, by Application 2020 & 2033
- Table 36: Germany Soft Contact Lens Industry Volume (K Units) Forecast, by Application 2020 & 2033
- Table 37: France Soft Contact Lens Industry Revenue (billion) Forecast, by Application 2020 & 2033
- Table 38: France Soft Contact Lens Industry Volume (K Units) Forecast, by Application 2020 & 2033
- Table 39: Italy Soft Contact Lens Industry Revenue (billion) Forecast, by Application 2020 & 2033
- Table 40: Italy Soft Contact Lens Industry Volume (K Units) Forecast, by Application 2020 & 2033
- Table 41: Russia Soft Contact Lens Industry Revenue (billion) Forecast, by Application 2020 & 2033
- Table 42: Russia Soft Contact Lens Industry Volume (K Units) Forecast, by Application 2020 & 2033
- Table 43: Rest of Europe Soft Contact Lens Industry Revenue (billion) Forecast, by Application 2020 & 2033
- Table 44: Rest of Europe Soft Contact Lens Industry Volume (K Units) Forecast, by Application 2020 & 2033
- Table 45: Global Soft Contact Lens Industry Revenue billion Forecast, by Product Type 2020 & 2033
- Table 46: Global Soft Contact Lens Industry Volume K Units Forecast, by Product Type 2020 & 2033
- Table 47: Global Soft Contact Lens Industry Revenue billion Forecast, by Usages 2020 & 2033
- Table 48: Global Soft Contact Lens Industry Volume K Units Forecast, by Usages 2020 & 2033
- Table 49: Global Soft Contact Lens Industry Revenue billion Forecast, by Distribution Channel 2020 & 2033
- Table 50: Global Soft Contact Lens Industry Volume K Units Forecast, by Distribution Channel 2020 & 2033
- Table 51: Global Soft Contact Lens Industry Revenue billion Forecast, by Country 2020 & 2033
- Table 52: Global Soft Contact Lens Industry Volume K Units Forecast, by Country 2020 & 2033
- Table 53: China Soft Contact Lens Industry Revenue (billion) Forecast, by Application 2020 & 2033
- Table 54: China Soft Contact Lens Industry Volume (K Units) Forecast, by Application 2020 & 2033
- Table 55: Japan Soft Contact Lens Industry Revenue (billion) Forecast, by Application 2020 & 2033
- Table 56: Japan Soft Contact Lens Industry Volume (K Units) Forecast, by Application 2020 & 2033
- Table 57: India Soft Contact Lens Industry Revenue (billion) Forecast, by Application 2020 & 2033
- Table 58: India Soft Contact Lens Industry Volume (K Units) Forecast, by Application 2020 & 2033
- Table 59: Australia Soft Contact Lens Industry Revenue (billion) Forecast, by Application 2020 & 2033
- Table 60: Australia Soft Contact Lens Industry Volume (K Units) Forecast, by Application 2020 & 2033
- Table 61: Rest of Asia Pacific Soft Contact Lens Industry Revenue (billion) Forecast, by Application 2020 & 2033
- Table 62: Rest of Asia Pacific Soft Contact Lens Industry Volume (K Units) Forecast, by Application 2020 & 2033
- Table 63: Global Soft Contact Lens Industry Revenue billion Forecast, by Product Type 2020 & 2033
- Table 64: Global Soft Contact Lens Industry Volume K Units Forecast, by Product Type 2020 & 2033
- Table 65: Global Soft Contact Lens Industry Revenue billion Forecast, by Usages 2020 & 2033
- Table 66: Global Soft Contact Lens Industry Volume K Units Forecast, by Usages 2020 & 2033
- Table 67: Global Soft Contact Lens Industry Revenue billion Forecast, by Distribution Channel 2020 & 2033
- Table 68: Global Soft Contact Lens Industry Volume K Units Forecast, by Distribution Channel 2020 & 2033
- Table 69: Global Soft Contact Lens Industry Revenue billion Forecast, by Country 2020 & 2033
- Table 70: Global Soft Contact Lens Industry Volume K Units Forecast, by Country 2020 & 2033
- Table 71: Brazil Soft Contact Lens Industry Revenue (billion) Forecast, by Application 2020 & 2033
- Table 72: Brazil Soft Contact Lens Industry Volume (K Units) Forecast, by Application 2020 & 2033
- Table 73: Argentina Soft Contact Lens Industry Revenue (billion) Forecast, by Application 2020 & 2033
- Table 74: Argentina Soft Contact Lens Industry Volume (K Units) Forecast, by Application 2020 & 2033
- Table 75: Rest of South America Soft Contact Lens Industry Revenue (billion) Forecast, by Application 2020 & 2033
- Table 76: Rest of South America Soft Contact Lens Industry Volume (K Units) Forecast, by Application 2020 & 2033
- Table 77: Global Soft Contact Lens Industry Revenue billion Forecast, by Product Type 2020 & 2033
- Table 78: Global Soft Contact Lens Industry Volume K Units Forecast, by Product Type 2020 & 2033
- Table 79: Global Soft Contact Lens Industry Revenue billion Forecast, by Usages 2020 & 2033
- Table 80: Global Soft Contact Lens Industry Volume K Units Forecast, by Usages 2020 & 2033
- Table 81: Global Soft Contact Lens Industry Revenue billion Forecast, by Distribution Channel 2020 & 2033
- Table 82: Global Soft Contact Lens Industry Volume K Units Forecast, by Distribution Channel 2020 & 2033
- Table 83: Global Soft Contact Lens Industry Revenue billion Forecast, by Country 2020 & 2033
- Table 84: Global Soft Contact Lens Industry Volume K Units Forecast, by Country 2020 & 2033
- Table 85: South Africa Soft Contact Lens Industry Revenue (billion) Forecast, by Application 2020 & 2033
- Table 86: South Africa Soft Contact Lens Industry Volume (K Units) Forecast, by Application 2020 & 2033
- Table 87: United Arab Emirates Soft Contact Lens Industry Revenue (billion) Forecast, by Application 2020 & 2033
- Table 88: United Arab Emirates Soft Contact Lens Industry Volume (K Units) Forecast, by Application 2020 & 2033
- Table 89: Rest of Middle East and Africa Soft Contact Lens Industry Revenue (billion) Forecast, by Application 2020 & 2033
- Table 90: Rest of Middle East and Africa Soft Contact Lens Industry Volume (K Units) Forecast, by Application 2020 & 2033
Frequently Asked Questions
1. What is the projected Compound Annual Growth Rate (CAGR) of the Soft Contact Lens Industry?
The projected CAGR is approximately 6.21%.
2. Which companies are prominent players in the Soft Contact Lens Industry?
Key companies in the market include Zeiss Group, Novartis AG, Essilor International SA, The Cooper Companies, Johnson & Johnson Vision Care Inc *List Not Exhaustive, Bausch Health Companies Inc, Hoya Corporation.
3. What are the main segments of the Soft Contact Lens Industry?
The market segments include Product Type, Usages, Distribution Channel.
4. Can you provide details about the market size?
The market size is estimated to be USD 97.6 billion as of 2022.
5. What are some drivers contributing to market growth?
Increasing Sports Participation is Boosting the Market Growth; Increasing Innovation and Upgradation in Merchandizing Products.
6. What are the notable trends driving market growth?
Rigid Gas Permeable Contact Lenses Segment is Expected to Exhibit the Fastest Growth Rate over the Forecast Period.
7. Are there any restraints impacting market growth?
Availability of Counterfeit Sports Merchandise Products.
8. Can you provide examples of recent developments in the market?
N/A
9. What pricing options are available for accessing the report?
Pricing options include single-user, multi-user, and enterprise licenses priced at USD 4750, USD 5250, and USD 8750 respectively.
10. Is the market size provided in terms of value or volume?
The market size is provided in terms of value, measured in billion and volume, measured in K Units.
11. Are there any specific market keywords associated with the report?
Yes, the market keyword associated with the report is "Soft Contact Lens Industry," which aids in identifying and referencing the specific market segment covered.
12. How do I determine which pricing option suits my needs best?
The pricing options vary based on user requirements and access needs. Individual users may opt for single-user licenses, while businesses requiring broader access may choose multi-user or enterprise licenses for cost-effective access to the report.
13. Are there any additional resources or data provided in the Soft Contact Lens Industry report?
While the report offers comprehensive insights, it's advisable to review the specific contents or supplementary materials provided to ascertain if additional resources or data are available.
14. How can I stay updated on further developments or reports in the Soft Contact Lens Industry?
To stay informed about further developments, trends, and reports in the Soft Contact Lens Industry, consider subscribing to industry newsletters, following relevant companies and organizations, or regularly checking reputable industry news sources and publications.
Methodology
Step 1 - Identification of Relevant Samples Size from Population Database


Step 2 - Approaches for Defining Global Market Size (Value, Volume* & Price*)

Note*: In applicable scenarios
Step 3 - Data Sources
Primary Research
- Web Analytics
- Survey Reports
- Research Institute
- Latest Research Reports
- Opinion Leaders
Secondary Research
- Annual Reports
- White Paper
- Latest Press Release
- Industry Association
- Paid Database
- Investor Presentations

Step 4 - Data Triangulation
Involves using different sources of information in order to increase the validity of a study
These sources are likely to be stakeholders in a program - participants, other researchers, program staff, other community members, and so on.
Then we put all data in single framework & apply various statistical tools to find out the dynamic on the market.
During the analysis stage, feedback from the stakeholder groups would be compared to determine areas of agreement as well as areas of divergence