

Key Insights
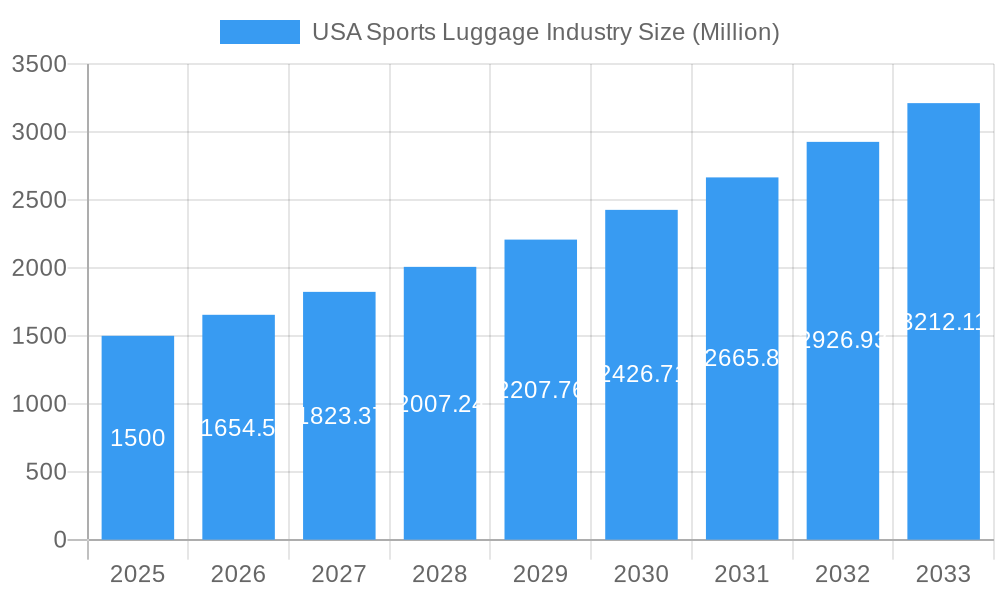
The US sports luggage market is forecast to reach $8.48 billion by 2033, expanding at a compound annual growth rate (CAGR) of 8.08% from the base year 2025. This growth is propelled by increasing sports participation, especially in golf, soccer, and baseball, driving demand for specialized, protective luggage. The surge in online retail offers greater product accessibility and brand visibility. Furthermore, the growing popularity of fitness and outdoor recreation activities supports market expansion, with consumers actively seeking high-quality, feature-rich solutions for their athletic pursuits.
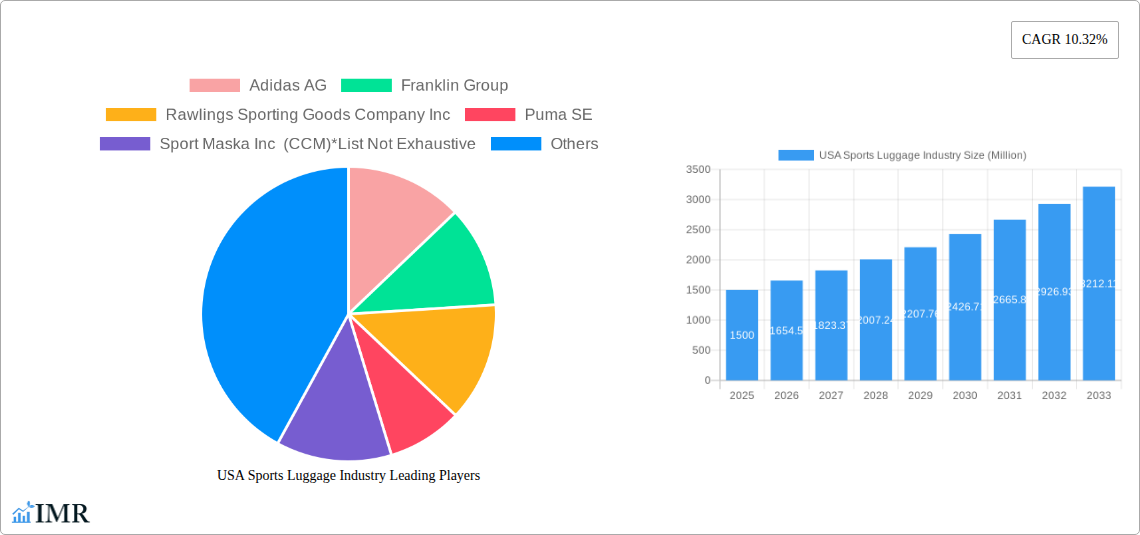
USA Sports Luggage Industry Market Size (In Billion)
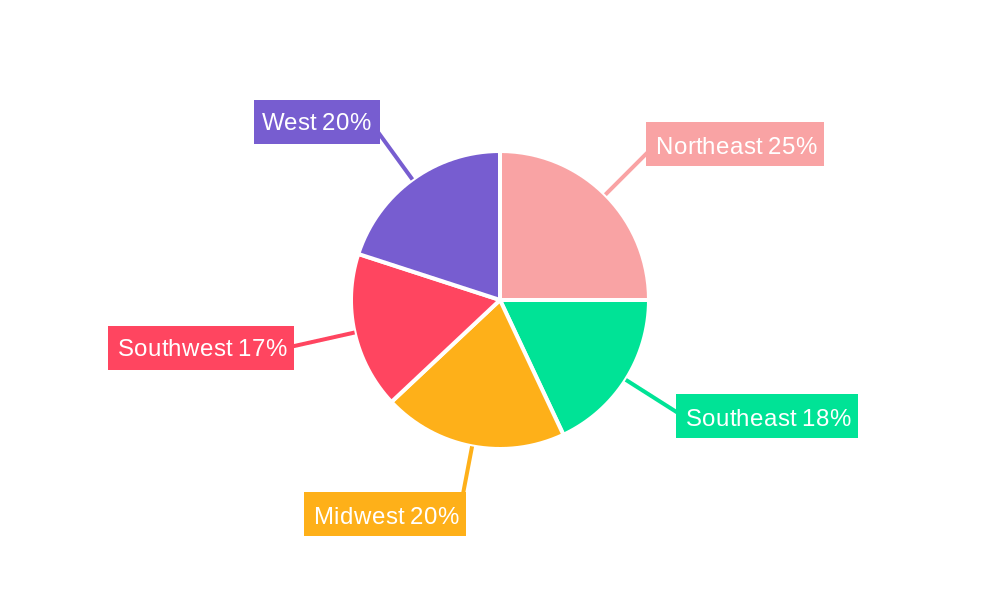
Key market restraints include volatility in raw material prices for durable components like polycarbonate and nylon, which affect production costs and pricing. Intense competition from established brands such as Nike, Adidas, Under Armour, and Puma, alongside new entrants, presents a dynamic competitive environment. Market segmentation indicates strong demand across sports categories, with golf and soccer being significant contributors. While online retail channels are gaining prominence, specialty stores remain crucial for discerning athletes seeking expert advice and premium offerings. Geographically, the Northeast and West regions exhibit higher market shares due to greater population density and robust sporting cultures.
USA Sports Luggage Industry Company Market Share
USA Sports Luggage Industry Market Report: 2019-2033
This comprehensive report provides an in-depth analysis of the USA sports luggage industry, offering invaluable insights for industry professionals, investors, and strategists. Covering the period 2019-2033, with a base year of 2025 and a forecast period of 2025-2033, this report leverages extensive primary and secondary research to deliver actionable intelligence. The report segments the market by sports type (Golf, Soccer, Baseball, Snow/Winter Sports, Football, Other Sports) and distribution channel (Supermarkets/Hypermarkets, Specialty Stores, Online Retailing, Other Distribution Channels), providing a granular understanding of market dynamics and growth opportunities. Key players like Adidas AG, Franklin Group, Rawlings Sporting Goods Company Inc, Puma SE, Sport Maska Inc (CCM), Under Armour Inc, Nike Inc, and Select Sport AS are analyzed, alongside emerging trends and challenges. The total market size in 2025 is estimated at xx Million units.
USA Sports Luggage Industry Market Dynamics & Structure
The USA sports luggage market exhibits a moderately concentrated structure, with a few dominant players holding significant market share. Technological innovation, particularly in materials science and design, is a key driver, pushing the boundaries of durability, lightweight construction, and functionality. Stringent safety regulations and environmental concerns influence product development and manufacturing processes. Competitive pressure from substitute products, such as backpacks and duffel bags designed for sports use, is notable. The market is shaped by evolving end-user demographics, with growing participation in various sports driving demand for specialized luggage. Mergers and acquisitions (M&A) activity has been moderate, primarily focused on expanding product portfolios and market reach.
- Market Concentration: Top 5 players hold approximately xx% market share in 2025.
- Technological Innovation: Focus on lightweight, durable materials (e.g., carbon fiber, ballistic nylon) and ergonomic designs.
- Regulatory Framework: Compliance with safety standards (e.g., for airline travel) and environmental regulations (e.g., material sourcing).
- Competitive Substitutes: Increased competition from general-purpose bags designed for sports activities.
- End-User Demographics: Growth driven by increasing participation in team and individual sports across age groups.
- M&A Trends: Moderate M&A activity primarily focusing on portfolio expansion and geographic reach. Approximately xx deals were recorded between 2019 and 2024.
USA Sports Luggage Industry Growth Trends & Insights
The USA sports luggage market experienced consistent growth during the historical period (2019-2024), with a CAGR of xx%. This growth is primarily attributed to increasing participation in sports and fitness activities, coupled with a rise in disposable income and consumer spending on sporting goods. Technological advancements, such as improved materials and designs, have enhanced product appeal. Changes in consumer behavior, such as a preference for online purchasing and personalized products, significantly impact market dynamics. Market penetration is estimated at xx% in 2025, with significant potential for future expansion. The forecast period (2025-2033) anticipates a CAGR of xx%, driven by continued growth in sports participation and emerging trends like sustainable and technologically advanced products.
Dominant Regions, Countries, or Segments in USA Sports Luggage Industry
The Northeastern and Western regions of the USA dominate the sports luggage market, driven by high population density, greater disposable incomes, and strong participation in various sports. Among sports types, Golf and Soccer show significant growth potential, fueled by their broad appeal and increasing participation rates. Specialty stores remain a dominant distribution channel, but online retailing is experiencing rapid growth, fueled by e-commerce's convenience and expanding reach.
- Leading Regions: Northeast and West Coast regions show highest market share and growth potential.
- Dominant Sports Type: Golf and Soccer segments demonstrate high growth, driven by popularity and increasing participation.
- Key Distribution Channel: Specialty stores maintain market leadership, but online retailing is a rapidly expanding channel.
- Growth Drivers: High disposable incomes in key regions, increasing participation in sports, and growth of e-commerce platforms.
USA Sports Luggage Industry Product Landscape
The sports luggage market showcases a wide array of products catering to diverse sports and user needs. Innovations focus on enhancing durability, weight reduction, and functionality through the use of advanced materials and designs. Features like integrated compartments for equipment, improved ergonomic designs, and enhanced protection mechanisms are crucial selling points. Technological advancements include the integration of tracking devices and smart features, improving convenience and security.
Key Drivers, Barriers & Challenges in USA Sports Luggage Industry
Key Drivers: Increasing participation in sports and fitness activities; rising disposable incomes; technological advancements leading to improved product features; and the growing popularity of online retail channels.
Challenges: Intense competition from established brands and new entrants; fluctuating raw material costs; supply chain disruptions; and maintaining environmental sustainability. The impact of supply chain issues on market growth in 2024 was approximately xx%.
Emerging Opportunities in USA Sports Luggage Industry
Emerging opportunities include the growing demand for eco-friendly and sustainable products made from recycled materials; the integration of smart technologies; and the personalization of luggage to meet individual athlete needs. Untapped markets exist in niche sports and specialized athletic activities.
Growth Accelerators in the USA Sports Luggage Industry
Long-term growth will be fueled by strategic partnerships to expand market reach and distribution networks, investments in R&D to develop innovative products, and the development of more personalized and customized luggage options. The expansion into untapped markets, such as e-sports, will create further opportunities.
Key Players Shaping the USA Sports Luggage Industry Market
- Adidas AG
- Franklin Group
- Rawlings Sporting Goods Company Inc
- Puma SE
- Sport Maska Inc (CCM)
- Under Armour Inc
- Nike Inc
- Select Sport AS
Notable Milestones in USA Sports Luggage Industry Sector
- 2020: Several major players introduced sustainable and eco-friendly luggage lines.
- 2021: Significant investment in research and development of smart luggage technology.
- 2022: Increased adoption of online retail channels by major brands.
- 2023: A key merger between two mid-sized luggage manufacturers expanded market share.
In-Depth USA Sports Luggage Industry Market Outlook
The USA sports luggage market presents strong growth potential, driven by sustained interest in sports and fitness, evolving consumer preferences, and continuous technological advancements. Strategic partnerships, focusing on market expansion and sustainable product development, will be vital for success. The continued rise of e-commerce and the integration of smart technologies will reshape the competitive landscape, offering significant opportunities for innovation and growth. The market is projected to reach xx Million units by 2033.
USA Sports Luggage Industry Segmentation
-
1. Sports Type
- 1.1. Golf
- 1.2. Soccer
- 1.3. Baseball
- 1.4. Snow/Winter Sports
- 1.5. Football
- 1.6. Other Sports
-
2. Distribution Channel
- 2.1. Supermarkets/Hypermarkets
- 2.2. Specialty Stores
- 2.3. Online Retailing
- 2.4. Other Distribution Channels
USA Sports Luggage Industry Segmentation By Geography
-
1. North America
- 1.1. United States
- 1.2. Canada
- 1.3. Mexico
-
2. South America
- 2.1. Brazil
- 2.2. Argentina
- 2.3. Rest of South America
-
3. Europe
- 3.1. United Kingdom
- 3.2. Germany
- 3.3. France
- 3.4. Italy
- 3.5. Spain
- 3.6. Russia
- 3.7. Benelux
- 3.8. Nordics
- 3.9. Rest of Europe
-
4. Middle East & Africa
- 4.1. Turkey
- 4.2. Israel
- 4.3. GCC
- 4.4. North Africa
- 4.5. South Africa
- 4.6. Rest of Middle East & Africa
-
5. Asia Pacific
- 5.1. China
- 5.2. India
- 5.3. Japan
- 5.4. South Korea
- 5.5. ASEAN
- 5.6. Oceania
- 5.7. Rest of Asia Pacific
USA Sports Luggage Industry Regional Market Share
Geographic Coverage of USA Sports Luggage Industry
USA Sports Luggage Industry REPORT HIGHLIGHTS
| Aspects | Details |
|---|---|
| Study Period | 2020-2034 |
| Base Year | 2025 |
| Estimated Year | 2026 |
| Forecast Period | 2026-2034 |
| Historical Period | 2020-2025 |
| Growth Rate | CAGR of 8.08% from 2020-2034 |
| Segmentation |
|
Table of Contents
- 1. Introduction
- 1.1. Research Scope
- 1.2. Market Segmentation
- 1.3. Research Objective
- 1.4. Definitions and Assumptions
- 2. Executive Summary
- 2.1. Market Snapshot
- 3. Market Dynamics
- 3.1. Market Drivers
- 3.2. Market Restrains
- 3.3. Market Trends
- 3.4. Market Opportunities
- 4. Market Factor Analysis
- 4.1. Porters Five Forces
- 4.1.1. Bargaining Power of Suppliers
- 4.1.2. Bargaining Power of Buyers
- 4.1.3. Threat of New Entrants
- 4.1.4. Threat of Substitutes
- 4.1.5. Competitive Rivalry
- 4.2. PESTEL analysis
- 4.3. BCG Analysis
- 4.3.1. Stars (High Growth, High Market Share)
- 4.3.2. Cash Cows (Low Growth, High Market Share)
- 4.3.3. Question Mark (High Growth, Low Market Share)
- 4.3.4. Dogs (Low Growth, Low Market Share)
- 4.4. Ansoff Matrix Analysis
- 4.5. Supply Chain Analysis
- 4.6. Regulatory Landscape
- 4.7. Current Market Potential and Opportunity Assessment (TAM–SAM–SOM Framework)
- 4.8. IMR Analyst Note
- 4.1. Porters Five Forces
- 5. Market Analysis, Insights and Forecast 2021-2033
- 5.1. Market Analysis, Insights and Forecast - by Sports Type
- 5.1.1. Golf
- 5.1.2. Soccer
- 5.1.3. Baseball
- 5.1.4. Snow/Winter Sports
- 5.1.5. Football
- 5.1.6. Other Sports
- 5.2. Market Analysis, Insights and Forecast - by Distribution Channel
- 5.2.1. Supermarkets/Hypermarkets
- 5.2.2. Specialty Stores
- 5.2.3. Online Retailing
- 5.2.4. Other Distribution Channels
- 5.3. Market Analysis, Insights and Forecast - by Region
- 5.3.1. North America
- 5.3.2. South America
- 5.3.3. Europe
- 5.3.4. Middle East & Africa
- 5.3.5. Asia Pacific
- 5.1. Market Analysis, Insights and Forecast - by Sports Type
- 6. Global USA Sports Luggage Industry Analysis, Insights and Forecast, 2021-2033
- 6.1. Market Analysis, Insights and Forecast - by Sports Type
- 6.1.1. Golf
- 6.1.2. Soccer
- 6.1.3. Baseball
- 6.1.4. Snow/Winter Sports
- 6.1.5. Football
- 6.1.6. Other Sports
- 6.2. Market Analysis, Insights and Forecast - by Distribution Channel
- 6.2.1. Supermarkets/Hypermarkets
- 6.2.2. Specialty Stores
- 6.2.3. Online Retailing
- 6.2.4. Other Distribution Channels
- 6.1. Market Analysis, Insights and Forecast - by Sports Type
- 7. North America USA Sports Luggage Industry Analysis, Insights and Forecast, 2020-2032
- 7.1. Market Analysis, Insights and Forecast - by Sports Type
- 7.1.1. Golf
- 7.1.2. Soccer
- 7.1.3. Baseball
- 7.1.4. Snow/Winter Sports
- 7.1.5. Football
- 7.1.6. Other Sports
- 7.2. Market Analysis, Insights and Forecast - by Distribution Channel
- 7.2.1. Supermarkets/Hypermarkets
- 7.2.2. Specialty Stores
- 7.2.3. Online Retailing
- 7.2.4. Other Distribution Channels
- 7.1. Market Analysis, Insights and Forecast - by Sports Type
- 8. South America USA Sports Luggage Industry Analysis, Insights and Forecast, 2020-2032
- 8.1. Market Analysis, Insights and Forecast - by Sports Type
- 8.1.1. Golf
- 8.1.2. Soccer
- 8.1.3. Baseball
- 8.1.4. Snow/Winter Sports
- 8.1.5. Football
- 8.1.6. Other Sports
- 8.2. Market Analysis, Insights and Forecast - by Distribution Channel
- 8.2.1. Supermarkets/Hypermarkets
- 8.2.2. Specialty Stores
- 8.2.3. Online Retailing
- 8.2.4. Other Distribution Channels
- 8.1. Market Analysis, Insights and Forecast - by Sports Type
- 9. Europe USA Sports Luggage Industry Analysis, Insights and Forecast, 2020-2032
- 9.1. Market Analysis, Insights and Forecast - by Sports Type
- 9.1.1. Golf
- 9.1.2. Soccer
- 9.1.3. Baseball
- 9.1.4. Snow/Winter Sports
- 9.1.5. Football
- 9.1.6. Other Sports
- 9.2. Market Analysis, Insights and Forecast - by Distribution Channel
- 9.2.1. Supermarkets/Hypermarkets
- 9.2.2. Specialty Stores
- 9.2.3. Online Retailing
- 9.2.4. Other Distribution Channels
- 9.1. Market Analysis, Insights and Forecast - by Sports Type
- 10. Middle East & Africa USA Sports Luggage Industry Analysis, Insights and Forecast, 2020-2032
- 10.1. Market Analysis, Insights and Forecast - by Sports Type
- 10.1.1. Golf
- 10.1.2. Soccer
- 10.1.3. Baseball
- 10.1.4. Snow/Winter Sports
- 10.1.5. Football
- 10.1.6. Other Sports
- 10.2. Market Analysis, Insights and Forecast - by Distribution Channel
- 10.2.1. Supermarkets/Hypermarkets
- 10.2.2. Specialty Stores
- 10.2.3. Online Retailing
- 10.2.4. Other Distribution Channels
- 10.1. Market Analysis, Insights and Forecast - by Sports Type
- 11. Asia Pacific USA Sports Luggage Industry Analysis, Insights and Forecast, 2020-2032
- 11.1. Market Analysis, Insights and Forecast - by Sports Type
- 11.1.1. Golf
- 11.1.2. Soccer
- 11.1.3. Baseball
- 11.1.4. Snow/Winter Sports
- 11.1.5. Football
- 11.1.6. Other Sports
- 11.2. Market Analysis, Insights and Forecast - by Distribution Channel
- 11.2.1. Supermarkets/Hypermarkets
- 11.2.2. Specialty Stores
- 11.2.3. Online Retailing
- 11.2.4. Other Distribution Channels
- 11.1. Market Analysis, Insights and Forecast - by Sports Type
- 12. Competitive Analysis
- 12.1. Company Profiles
- 12.1.1 Adidas AG
- 12.1.1.1. Company Overview
- 12.1.1.2. Products
- 12.1.1.3. Company Financials
- 12.1.1.4. SWOT Analysis
- 12.1.2 Franklin Group
- 12.1.2.1. Company Overview
- 12.1.2.2. Products
- 12.1.2.3. Company Financials
- 12.1.2.4. SWOT Analysis
- 12.1.3 Rawlings Sporting Goods Company Inc
- 12.1.3.1. Company Overview
- 12.1.3.2. Products
- 12.1.3.3. Company Financials
- 12.1.3.4. SWOT Analysis
- 12.1.4 Puma SE
- 12.1.4.1. Company Overview
- 12.1.4.2. Products
- 12.1.4.3. Company Financials
- 12.1.4.4. SWOT Analysis
- 12.1.5 Sport Maska Inc (CCM)*List Not Exhaustive
- 12.1.5.1. Company Overview
- 12.1.5.2. Products
- 12.1.5.3. Company Financials
- 12.1.5.4. SWOT Analysis
- 12.1.6 Under Armour Inc
- 12.1.6.1. Company Overview
- 12.1.6.2. Products
- 12.1.6.3. Company Financials
- 12.1.6.4. SWOT Analysis
- 12.1.7 Nike Inc
- 12.1.7.1. Company Overview
- 12.1.7.2. Products
- 12.1.7.3. Company Financials
- 12.1.7.4. SWOT Analysis
- 12.1.8 Select Sport AS
- 12.1.8.1. Company Overview
- 12.1.8.2. Products
- 12.1.8.3. Company Financials
- 12.1.8.4. SWOT Analysis
- 12.1.1 Adidas AG
- 12.2. Market Entropy
- 12.2.1 Company's Key Areas Served
- 12.2.2 Recent Developments
- 12.3. Company Market Share Analysis 2025
- 12.3.1 Top 5 Companies Market Share Analysis
- 12.3.2 Top 3 Companies Market Share Analysis
- 12.4. List of Potential Customers
- 13. Research Methodology
List of Figures
- Figure 1: Global USA Sports Luggage Industry Revenue Breakdown (billion, %) by Region 2025 & 2033
- Figure 2: Global USA Sports Luggage Industry Volume Breakdown (K Units, %) by Region 2025 & 2033
- Figure 3: North America USA Sports Luggage Industry Revenue (billion), by Sports Type 2025 & 2033
- Figure 4: North America USA Sports Luggage Industry Volume (K Units), by Sports Type 2025 & 2033
- Figure 5: North America USA Sports Luggage Industry Revenue Share (%), by Sports Type 2025 & 2033
- Figure 6: North America USA Sports Luggage Industry Volume Share (%), by Sports Type 2025 & 2033
- Figure 7: North America USA Sports Luggage Industry Revenue (billion), by Distribution Channel 2025 & 2033
- Figure 8: North America USA Sports Luggage Industry Volume (K Units), by Distribution Channel 2025 & 2033
- Figure 9: North America USA Sports Luggage Industry Revenue Share (%), by Distribution Channel 2025 & 2033
- Figure 10: North America USA Sports Luggage Industry Volume Share (%), by Distribution Channel 2025 & 2033
- Figure 11: North America USA Sports Luggage Industry Revenue (billion), by Country 2025 & 2033
- Figure 12: North America USA Sports Luggage Industry Volume (K Units), by Country 2025 & 2033
- Figure 13: North America USA Sports Luggage Industry Revenue Share (%), by Country 2025 & 2033
- Figure 14: North America USA Sports Luggage Industry Volume Share (%), by Country 2025 & 2033
- Figure 15: South America USA Sports Luggage Industry Revenue (billion), by Sports Type 2025 & 2033
- Figure 16: South America USA Sports Luggage Industry Volume (K Units), by Sports Type 2025 & 2033
- Figure 17: South America USA Sports Luggage Industry Revenue Share (%), by Sports Type 2025 & 2033
- Figure 18: South America USA Sports Luggage Industry Volume Share (%), by Sports Type 2025 & 2033
- Figure 19: South America USA Sports Luggage Industry Revenue (billion), by Distribution Channel 2025 & 2033
- Figure 20: South America USA Sports Luggage Industry Volume (K Units), by Distribution Channel 2025 & 2033
- Figure 21: South America USA Sports Luggage Industry Revenue Share (%), by Distribution Channel 2025 & 2033
- Figure 22: South America USA Sports Luggage Industry Volume Share (%), by Distribution Channel 2025 & 2033
- Figure 23: South America USA Sports Luggage Industry Revenue (billion), by Country 2025 & 2033
- Figure 24: South America USA Sports Luggage Industry Volume (K Units), by Country 2025 & 2033
- Figure 25: South America USA Sports Luggage Industry Revenue Share (%), by Country 2025 & 2033
- Figure 26: South America USA Sports Luggage Industry Volume Share (%), by Country 2025 & 2033
- Figure 27: Europe USA Sports Luggage Industry Revenue (billion), by Sports Type 2025 & 2033
- Figure 28: Europe USA Sports Luggage Industry Volume (K Units), by Sports Type 2025 & 2033
- Figure 29: Europe USA Sports Luggage Industry Revenue Share (%), by Sports Type 2025 & 2033
- Figure 30: Europe USA Sports Luggage Industry Volume Share (%), by Sports Type 2025 & 2033
- Figure 31: Europe USA Sports Luggage Industry Revenue (billion), by Distribution Channel 2025 & 2033
- Figure 32: Europe USA Sports Luggage Industry Volume (K Units), by Distribution Channel 2025 & 2033
- Figure 33: Europe USA Sports Luggage Industry Revenue Share (%), by Distribution Channel 2025 & 2033
- Figure 34: Europe USA Sports Luggage Industry Volume Share (%), by Distribution Channel 2025 & 2033
- Figure 35: Europe USA Sports Luggage Industry Revenue (billion), by Country 2025 & 2033
- Figure 36: Europe USA Sports Luggage Industry Volume (K Units), by Country 2025 & 2033
- Figure 37: Europe USA Sports Luggage Industry Revenue Share (%), by Country 2025 & 2033
- Figure 38: Europe USA Sports Luggage Industry Volume Share (%), by Country 2025 & 2033
- Figure 39: Middle East & Africa USA Sports Luggage Industry Revenue (billion), by Sports Type 2025 & 2033
- Figure 40: Middle East & Africa USA Sports Luggage Industry Volume (K Units), by Sports Type 2025 & 2033
- Figure 41: Middle East & Africa USA Sports Luggage Industry Revenue Share (%), by Sports Type 2025 & 2033
- Figure 42: Middle East & Africa USA Sports Luggage Industry Volume Share (%), by Sports Type 2025 & 2033
- Figure 43: Middle East & Africa USA Sports Luggage Industry Revenue (billion), by Distribution Channel 2025 & 2033
- Figure 44: Middle East & Africa USA Sports Luggage Industry Volume (K Units), by Distribution Channel 2025 & 2033
- Figure 45: Middle East & Africa USA Sports Luggage Industry Revenue Share (%), by Distribution Channel 2025 & 2033
- Figure 46: Middle East & Africa USA Sports Luggage Industry Volume Share (%), by Distribution Channel 2025 & 2033
- Figure 47: Middle East & Africa USA Sports Luggage Industry Revenue (billion), by Country 2025 & 2033
- Figure 48: Middle East & Africa USA Sports Luggage Industry Volume (K Units), by Country 2025 & 2033
- Figure 49: Middle East & Africa USA Sports Luggage Industry Revenue Share (%), by Country 2025 & 2033
- Figure 50: Middle East & Africa USA Sports Luggage Industry Volume Share (%), by Country 2025 & 2033
- Figure 51: Asia Pacific USA Sports Luggage Industry Revenue (billion), by Sports Type 2025 & 2033
- Figure 52: Asia Pacific USA Sports Luggage Industry Volume (K Units), by Sports Type 2025 & 2033
- Figure 53: Asia Pacific USA Sports Luggage Industry Revenue Share (%), by Sports Type 2025 & 2033
- Figure 54: Asia Pacific USA Sports Luggage Industry Volume Share (%), by Sports Type 2025 & 2033
- Figure 55: Asia Pacific USA Sports Luggage Industry Revenue (billion), by Distribution Channel 2025 & 2033
- Figure 56: Asia Pacific USA Sports Luggage Industry Volume (K Units), by Distribution Channel 2025 & 2033
- Figure 57: Asia Pacific USA Sports Luggage Industry Revenue Share (%), by Distribution Channel 2025 & 2033
- Figure 58: Asia Pacific USA Sports Luggage Industry Volume Share (%), by Distribution Channel 2025 & 2033
- Figure 59: Asia Pacific USA Sports Luggage Industry Revenue (billion), by Country 2025 & 2033
- Figure 60: Asia Pacific USA Sports Luggage Industry Volume (K Units), by Country 2025 & 2033
- Figure 61: Asia Pacific USA Sports Luggage Industry Revenue Share (%), by Country 2025 & 2033
- Figure 62: Asia Pacific USA Sports Luggage Industry Volume Share (%), by Country 2025 & 2033
List of Tables
- Table 1: Global USA Sports Luggage Industry Revenue billion Forecast, by Sports Type 2020 & 2033
- Table 2: Global USA Sports Luggage Industry Volume K Units Forecast, by Sports Type 2020 & 2033
- Table 3: Global USA Sports Luggage Industry Revenue billion Forecast, by Distribution Channel 2020 & 2033
- Table 4: Global USA Sports Luggage Industry Volume K Units Forecast, by Distribution Channel 2020 & 2033
- Table 5: Global USA Sports Luggage Industry Revenue billion Forecast, by Region 2020 & 2033
- Table 6: Global USA Sports Luggage Industry Volume K Units Forecast, by Region 2020 & 2033
- Table 7: Global USA Sports Luggage Industry Revenue billion Forecast, by Sports Type 2020 & 2033
- Table 8: Global USA Sports Luggage Industry Volume K Units Forecast, by Sports Type 2020 & 2033
- Table 9: Global USA Sports Luggage Industry Revenue billion Forecast, by Distribution Channel 2020 & 2033
- Table 10: Global USA Sports Luggage Industry Volume K Units Forecast, by Distribution Channel 2020 & 2033
- Table 11: Global USA Sports Luggage Industry Revenue billion Forecast, by Country 2020 & 2033
- Table 12: Global USA Sports Luggage Industry Volume K Units Forecast, by Country 2020 & 2033
- Table 13: United States USA Sports Luggage Industry Revenue (billion) Forecast, by Application 2020 & 2033
- Table 14: United States USA Sports Luggage Industry Volume (K Units) Forecast, by Application 2020 & 2033
- Table 15: Canada USA Sports Luggage Industry Revenue (billion) Forecast, by Application 2020 & 2033
- Table 16: Canada USA Sports Luggage Industry Volume (K Units) Forecast, by Application 2020 & 2033
- Table 17: Mexico USA Sports Luggage Industry Revenue (billion) Forecast, by Application 2020 & 2033
- Table 18: Mexico USA Sports Luggage Industry Volume (K Units) Forecast, by Application 2020 & 2033
- Table 19: Global USA Sports Luggage Industry Revenue billion Forecast, by Sports Type 2020 & 2033
- Table 20: Global USA Sports Luggage Industry Volume K Units Forecast, by Sports Type 2020 & 2033
- Table 21: Global USA Sports Luggage Industry Revenue billion Forecast, by Distribution Channel 2020 & 2033
- Table 22: Global USA Sports Luggage Industry Volume K Units Forecast, by Distribution Channel 2020 & 2033
- Table 23: Global USA Sports Luggage Industry Revenue billion Forecast, by Country 2020 & 2033
- Table 24: Global USA Sports Luggage Industry Volume K Units Forecast, by Country 2020 & 2033
- Table 25: Brazil USA Sports Luggage Industry Revenue (billion) Forecast, by Application 2020 & 2033
- Table 26: Brazil USA Sports Luggage Industry Volume (K Units) Forecast, by Application 2020 & 2033
- Table 27: Argentina USA Sports Luggage Industry Revenue (billion) Forecast, by Application 2020 & 2033
- Table 28: Argentina USA Sports Luggage Industry Volume (K Units) Forecast, by Application 2020 & 2033
- Table 29: Rest of South America USA Sports Luggage Industry Revenue (billion) Forecast, by Application 2020 & 2033
- Table 30: Rest of South America USA Sports Luggage Industry Volume (K Units) Forecast, by Application 2020 & 2033
- Table 31: Global USA Sports Luggage Industry Revenue billion Forecast, by Sports Type 2020 & 2033
- Table 32: Global USA Sports Luggage Industry Volume K Units Forecast, by Sports Type 2020 & 2033
- Table 33: Global USA Sports Luggage Industry Revenue billion Forecast, by Distribution Channel 2020 & 2033
- Table 34: Global USA Sports Luggage Industry Volume K Units Forecast, by Distribution Channel 2020 & 2033
- Table 35: Global USA Sports Luggage Industry Revenue billion Forecast, by Country 2020 & 2033
- Table 36: Global USA Sports Luggage Industry Volume K Units Forecast, by Country 2020 & 2033
- Table 37: United Kingdom USA Sports Luggage Industry Revenue (billion) Forecast, by Application 2020 & 2033
- Table 38: United Kingdom USA Sports Luggage Industry Volume (K Units) Forecast, by Application 2020 & 2033
- Table 39: Germany USA Sports Luggage Industry Revenue (billion) Forecast, by Application 2020 & 2033
- Table 40: Germany USA Sports Luggage Industry Volume (K Units) Forecast, by Application 2020 & 2033
- Table 41: France USA Sports Luggage Industry Revenue (billion) Forecast, by Application 2020 & 2033
- Table 42: France USA Sports Luggage Industry Volume (K Units) Forecast, by Application 2020 & 2033
- Table 43: Italy USA Sports Luggage Industry Revenue (billion) Forecast, by Application 2020 & 2033
- Table 44: Italy USA Sports Luggage Industry Volume (K Units) Forecast, by Application 2020 & 2033
- Table 45: Spain USA Sports Luggage Industry Revenue (billion) Forecast, by Application 2020 & 2033
- Table 46: Spain USA Sports Luggage Industry Volume (K Units) Forecast, by Application 2020 & 2033
- Table 47: Russia USA Sports Luggage Industry Revenue (billion) Forecast, by Application 2020 & 2033
- Table 48: Russia USA Sports Luggage Industry Volume (K Units) Forecast, by Application 2020 & 2033
- Table 49: Benelux USA Sports Luggage Industry Revenue (billion) Forecast, by Application 2020 & 2033
- Table 50: Benelux USA Sports Luggage Industry Volume (K Units) Forecast, by Application 2020 & 2033
- Table 51: Nordics USA Sports Luggage Industry Revenue (billion) Forecast, by Application 2020 & 2033
- Table 52: Nordics USA Sports Luggage Industry Volume (K Units) Forecast, by Application 2020 & 2033
- Table 53: Rest of Europe USA Sports Luggage Industry Revenue (billion) Forecast, by Application 2020 & 2033
- Table 54: Rest of Europe USA Sports Luggage Industry Volume (K Units) Forecast, by Application 2020 & 2033
- Table 55: Global USA Sports Luggage Industry Revenue billion Forecast, by Sports Type 2020 & 2033
- Table 56: Global USA Sports Luggage Industry Volume K Units Forecast, by Sports Type 2020 & 2033
- Table 57: Global USA Sports Luggage Industry Revenue billion Forecast, by Distribution Channel 2020 & 2033
- Table 58: Global USA Sports Luggage Industry Volume K Units Forecast, by Distribution Channel 2020 & 2033
- Table 59: Global USA Sports Luggage Industry Revenue billion Forecast, by Country 2020 & 2033
- Table 60: Global USA Sports Luggage Industry Volume K Units Forecast, by Country 2020 & 2033
- Table 61: Turkey USA Sports Luggage Industry Revenue (billion) Forecast, by Application 2020 & 2033
- Table 62: Turkey USA Sports Luggage Industry Volume (K Units) Forecast, by Application 2020 & 2033
- Table 63: Israel USA Sports Luggage Industry Revenue (billion) Forecast, by Application 2020 & 2033
- Table 64: Israel USA Sports Luggage Industry Volume (K Units) Forecast, by Application 2020 & 2033
- Table 65: GCC USA Sports Luggage Industry Revenue (billion) Forecast, by Application 2020 & 2033
- Table 66: GCC USA Sports Luggage Industry Volume (K Units) Forecast, by Application 2020 & 2033
- Table 67: North Africa USA Sports Luggage Industry Revenue (billion) Forecast, by Application 2020 & 2033
- Table 68: North Africa USA Sports Luggage Industry Volume (K Units) Forecast, by Application 2020 & 2033
- Table 69: South Africa USA Sports Luggage Industry Revenue (billion) Forecast, by Application 2020 & 2033
- Table 70: South Africa USA Sports Luggage Industry Volume (K Units) Forecast, by Application 2020 & 2033
- Table 71: Rest of Middle East & Africa USA Sports Luggage Industry Revenue (billion) Forecast, by Application 2020 & 2033
- Table 72: Rest of Middle East & Africa USA Sports Luggage Industry Volume (K Units) Forecast, by Application 2020 & 2033
- Table 73: Global USA Sports Luggage Industry Revenue billion Forecast, by Sports Type 2020 & 2033
- Table 74: Global USA Sports Luggage Industry Volume K Units Forecast, by Sports Type 2020 & 2033
- Table 75: Global USA Sports Luggage Industry Revenue billion Forecast, by Distribution Channel 2020 & 2033
- Table 76: Global USA Sports Luggage Industry Volume K Units Forecast, by Distribution Channel 2020 & 2033
- Table 77: Global USA Sports Luggage Industry Revenue billion Forecast, by Country 2020 & 2033
- Table 78: Global USA Sports Luggage Industry Volume K Units Forecast, by Country 2020 & 2033
- Table 79: China USA Sports Luggage Industry Revenue (billion) Forecast, by Application 2020 & 2033
- Table 80: China USA Sports Luggage Industry Volume (K Units) Forecast, by Application 2020 & 2033
- Table 81: India USA Sports Luggage Industry Revenue (billion) Forecast, by Application 2020 & 2033
- Table 82: India USA Sports Luggage Industry Volume (K Units) Forecast, by Application 2020 & 2033
- Table 83: Japan USA Sports Luggage Industry Revenue (billion) Forecast, by Application 2020 & 2033
- Table 84: Japan USA Sports Luggage Industry Volume (K Units) Forecast, by Application 2020 & 2033
- Table 85: South Korea USA Sports Luggage Industry Revenue (billion) Forecast, by Application 2020 & 2033
- Table 86: South Korea USA Sports Luggage Industry Volume (K Units) Forecast, by Application 2020 & 2033
- Table 87: ASEAN USA Sports Luggage Industry Revenue (billion) Forecast, by Application 2020 & 2033
- Table 88: ASEAN USA Sports Luggage Industry Volume (K Units) Forecast, by Application 2020 & 2033
- Table 89: Oceania USA Sports Luggage Industry Revenue (billion) Forecast, by Application 2020 & 2033
- Table 90: Oceania USA Sports Luggage Industry Volume (K Units) Forecast, by Application 2020 & 2033
- Table 91: Rest of Asia Pacific USA Sports Luggage Industry Revenue (billion) Forecast, by Application 2020 & 2033
- Table 92: Rest of Asia Pacific USA Sports Luggage Industry Volume (K Units) Forecast, by Application 2020 & 2033
Frequently Asked Questions
1. What is the projected Compound Annual Growth Rate (CAGR) of the USA Sports Luggage Industry?
The projected CAGR is approximately 8.08%.
2. Which companies are prominent players in the USA Sports Luggage Industry?
Key companies in the market include Adidas AG, Franklin Group, Rawlings Sporting Goods Company Inc, Puma SE, Sport Maska Inc (CCM)*List Not Exhaustive, Under Armour Inc, Nike Inc, Select Sport AS.
3. What are the main segments of the USA Sports Luggage Industry?
The market segments include Sports Type, Distribution Channel.
4. Can you provide details about the market size?
The market size is estimated to be USD 8.48 billion as of 2022.
5. What are some drivers contributing to market growth?
Surging Demand for Athleisure Footwear; Aggressive Marketing by Brands.
6. What are the notable trends driving market growth?
Growing Influence of Athleisure and Health Wellness Trends.
7. Are there any restraints impacting market growth?
Extensive Availability of Counterfeit Products.
8. Can you provide examples of recent developments in the market?
N/A
9. What pricing options are available for accessing the report?
Pricing options include single-user, multi-user, and enterprise licenses priced at USD 3800, USD 4500, and USD 5800 respectively.
10. Is the market size provided in terms of value or volume?
The market size is provided in terms of value, measured in billion and volume, measured in K Units.
11. Are there any specific market keywords associated with the report?
Yes, the market keyword associated with the report is "USA Sports Luggage Industry," which aids in identifying and referencing the specific market segment covered.
12. How do I determine which pricing option suits my needs best?
The pricing options vary based on user requirements and access needs. Individual users may opt for single-user licenses, while businesses requiring broader access may choose multi-user or enterprise licenses for cost-effective access to the report.
13. Are there any additional resources or data provided in the USA Sports Luggage Industry report?
While the report offers comprehensive insights, it's advisable to review the specific contents or supplementary materials provided to ascertain if additional resources or data are available.
14. How can I stay updated on further developments or reports in the USA Sports Luggage Industry?
To stay informed about further developments, trends, and reports in the USA Sports Luggage Industry, consider subscribing to industry newsletters, following relevant companies and organizations, or regularly checking reputable industry news sources and publications.
Methodology
Step 1 - Identification of Relevant Samples Size from Population Database


Step 2 - Approaches for Defining Global Market Size (Value, Volume* & Price*)

Note*: In applicable scenarios
Step 3 - Data Sources
Primary Research
- Web Analytics
- Survey Reports
- Research Institute
- Latest Research Reports
- Opinion Leaders
Secondary Research
- Annual Reports
- White Paper
- Latest Press Release
- Industry Association
- Paid Database
- Investor Presentations

Step 4 - Data Triangulation
Involves using different sources of information in order to increase the validity of a study
These sources are likely to be stakeholders in a program - participants, other researchers, program staff, other community members, and so on.
Then we put all data in single framework & apply various statistical tools to find out the dynamic on the market.
During the analysis stage, feedback from the stakeholder groups would be compared to determine areas of agreement as well as areas of divergence