

Key Insights
The Asia-Pacific (APAC) energy storage sector is experiencing substantial expansion, propelled by rising electricity consumption, the increasing integration of renewable energy, and supportive government initiatives focused on climate change mitigation. The market, valued at $28.61 billion in 2025, is projected to achieve a Compound Annual Growth Rate (CAGR) of 16.9% through 2033. Key growth catalysts include the expanding adoption of electric vehicles (EVs), the escalating demand for backup power solutions across residential and commercial sectors, and the widespread deployment of grid-scale energy storage systems to bolster grid stability and reliability. Significant investments in renewable energy infrastructure, particularly solar and wind power, further enhance the demand for energy storage solutions. Technological advancements, especially in lithium-ion battery technology, are driving improvements in performance, cost reduction, and extended lifespan, rendering energy storage more economically viable across diverse applications. Market segmentation indicates a strong preference for lithium-ion batteries, dominating the technology landscape due to their superior energy density and efficiency compared to lead-acid and nickel-metal hydride alternatives. China, India, Japan, and South Korea are prominent regional markets, making substantial contributions to the overall growth of the APAC energy storage industry.
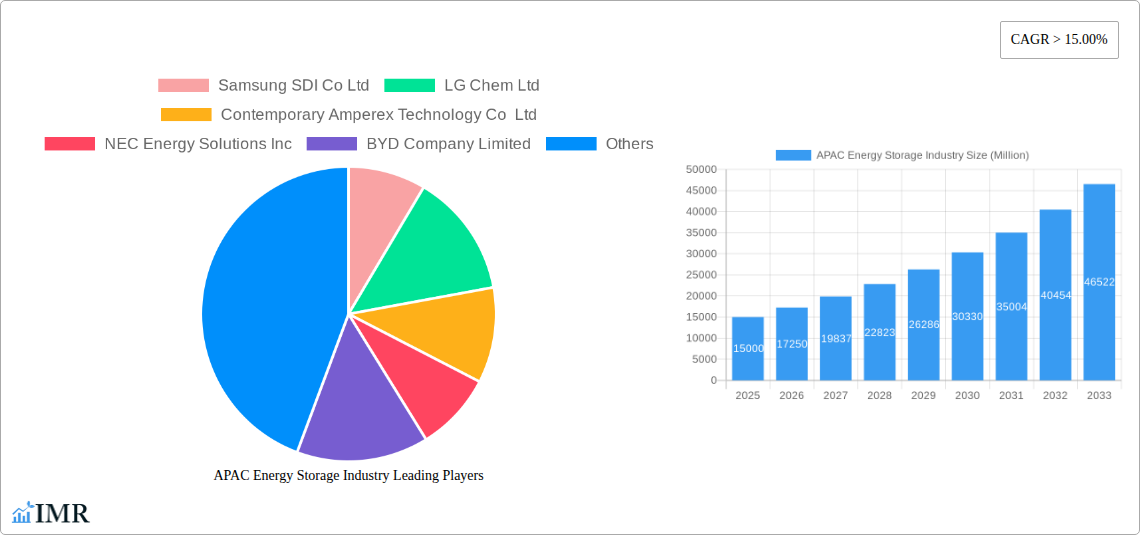
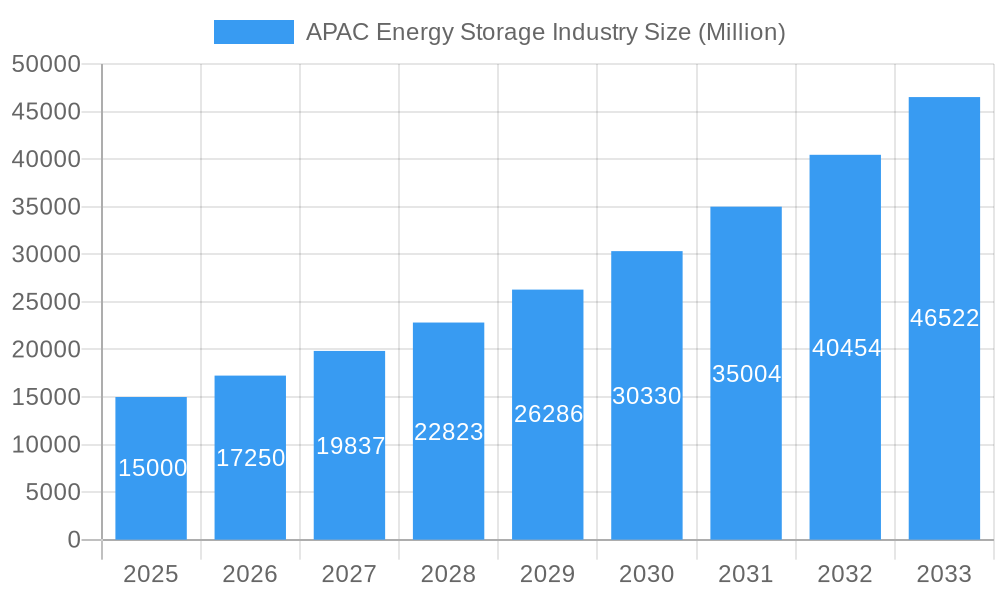
APAC Energy Storage Industry Market Size (In Billion)
However, the sector faces constraints such as high initial investment costs for energy storage systems, potential supply chain vulnerabilities related to raw materials, and concerns regarding battery safety and recycling. Despite these hurdles, the long-term outlook for the APAC energy storage market remains highly optimistic, driven by sustained governmental support, heightened environmental consciousness, and the critical need for a transition to a more sustainable and resilient energy system. The market is poised for significant expansion across various applications, including residential, commercial, and industrial sectors, alongside grid-scale deployments that facilitate renewable energy integration. Leading companies such as Samsung SDI, LG Chem, CATL, and Tesla are actively influencing the competitive environment through innovation and strategic collaborations. The diversification of energy storage technologies and the continuous development of more efficient and cost-effective solutions will further underpin the sustained growth of the industry in the coming years.
APAC Energy Storage Industry Company Market Share
APAC Energy Storage Industry: A Comprehensive Market Report (2019-2033)
This comprehensive report provides an in-depth analysis of the Asia-Pacific (APAC) energy storage industry, encompassing market dynamics, growth trends, dominant segments, and key players. With a study period spanning 2019-2033, a base year of 2025, and a forecast period of 2025-2033, this report offers invaluable insights for industry professionals, investors, and strategic decision-makers. The report analyzes parent markets (Energy Storage) and child markets (Residential, Commercial, Industrial applications; Lithium-ion, Lead-Acid, Nickel Metal Hydride battery technologies) to provide a granular view of the APAC landscape.
APAC Energy Storage Industry Market Dynamics & Structure
The APAC energy storage market is characterized by increasing market concentration, driven by technological advancements and strategic mergers & acquisitions (M&A). The market is witnessing a rapid shift towards Lithium-ion batteries, while Lead-Acid and Nickel Metal Hydride technologies are gradually losing market share. Stringent environmental regulations and government incentives are further accelerating market growth. Competitive pressures are high, with several major players vying for market dominance.
- Market Concentration: xx% market share held by top 5 players in 2024. This is expected to increase to xx% by 2033.
- Technological Innovation: Focus on improving energy density, lifespan, and safety of Lithium-ion batteries. Research into solid-state batteries is also gaining momentum.
- Regulatory Frameworks: Government policies promoting renewable energy integration and grid modernization are key growth drivers. However, inconsistent regulations across different countries pose challenges.
- M&A Trends: A significant increase in M&A activity is observed in the past 5 years, with xx deals recorded in 2024, primarily focused on acquiring smaller technology companies and expanding geographical reach.
- Competitive Product Substitutes: Pumped hydro storage and compressed air energy storage are emerging as competitive alternatives.
- End-User Demographics: A significant growth is observed in the commercial and industrial segments, driven by the increasing demand for backup power and renewable energy integration.
APAC Energy Storage Industry Growth Trends & Insights
The APAC energy storage market experienced substantial growth during the historical period (2019-2024), with a CAGR of xx%. This robust growth is primarily attributed to the increasing adoption of renewable energy sources, coupled with government initiatives to improve grid stability and enhance energy security. The market size in 2024 was estimated at xx Million units and is projected to reach xx Million units by 2033, demonstrating a significant CAGR of xx%. Technological disruptions, such as the emergence of advanced battery chemistries and improved energy management systems, are further accelerating market expansion. Shifting consumer behavior towards sustainability and energy independence is also driving demand. Market penetration rates are steadily increasing, with a projected xx% penetration rate by 2033 in key markets like China, Japan, and Australia.
Dominant Regions, Countries, or Segments in APAC Energy Storage Industry
China is the dominant region in the APAC energy storage market, accounting for xx% of the total market share in 2024. This dominance is attributed to strong government support for renewable energy, a large and growing industrial sector, and a well-established manufacturing base. Japan and Australia also show significant growth potential, driven by increasing investments in renewable energy projects and supportive government policies.
- Leading Segment: The commercial and industrial segments are leading the market growth due to increasing adoption of BESS (Battery Energy Storage System) for grid stabilization and peak shaving.
- Key Drivers:
- Government incentives and subsidies for renewable energy integration.
- Increasing demand for grid stability and reliability.
- Rising electricity prices and energy security concerns.
- Rapid industrialization and urbanization.
- Lithium-ion Batteries: Dominate the technology landscape due to higher energy density and longer lifespan compared to other technologies.
APAC Energy Storage Industry Product Landscape
The APAC energy storage market offers a diverse range of products, including various battery chemistries (Lithium-ion, Lead-acid, Nickel Metal Hydride) and system configurations (standalone, grid-tied). Recent innovations focus on improving energy density, reducing costs, and enhancing safety features. Unique selling propositions include advanced battery management systems, grid-forming capabilities, and modular designs for flexible deployment. Technological advancements such as solid-state batteries and flow batteries are poised to disrupt the market in the coming years.
Key Drivers, Barriers & Challenges in APAP Energy Storage Industry
Key Drivers:
- Increasing renewable energy capacity requiring efficient energy storage solutions.
- Government policies promoting renewable energy integration and grid modernization.
- Rising electricity prices and energy security concerns.
Key Challenges:
- High initial investment costs for energy storage systems.
- Limited awareness and understanding of energy storage technologies among consumers.
- Safety concerns related to battery storage and thermal runaway.
- Supply chain disruptions impacting raw material availability and manufacturing costs.
Emerging Opportunities in APAP Energy Storage Industry
- Growing demand for off-grid and microgrid solutions in remote areas.
- Increasing adoption of energy storage in electric vehicle (EV) charging infrastructure.
- Development of advanced battery technologies, such as solid-state batteries and flow batteries.
- Opportunities in energy arbitrage and demand-side management.
Growth Accelerators in the APAC Energy Storage Industry
Technological advancements in battery chemistry and energy management systems are key growth accelerators. Strategic partnerships between energy storage providers and renewable energy developers are further driving market expansion. Government policies promoting renewable energy integration and supporting infrastructure development play a crucial role in market growth. Expansion into untapped markets and diversification into new applications are also contributing to long-term growth.
Key Players Shaping the APAC Energy Storage Industry Market
Notable Milestones in APAC Energy Storage Industry Sector
- December 2022: Australian government announces USD 120 million funding for eight large-scale battery projects (200-300 MWh each), expected online by 2025. This signifies a strong commitment to grid stability and renewable energy integration.
- March 2022: Indonesia's PLN and IBC launch a 5MW BESS pilot project, indicating growing interest in energy storage solutions within Southeast Asia.
In-Depth APAC Energy Storage Industry Market Outlook
The APAC energy storage market is poised for continued robust growth over the forecast period (2025-2033). Technological breakthroughs, coupled with supportive government policies and increasing investments in renewable energy infrastructure, will drive market expansion. Strategic partnerships and mergers & acquisitions will further consolidate the market, leading to increased efficiency and economies of scale. The focus on improving battery technology, reducing costs, and enhancing safety will unlock new opportunities across various segments, including residential, commercial, and industrial applications. The market presents significant opportunities for both established players and new entrants alike, emphasizing innovation and strategic market positioning.
APAC Energy Storage Industry Segmentation
-
1. Technology Type
- 1.1. Lithium-ion Batteries
- 1.2. Lead-Acid Batteries
- 1.3. Nickel Metal Hydride
- 1.4. Others
-
2. Application
- 2.1. Residential
- 2.2. Commercial
- 2.3. Industrial
-
3. Geography
- 3.1. China
- 3.2. India
- 3.3. Japan
- 3.4. South Korea
- 3.5. Rest of Asia-Pacific
APAC Energy Storage Industry Segmentation By Geography
- 1. China
- 2. India
- 3. Japan
- 4. South Korea
- 5. Rest of Asia Pacific
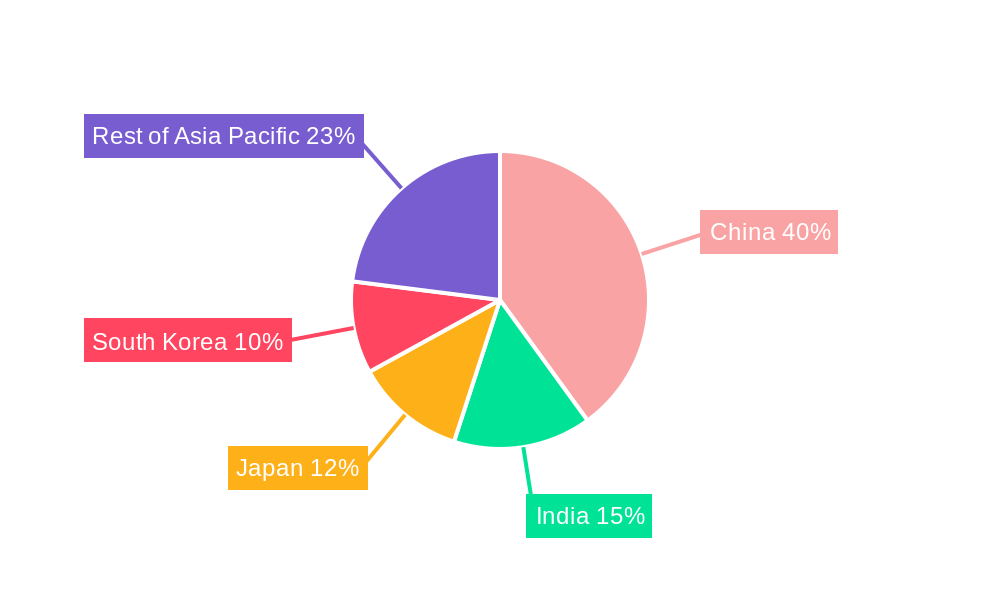
APAC Energy Storage Industry Regional Market Share
Geographic Coverage of APAC Energy Storage Industry
APAC Energy Storage Industry REPORT HIGHLIGHTS
| Aspects | Details |
|---|---|
| Study Period | 2020-2034 |
| Base Year | 2025 |
| Estimated Year | 2026 |
| Forecast Period | 2026-2034 |
| Historical Period | 2020-2025 |
| Growth Rate | CAGR of 16.9% from 2020-2034 |
| Segmentation |
|
Table of Contents
- 1. Introduction
- 1.1. Research Scope
- 1.2. Market Segmentation
- 1.3. Research Objective
- 1.4. Definitions and Assumptions
- 2. Executive Summary
- 2.1. Market Snapshot
- 3. Market Dynamics
- 3.1. Market Drivers
- 3.2. Market Restrains
- 3.3. Market Trends
- 3.4. Market Opportunities
- 4. Market Factor Analysis
- 4.1. Porters Five Forces
- 4.1.1. Bargaining Power of Suppliers
- 4.1.2. Bargaining Power of Buyers
- 4.1.3. Threat of New Entrants
- 4.1.4. Threat of Substitutes
- 4.1.5. Competitive Rivalry
- 4.2. PESTEL analysis
- 4.3. BCG Analysis
- 4.3.1. Stars (High Growth, High Market Share)
- 4.3.2. Cash Cows (Low Growth, High Market Share)
- 4.3.3. Question Mark (High Growth, Low Market Share)
- 4.3.4. Dogs (Low Growth, Low Market Share)
- 4.4. Ansoff Matrix Analysis
- 4.5. Supply Chain Analysis
- 4.6. Regulatory Landscape
- 4.7. Current Market Potential and Opportunity Assessment (TAM–SAM–SOM Framework)
- 4.8. IMR Analyst Note
- 4.1. Porters Five Forces
- 5. Market Analysis, Insights and Forecast 2021-2033
- 5.1. Market Analysis, Insights and Forecast - by Technology Type
- 5.1.1. Lithium-ion Batteries
- 5.1.2. Lead-Acid Batteries
- 5.1.3. Nickel Metal Hydride
- 5.1.4. Others
- 5.2. Market Analysis, Insights and Forecast - by Application
- 5.2.1. Residential
- 5.2.2. Commercial
- 5.2.3. Industrial
- 5.3. Market Analysis, Insights and Forecast - by Geography
- 5.3.1. China
- 5.3.2. India
- 5.3.3. Japan
- 5.3.4. South Korea
- 5.3.5. Rest of Asia-Pacific
- 5.4. Market Analysis, Insights and Forecast - by Region
- 5.4.1. China
- 5.4.2. India
- 5.4.3. Japan
- 5.4.4. South Korea
- 5.4.5. Rest of Asia Pacific
- 5.1. Market Analysis, Insights and Forecast - by Technology Type
- 6. Global APAC Energy Storage Industry Analysis, Insights and Forecast, 2021-2033
- 6.1. Market Analysis, Insights and Forecast - by Technology Type
- 6.1.1. Lithium-ion Batteries
- 6.1.2. Lead-Acid Batteries
- 6.1.3. Nickel Metal Hydride
- 6.1.4. Others
- 6.2. Market Analysis, Insights and Forecast - by Application
- 6.2.1. Residential
- 6.2.2. Commercial
- 6.2.3. Industrial
- 6.3. Market Analysis, Insights and Forecast - by Geography
- 6.3.1. China
- 6.3.2. India
- 6.3.3. Japan
- 6.3.4. South Korea
- 6.3.5. Rest of Asia-Pacific
- 6.1. Market Analysis, Insights and Forecast - by Technology Type
- 7. China APAC Energy Storage Industry Analysis, Insights and Forecast, 2020-2032
- 7.1. Market Analysis, Insights and Forecast - by Technology Type
- 7.1.1. Lithium-ion Batteries
- 7.1.2. Lead-Acid Batteries
- 7.1.3. Nickel Metal Hydride
- 7.1.4. Others
- 7.2. Market Analysis, Insights and Forecast - by Application
- 7.2.1. Residential
- 7.2.2. Commercial
- 7.2.3. Industrial
- 7.3. Market Analysis, Insights and Forecast - by Geography
- 7.3.1. China
- 7.3.2. India
- 7.3.3. Japan
- 7.3.4. South Korea
- 7.3.5. Rest of Asia-Pacific
- 7.1. Market Analysis, Insights and Forecast - by Technology Type
- 8. India APAC Energy Storage Industry Analysis, Insights and Forecast, 2020-2032
- 8.1. Market Analysis, Insights and Forecast - by Technology Type
- 8.1.1. Lithium-ion Batteries
- 8.1.2. Lead-Acid Batteries
- 8.1.3. Nickel Metal Hydride
- 8.1.4. Others
- 8.2. Market Analysis, Insights and Forecast - by Application
- 8.2.1. Residential
- 8.2.2. Commercial
- 8.2.3. Industrial
- 8.3. Market Analysis, Insights and Forecast - by Geography
- 8.3.1. China
- 8.3.2. India
- 8.3.3. Japan
- 8.3.4. South Korea
- 8.3.5. Rest of Asia-Pacific
- 8.1. Market Analysis, Insights and Forecast - by Technology Type
- 9. Japan APAC Energy Storage Industry Analysis, Insights and Forecast, 2020-2032
- 9.1. Market Analysis, Insights and Forecast - by Technology Type
- 9.1.1. Lithium-ion Batteries
- 9.1.2. Lead-Acid Batteries
- 9.1.3. Nickel Metal Hydride
- 9.1.4. Others
- 9.2. Market Analysis, Insights and Forecast - by Application
- 9.2.1. Residential
- 9.2.2. Commercial
- 9.2.3. Industrial
- 9.3. Market Analysis, Insights and Forecast - by Geography
- 9.3.1. China
- 9.3.2. India
- 9.3.3. Japan
- 9.3.4. South Korea
- 9.3.5. Rest of Asia-Pacific
- 9.1. Market Analysis, Insights and Forecast - by Technology Type
- 10. South Korea APAC Energy Storage Industry Analysis, Insights and Forecast, 2020-2032
- 10.1. Market Analysis, Insights and Forecast - by Technology Type
- 10.1.1. Lithium-ion Batteries
- 10.1.2. Lead-Acid Batteries
- 10.1.3. Nickel Metal Hydride
- 10.1.4. Others
- 10.2. Market Analysis, Insights and Forecast - by Application
- 10.2.1. Residential
- 10.2.2. Commercial
- 10.2.3. Industrial
- 10.3. Market Analysis, Insights and Forecast - by Geography
- 10.3.1. China
- 10.3.2. India
- 10.3.3. Japan
- 10.3.4. South Korea
- 10.3.5. Rest of Asia-Pacific
- 10.1. Market Analysis, Insights and Forecast - by Technology Type
- 11. Rest of Asia Pacific APAC Energy Storage Industry Analysis, Insights and Forecast, 2020-2032
- 11.1. Market Analysis, Insights and Forecast - by Technology Type
- 11.1.1. Lithium-ion Batteries
- 11.1.2. Lead-Acid Batteries
- 11.1.3. Nickel Metal Hydride
- 11.1.4. Others
- 11.2. Market Analysis, Insights and Forecast - by Application
- 11.2.1. Residential
- 11.2.2. Commercial
- 11.2.3. Industrial
- 11.3. Market Analysis, Insights and Forecast - by Geography
- 11.3.1. China
- 11.3.2. India
- 11.3.3. Japan
- 11.3.4. South Korea
- 11.3.5. Rest of Asia-Pacific
- 11.1. Market Analysis, Insights and Forecast - by Technology Type
- 12. Competitive Analysis
- 12.1. Company Profiles
- 12.1.1 Samsung SDI Co Ltd
- 12.1.1.1. Company Overview
- 12.1.1.2. Products
- 12.1.1.3. Company Financials
- 12.1.1.4. SWOT Analysis
- 12.1.2 LG Chem Ltd
- 12.1.2.1. Company Overview
- 12.1.2.2. Products
- 12.1.2.3. Company Financials
- 12.1.2.4. SWOT Analysis
- 12.1.3 Contemporary Amperex Technology Co Ltd
- 12.1.3.1. Company Overview
- 12.1.3.2. Products
- 12.1.3.3. Company Financials
- 12.1.3.4. SWOT Analysis
- 12.1.4 NEC Energy Solutions Inc
- 12.1.4.1. Company Overview
- 12.1.4.2. Products
- 12.1.4.3. Company Financials
- 12.1.4.4. SWOT Analysis
- 12.1.5 BYD Company Limited
- 12.1.5.1. Company Overview
- 12.1.5.2. Products
- 12.1.5.3. Company Financials
- 12.1.5.4. SWOT Analysis
- 12.1.6 Sunverge Energy LLC*List Not Exhaustive
- 12.1.6.1. Company Overview
- 12.1.6.2. Products
- 12.1.6.3. Company Financials
- 12.1.6.4. SWOT Analysis
- 12.1.7 Tesla Inc
- 12.1.7.1. Company Overview
- 12.1.7.2. Products
- 12.1.7.3. Company Financials
- 12.1.7.4. SWOT Analysis
- 12.1.8 Panasonic Corporation
- 12.1.8.1. Company Overview
- 12.1.8.2. Products
- 12.1.8.3. Company Financials
- 12.1.8.4. SWOT Analysis
- 12.1.1 Samsung SDI Co Ltd
- 12.2. Market Entropy
- 12.2.1 Company's Key Areas Served
- 12.2.2 Recent Developments
- 12.3. Company Market Share Analysis 2025
- 12.3.1 Top 5 Companies Market Share Analysis
- 12.3.2 Top 3 Companies Market Share Analysis
- 12.4. List of Potential Customers
- 13. Research Methodology
List of Figures
- Figure 1: Global APAC Energy Storage Industry Revenue Breakdown (billion, %) by Region 2025 & 2033
- Figure 2: China APAC Energy Storage Industry Revenue (billion), by Technology Type 2025 & 2033
- Figure 3: China APAC Energy Storage Industry Revenue Share (%), by Technology Type 2025 & 2033
- Figure 4: China APAC Energy Storage Industry Revenue (billion), by Application 2025 & 2033
- Figure 5: China APAC Energy Storage Industry Revenue Share (%), by Application 2025 & 2033
- Figure 6: China APAC Energy Storage Industry Revenue (billion), by Geography 2025 & 2033
- Figure 7: China APAC Energy Storage Industry Revenue Share (%), by Geography 2025 & 2033
- Figure 8: China APAC Energy Storage Industry Revenue (billion), by Country 2025 & 2033
- Figure 9: China APAC Energy Storage Industry Revenue Share (%), by Country 2025 & 2033
- Figure 10: India APAC Energy Storage Industry Revenue (billion), by Technology Type 2025 & 2033
- Figure 11: India APAC Energy Storage Industry Revenue Share (%), by Technology Type 2025 & 2033
- Figure 12: India APAC Energy Storage Industry Revenue (billion), by Application 2025 & 2033
- Figure 13: India APAC Energy Storage Industry Revenue Share (%), by Application 2025 & 2033
- Figure 14: India APAC Energy Storage Industry Revenue (billion), by Geography 2025 & 2033
- Figure 15: India APAC Energy Storage Industry Revenue Share (%), by Geography 2025 & 2033
- Figure 16: India APAC Energy Storage Industry Revenue (billion), by Country 2025 & 2033
- Figure 17: India APAC Energy Storage Industry Revenue Share (%), by Country 2025 & 2033
- Figure 18: Japan APAC Energy Storage Industry Revenue (billion), by Technology Type 2025 & 2033
- Figure 19: Japan APAC Energy Storage Industry Revenue Share (%), by Technology Type 2025 & 2033
- Figure 20: Japan APAC Energy Storage Industry Revenue (billion), by Application 2025 & 2033
- Figure 21: Japan APAC Energy Storage Industry Revenue Share (%), by Application 2025 & 2033
- Figure 22: Japan APAC Energy Storage Industry Revenue (billion), by Geography 2025 & 2033
- Figure 23: Japan APAC Energy Storage Industry Revenue Share (%), by Geography 2025 & 2033
- Figure 24: Japan APAC Energy Storage Industry Revenue (billion), by Country 2025 & 2033
- Figure 25: Japan APAC Energy Storage Industry Revenue Share (%), by Country 2025 & 2033
- Figure 26: South Korea APAC Energy Storage Industry Revenue (billion), by Technology Type 2025 & 2033
- Figure 27: South Korea APAC Energy Storage Industry Revenue Share (%), by Technology Type 2025 & 2033
- Figure 28: South Korea APAC Energy Storage Industry Revenue (billion), by Application 2025 & 2033
- Figure 29: South Korea APAC Energy Storage Industry Revenue Share (%), by Application 2025 & 2033
- Figure 30: South Korea APAC Energy Storage Industry Revenue (billion), by Geography 2025 & 2033
- Figure 31: South Korea APAC Energy Storage Industry Revenue Share (%), by Geography 2025 & 2033
- Figure 32: South Korea APAC Energy Storage Industry Revenue (billion), by Country 2025 & 2033
- Figure 33: South Korea APAC Energy Storage Industry Revenue Share (%), by Country 2025 & 2033
- Figure 34: Rest of Asia Pacific APAC Energy Storage Industry Revenue (billion), by Technology Type 2025 & 2033
- Figure 35: Rest of Asia Pacific APAC Energy Storage Industry Revenue Share (%), by Technology Type 2025 & 2033
- Figure 36: Rest of Asia Pacific APAC Energy Storage Industry Revenue (billion), by Application 2025 & 2033
- Figure 37: Rest of Asia Pacific APAC Energy Storage Industry Revenue Share (%), by Application 2025 & 2033
- Figure 38: Rest of Asia Pacific APAC Energy Storage Industry Revenue (billion), by Geography 2025 & 2033
- Figure 39: Rest of Asia Pacific APAC Energy Storage Industry Revenue Share (%), by Geography 2025 & 2033
- Figure 40: Rest of Asia Pacific APAC Energy Storage Industry Revenue (billion), by Country 2025 & 2033
- Figure 41: Rest of Asia Pacific APAC Energy Storage Industry Revenue Share (%), by Country 2025 & 2033
List of Tables
- Table 1: Global APAC Energy Storage Industry Revenue billion Forecast, by Technology Type 2020 & 2033
- Table 2: Global APAC Energy Storage Industry Revenue billion Forecast, by Application 2020 & 2033
- Table 3: Global APAC Energy Storage Industry Revenue billion Forecast, by Geography 2020 & 2033
- Table 4: Global APAC Energy Storage Industry Revenue billion Forecast, by Region 2020 & 2033
- Table 5: Global APAC Energy Storage Industry Revenue billion Forecast, by Technology Type 2020 & 2033
- Table 6: Global APAC Energy Storage Industry Revenue billion Forecast, by Application 2020 & 2033
- Table 7: Global APAC Energy Storage Industry Revenue billion Forecast, by Geography 2020 & 2033
- Table 8: Global APAC Energy Storage Industry Revenue billion Forecast, by Country 2020 & 2033
- Table 9: Global APAC Energy Storage Industry Revenue billion Forecast, by Technology Type 2020 & 2033
- Table 10: Global APAC Energy Storage Industry Revenue billion Forecast, by Application 2020 & 2033
- Table 11: Global APAC Energy Storage Industry Revenue billion Forecast, by Geography 2020 & 2033
- Table 12: Global APAC Energy Storage Industry Revenue billion Forecast, by Country 2020 & 2033
- Table 13: Global APAC Energy Storage Industry Revenue billion Forecast, by Technology Type 2020 & 2033
- Table 14: Global APAC Energy Storage Industry Revenue billion Forecast, by Application 2020 & 2033
- Table 15: Global APAC Energy Storage Industry Revenue billion Forecast, by Geography 2020 & 2033
- Table 16: Global APAC Energy Storage Industry Revenue billion Forecast, by Country 2020 & 2033
- Table 17: Global APAC Energy Storage Industry Revenue billion Forecast, by Technology Type 2020 & 2033
- Table 18: Global APAC Energy Storage Industry Revenue billion Forecast, by Application 2020 & 2033
- Table 19: Global APAC Energy Storage Industry Revenue billion Forecast, by Geography 2020 & 2033
- Table 20: Global APAC Energy Storage Industry Revenue billion Forecast, by Country 2020 & 2033
- Table 21: Global APAC Energy Storage Industry Revenue billion Forecast, by Technology Type 2020 & 2033
- Table 22: Global APAC Energy Storage Industry Revenue billion Forecast, by Application 2020 & 2033
- Table 23: Global APAC Energy Storage Industry Revenue billion Forecast, by Geography 2020 & 2033
- Table 24: Global APAC Energy Storage Industry Revenue billion Forecast, by Country 2020 & 2033
Frequently Asked Questions
1. What is the projected Compound Annual Growth Rate (CAGR) of the APAC Energy Storage Industry?
The projected CAGR is approximately 16.9%.
2. Which companies are prominent players in the APAC Energy Storage Industry?
Key companies in the market include Samsung SDI Co Ltd, LG Chem Ltd, Contemporary Amperex Technology Co Ltd, NEC Energy Solutions Inc, BYD Company Limited, Sunverge Energy LLC*List Not Exhaustive, Tesla Inc, Panasonic Corporation.
3. What are the main segments of the APAC Energy Storage Industry?
The market segments include Technology Type, Application, Geography.
4. Can you provide details about the market size?
The market size is estimated to be USD 28.61 billion as of 2022.
5. What are some drivers contributing to market growth?
4.; Declining Lithium-ion Battery Prices4.; Rapid Adoption of Electric Vehicles.
6. What are the notable trends driving market growth?
Commercial Sector to Witness Significant Growth.
7. Are there any restraints impacting market growth?
4.; The Demand-Supply Mismatch of Raw Materials.
8. Can you provide examples of recent developments in the market?
In December 2022, the Australian government announced that eight large batteries to store renewable energy would be built around Australia to support the grid and help keep energy prices down. Nearly USD 120 million in funding for the projects will be provided by the government-owned Australian Renewable Energy Agency (Arena). The batteries will be located in Gnarwarre, Moorabool, and Mortlake in Victoria, Mount Fox and Western Downs in Queensland, Liddell in New South Wales, and Bungama and Blyth in South Australia. These batteries will range from 200-300 MWh each, have grid-forming inverter technology and are expected to come online by 2025.
9. What pricing options are available for accessing the report?
Pricing options include single-user, multi-user, and enterprise licenses priced at USD 4750, USD 5250, and USD 8750 respectively.
10. Is the market size provided in terms of value or volume?
The market size is provided in terms of value, measured in billion.
11. Are there any specific market keywords associated with the report?
Yes, the market keyword associated with the report is "APAC Energy Storage Industry," which aids in identifying and referencing the specific market segment covered.
12. How do I determine which pricing option suits my needs best?
The pricing options vary based on user requirements and access needs. Individual users may opt for single-user licenses, while businesses requiring broader access may choose multi-user or enterprise licenses for cost-effective access to the report.
13. Are there any additional resources or data provided in the APAC Energy Storage Industry report?
While the report offers comprehensive insights, it's advisable to review the specific contents or supplementary materials provided to ascertain if additional resources or data are available.
14. How can I stay updated on further developments or reports in the APAC Energy Storage Industry?
To stay informed about further developments, trends, and reports in the APAC Energy Storage Industry, consider subscribing to industry newsletters, following relevant companies and organizations, or regularly checking reputable industry news sources and publications.
Methodology
Step 1 - Identification of Relevant Samples Size from Population Database


Step 2 - Approaches for Defining Global Market Size (Value, Volume* & Price*)

Note*: In applicable scenarios
Step 3 - Data Sources
Primary Research
- Web Analytics
- Survey Reports
- Research Institute
- Latest Research Reports
- Opinion Leaders
Secondary Research
- Annual Reports
- White Paper
- Latest Press Release
- Industry Association
- Paid Database
- Investor Presentations

Step 4 - Data Triangulation
Involves using different sources of information in order to increase the validity of a study
These sources are likely to be stakeholders in a program - participants, other researchers, program staff, other community members, and so on.
Then we put all data in single framework & apply various statistical tools to find out the dynamic on the market.
During the analysis stage, feedback from the stakeholder groups would be compared to determine areas of agreement as well as areas of divergence