

Key Insights
The Asia-Pacific (APAC) nuclear power reactor decommissioning market is poised for substantial growth, driven by an aging fleet of nuclear power plants, particularly in Japan and South Korea, and increasingly stringent regulatory mandates for safe and efficient dismantling. The market is projected to reach $8.01 billion by 2025, expanding at a Compound Annual Growth Rate (CAGR) of 3.59% from the base year 2025. This expansion is further propelled by a significant pipeline of reactors approaching their operational end-of-life by 2033. The region's diverse reactor types, including Pressurized Water Reactors (PWRs) and Boiling Water Reactors (BWRs), alongside varying reactor capacities (below 100 MW, 100-1000 MW, and above 1000 MW), present unique decommissioning challenges and opportunities. Leading industry players such as Toshiba, Korea Hydro & Nuclear Power, and Orano are actively engaged, underscoring significant investment and technological advancements. While high costs, technical complexities, and the demand for skilled labor and specialized equipment remain key challenges, supportive government regulations are fostering industry development.
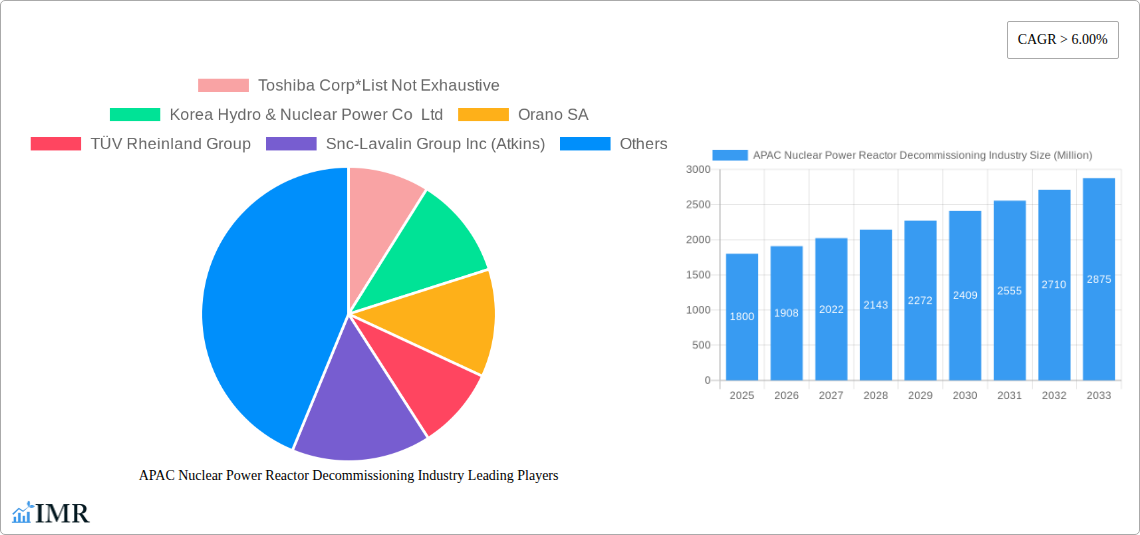
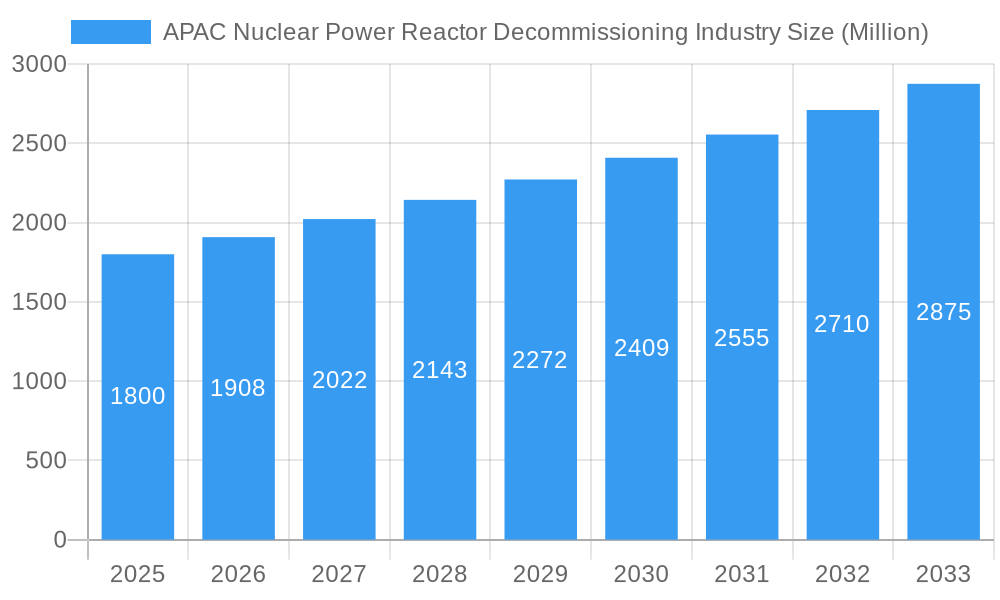
APAC Nuclear Power Reactor Decommissioning Industry Market Size (In Billion)
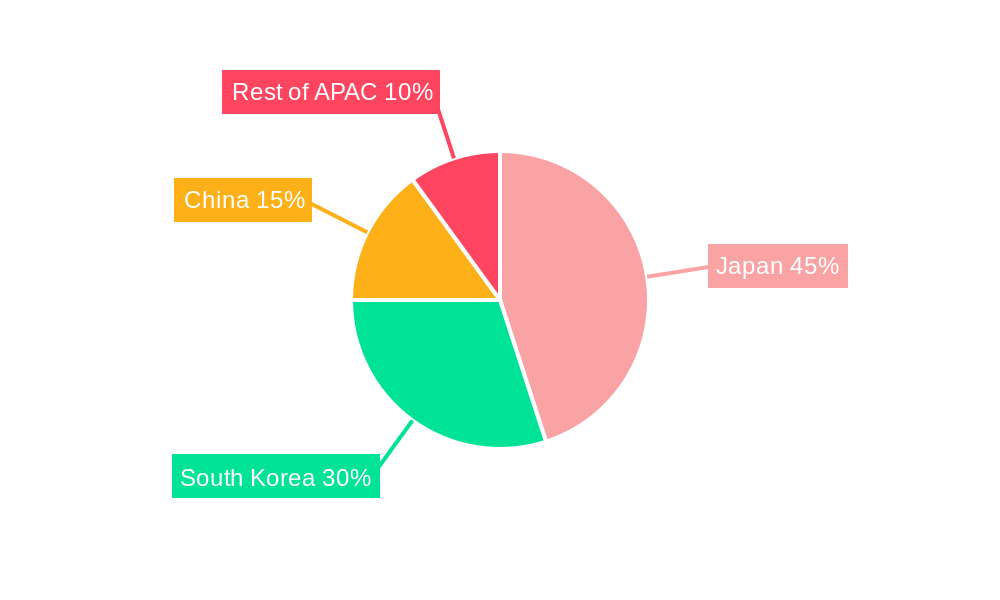
Japan and South Korea currently lead the APAC decommissioning landscape due to their extensive inventory of aging reactors. China, despite being in the early stages of its decommissioning journey, is expected to become a significant contributor to the regional market in the future. Other APAC nations also present emerging opportunities as their nuclear power plants age. Key market trends include the adoption of advanced dismantling technologies, an increased emphasis on environmental stewardship and radioactive waste management, and enhanced collaboration among governments, utilities, and private sector entities to optimize efficiency and reduce costs.
APAC Nuclear Power Reactor Decommissioning Industry Company Market Share
This report offers a comprehensive analysis of the APAC nuclear power reactor decommissioning market from 2019 to 2033, providing critical insights for industry stakeholders, investors, and policymakers. The study details market dynamics, growth trajectories, key participants, and future prospects, employing a robust methodology that integrates quantitative and qualitative data for a holistic market perspective. Market values are presented in billions.
APAC Nuclear Power Reactor Decommissioning Industry Market Dynamics & Structure
The APAC nuclear power reactor decommissioning market is characterized by a moderately concentrated landscape, with several multinational corporations and regional players vying for market share. Technological innovation is a key driver, particularly in areas such as robotics, remote handling, and waste management. Stringent regulatory frameworks, varying across different APAC nations, significantly impact operations and investment decisions. The industry faces pressure from competitive product substitutes, primarily focusing on alternative energy sources. End-user demographics largely consist of government agencies, nuclear power plant operators, and specialized decommissioning contractors. M&A activity has been moderate, driven by the need for specialized expertise and financial resources to manage complex decommissioning projects.
- Market Concentration: Moderately concentrated, with top 5 players holding xx% market share in 2025.
- Technological Innovation: Robotics, AI, and advanced waste management techniques are driving growth.
- Regulatory Frameworks: Stringent regulations vary across countries, impacting project timelines and costs.
- Competitive Substitutes: Renewable energy sources pose a competitive threat.
- M&A Activity: xx deals recorded between 2019-2024, with an average deal value of xx million.
- Innovation Barriers: High upfront capital investment, complex regulatory approvals, and skilled labor shortages.
APAC Nuclear Power Reactor Decommissioning Industry Growth Trends & Insights
The APAC nuclear power reactor decommissioning market experienced significant growth between 2019 and 2024, driven primarily by the aging nuclear fleet and increasing regulatory pressure for decommissioning. The market size reached xx million in 2024 and is projected to reach xx million by 2033, exhibiting a CAGR of xx% during the forecast period (2025-2033). Technological advancements, such as the adoption of advanced robotics and AI-powered systems, are further accelerating market growth. Consumer behavior shifts, driven by rising environmental concerns and stricter regulations, are also influencing market dynamics. Adoption rates for advanced decommissioning technologies are expected to increase steadily over the forecast period. The Fukushima Daiichi accident significantly impacted the market, creating a large-scale decommissioning project, which will influence market growth for many years to come. However, challenges such as high decommissioning costs and skilled labor shortages continue to pose significant barriers to market growth.
Dominant Regions, Countries, or Segments in APAC Nuclear Power Reactor Decommissioning Industry
Japan dominates the APAC nuclear power reactor decommissioning market, driven by the significant number of aging reactors and the ongoing decommissioning efforts at Fukushima Daiichi. China is another key market, with its growing nuclear power capacity and increased focus on reactor decommissioning. The "Rest of Asia-Pacific" segment demonstrates steady growth, driven by the increasing age of nuclear plants and rising environmental awareness. Within reactor types, Pressurized Water Reactors (PWRs) and Boiling Water Reactors (BWRs) currently hold the largest market share, reflecting their prevalence in the region. Commercial power reactor decommissioning dominates the application segment due to the large number of commercial reactors nearing the end of their operational lifespan. The 100-1000 MW capacity segment holds the largest market share.
- Key Drivers: Aging nuclear infrastructure, stringent environmental regulations, government initiatives and funding, and technological advancements.
- Japan: Largest market share driven by Fukushima Daiichi and other aging reactors.
- China: Growing nuclear capacity leads to increasing decommissioning needs.
- Reactor Type: PWR and BWR segments dominate due to their high prevalence.
- Application: Commercial power reactor decommissioning is the largest segment.
- Capacity: 100-1000 MW capacity segment holds the largest market share.
APAC Nuclear Power Reactor Decommissioning Industry Product Landscape
The APAC nuclear power reactor decommissioning industry offers a diverse range of products and services, including specialized equipment for dismantling, waste handling and treatment, and site remediation. Innovative technologies such as robotic systems for remote handling, advanced decontamination techniques, and efficient waste disposal solutions are gaining traction. These advancements offer improved safety, reduced operational costs, and faster decommissioning timelines. Companies are increasingly focusing on developing integrated solutions that address the entire decommissioning lifecycle, from planning to site restoration. Unique selling propositions (USPs) frequently include enhanced safety features, faster processing times, and reduced environmental impact.
Key Drivers, Barriers & Challenges in APAP Nuclear Power Reactor Decommissioning Industry
Key Drivers: Aging nuclear infrastructure, stricter environmental regulations, government policies promoting decommissioning, and technological advancements in decommissioning technologies are key drivers. The Fukushima accident significantly accelerated the market due to the extensive decommissioning required.
Challenges and Restraints: High decommissioning costs, complex regulatory hurdles, skilled labor shortages, and potential supply chain disruptions pose significant challenges. The long-term nature of decommissioning projects introduces financial uncertainties and complicates risk assessment. Competition from emerging alternative energy sources presents an indirect challenge. The impact of these challenges is quantified through extended project timelines and higher overall costs.
Emerging Opportunities in APAC Nuclear Power Reactor Decommissioning Industry
Emerging opportunities include the development of innovative decommissioning technologies, the expansion of services into new markets within the APAC region, and the creation of specialized training programs to address the skilled labor shortage. Untapped markets in smaller APAC countries with aging nuclear plants represent significant growth potential. The increasing adoption of sustainable practices within the industry presents opportunities for environmentally friendly solutions.
Growth Accelerators in the APAC Nuclear Power Reactor Decommissioning Industry
Long-term growth will be fueled by technological breakthroughs in robotics, AI, and waste management, leading to reduced costs and improved safety. Strategic partnerships between international and local companies will enhance expertise and market reach. Government policies supporting the adoption of advanced decommissioning technologies and the development of a skilled workforce are crucial. Market expansion into Southeast Asia and other emerging markets will further drive growth.
Key Players Shaping the APAC Nuclear Power Reactor Decommissioning Industry Market
- Toshiba Corp
- Korea Hydro & Nuclear Power Co Ltd
- Orano SA
- TÜV Rheinland Group
- Snc-Lavalin Group Inc (Atkins)
- The Japan Atomic Power Co
- GE- Hitachi Nuclear Energy Ltd
- Tokyo Electric Power Company Holdings Inc
Notable Milestones in APAC Nuclear Power Reactor Decommissioning Industry Sector
- January 2022: The Japanese government announced plans to release treated wastewater from the Fukushima Daiichi nuclear power plant, highlighting the scale and complexity of the decommissioning process.
- May 2022: Jacobs Engineering Group was selected to support Tepco's decommissioning efforts at Fukushima, showcasing the importance of specialized expertise in large-scale projects.
In-Depth APAC Nuclear Power Reactor Decommissioning Industry Market Outlook
The APAC nuclear power reactor decommissioning market is poised for sustained growth over the next decade. Continued advancements in technology, coupled with supportive government policies and increasing regulatory pressures, will drive demand. Strategic partnerships and investments in research and development will further propel market expansion. The sector presents lucrative opportunities for companies specializing in decommissioning technologies and services. The successful management of large-scale projects like Fukushima Daiichi will establish industry best practices and further stimulate market growth.
APAC Nuclear Power Reactor Decommissioning Industry Segmentation
-
1. Reactor Type
- 1.1. Pressurized Water Reactor
- 1.2. Pressurized Heavy Water Reactor
- 1.3. Boiling Water Reactor
- 1.4. High-temperature Gas-cooled Reactor
- 1.5. Liquid Metal Fast Breeder Reactor
- 1.6. Other Reactor Types
-
2. Application
- 2.1. Commercial Power Reactor
- 2.2. Prototype Power Reactor
- 2.3. Research Reactor
-
3. Capacity
- 3.1. Below 100 MW
- 3.2. 100-1000 MW
- 3.3. Above 1000 MW
APAC Nuclear Power Reactor Decommissioning Industry Segmentation By Geography
-
1. North America
- 1.1. United States
- 1.2. Canada
- 1.3. Mexico
-
2. South America
- 2.1. Brazil
- 2.2. Argentina
- 2.3. Rest of South America
-
3. Europe
- 3.1. United Kingdom
- 3.2. Germany
- 3.3. France
- 3.4. Italy
- 3.5. Spain
- 3.6. Russia
- 3.7. Benelux
- 3.8. Nordics
- 3.9. Rest of Europe
-
4. Middle East & Africa
- 4.1. Turkey
- 4.2. Israel
- 4.3. GCC
- 4.4. North Africa
- 4.5. South Africa
- 4.6. Rest of Middle East & Africa
-
5. Asia Pacific
- 5.1. China
- 5.2. India
- 5.3. Japan
- 5.4. South Korea
- 5.5. ASEAN
- 5.6. Oceania
- 5.7. Rest of Asia Pacific
APAC Nuclear Power Reactor Decommissioning Industry Regional Market Share
Geographic Coverage of APAC Nuclear Power Reactor Decommissioning Industry
APAC Nuclear Power Reactor Decommissioning Industry REPORT HIGHLIGHTS
| Aspects | Details |
|---|---|
| Study Period | 2020-2034 |
| Base Year | 2025 |
| Estimated Year | 2026 |
| Forecast Period | 2026-2034 |
| Historical Period | 2020-2025 |
| Growth Rate | CAGR of 3.59% from 2020-2034 |
| Segmentation |
|
Table of Contents
- 1. Introduction
- 1.1. Research Scope
- 1.2. Market Segmentation
- 1.3. Research Objective
- 1.4. Definitions and Assumptions
- 2. Executive Summary
- 2.1. Market Snapshot
- 3. Market Dynamics
- 3.1. Market Drivers
- 3.2. Market Restrains
- 3.3. Market Trends
- 3.4. Market Opportunities
- 4. Market Factor Analysis
- 4.1. Porters Five Forces
- 4.1.1. Bargaining Power of Suppliers
- 4.1.2. Bargaining Power of Buyers
- 4.1.3. Threat of New Entrants
- 4.1.4. Threat of Substitutes
- 4.1.5. Competitive Rivalry
- 4.2. PESTEL analysis
- 4.3. BCG Analysis
- 4.3.1. Stars (High Growth, High Market Share)
- 4.3.2. Cash Cows (Low Growth, High Market Share)
- 4.3.3. Question Mark (High Growth, Low Market Share)
- 4.3.4. Dogs (Low Growth, Low Market Share)
- 4.4. Ansoff Matrix Analysis
- 4.5. Supply Chain Analysis
- 4.6. Regulatory Landscape
- 4.7. Current Market Potential and Opportunity Assessment (TAM–SAM–SOM Framework)
- 4.8. IMR Analyst Note
- 4.1. Porters Five Forces
- 5. Market Analysis, Insights and Forecast 2021-2033
- 5.1. Market Analysis, Insights and Forecast - by Reactor Type
- 5.1.1. Pressurized Water Reactor
- 5.1.2. Pressurized Heavy Water Reactor
- 5.1.3. Boiling Water Reactor
- 5.1.4. High-temperature Gas-cooled Reactor
- 5.1.5. Liquid Metal Fast Breeder Reactor
- 5.1.6. Other Reactor Types
- 5.2. Market Analysis, Insights and Forecast - by Application
- 5.2.1. Commercial Power Reactor
- 5.2.2. Prototype Power Reactor
- 5.2.3. Research Reactor
- 5.3. Market Analysis, Insights and Forecast - by Capacity
- 5.3.1. Below 100 MW
- 5.3.2. 100-1000 MW
- 5.3.3. Above 1000 MW
- 5.4. Market Analysis, Insights and Forecast - by Region
- 5.4.1. North America
- 5.4.2. South America
- 5.4.3. Europe
- 5.4.4. Middle East & Africa
- 5.4.5. Asia Pacific
- 5.1. Market Analysis, Insights and Forecast - by Reactor Type
- 6. Global APAC Nuclear Power Reactor Decommissioning Industry Analysis, Insights and Forecast, 2021-2033
- 6.1. Market Analysis, Insights and Forecast - by Reactor Type
- 6.1.1. Pressurized Water Reactor
- 6.1.2. Pressurized Heavy Water Reactor
- 6.1.3. Boiling Water Reactor
- 6.1.4. High-temperature Gas-cooled Reactor
- 6.1.5. Liquid Metal Fast Breeder Reactor
- 6.1.6. Other Reactor Types
- 6.2. Market Analysis, Insights and Forecast - by Application
- 6.2.1. Commercial Power Reactor
- 6.2.2. Prototype Power Reactor
- 6.2.3. Research Reactor
- 6.3. Market Analysis, Insights and Forecast - by Capacity
- 6.3.1. Below 100 MW
- 6.3.2. 100-1000 MW
- 6.3.3. Above 1000 MW
- 6.1. Market Analysis, Insights and Forecast - by Reactor Type
- 7. North America APAC Nuclear Power Reactor Decommissioning Industry Analysis, Insights and Forecast, 2020-2032
- 7.1. Market Analysis, Insights and Forecast - by Reactor Type
- 7.1.1. Pressurized Water Reactor
- 7.1.2. Pressurized Heavy Water Reactor
- 7.1.3. Boiling Water Reactor
- 7.1.4. High-temperature Gas-cooled Reactor
- 7.1.5. Liquid Metal Fast Breeder Reactor
- 7.1.6. Other Reactor Types
- 7.2. Market Analysis, Insights and Forecast - by Application
- 7.2.1. Commercial Power Reactor
- 7.2.2. Prototype Power Reactor
- 7.2.3. Research Reactor
- 7.3. Market Analysis, Insights and Forecast - by Capacity
- 7.3.1. Below 100 MW
- 7.3.2. 100-1000 MW
- 7.3.3. Above 1000 MW
- 7.1. Market Analysis, Insights and Forecast - by Reactor Type
- 8. South America APAC Nuclear Power Reactor Decommissioning Industry Analysis, Insights and Forecast, 2020-2032
- 8.1. Market Analysis, Insights and Forecast - by Reactor Type
- 8.1.1. Pressurized Water Reactor
- 8.1.2. Pressurized Heavy Water Reactor
- 8.1.3. Boiling Water Reactor
- 8.1.4. High-temperature Gas-cooled Reactor
- 8.1.5. Liquid Metal Fast Breeder Reactor
- 8.1.6. Other Reactor Types
- 8.2. Market Analysis, Insights and Forecast - by Application
- 8.2.1. Commercial Power Reactor
- 8.2.2. Prototype Power Reactor
- 8.2.3. Research Reactor
- 8.3. Market Analysis, Insights and Forecast - by Capacity
- 8.3.1. Below 100 MW
- 8.3.2. 100-1000 MW
- 8.3.3. Above 1000 MW
- 8.1. Market Analysis, Insights and Forecast - by Reactor Type
- 9. Europe APAC Nuclear Power Reactor Decommissioning Industry Analysis, Insights and Forecast, 2020-2032
- 9.1. Market Analysis, Insights and Forecast - by Reactor Type
- 9.1.1. Pressurized Water Reactor
- 9.1.2. Pressurized Heavy Water Reactor
- 9.1.3. Boiling Water Reactor
- 9.1.4. High-temperature Gas-cooled Reactor
- 9.1.5. Liquid Metal Fast Breeder Reactor
- 9.1.6. Other Reactor Types
- 9.2. Market Analysis, Insights and Forecast - by Application
- 9.2.1. Commercial Power Reactor
- 9.2.2. Prototype Power Reactor
- 9.2.3. Research Reactor
- 9.3. Market Analysis, Insights and Forecast - by Capacity
- 9.3.1. Below 100 MW
- 9.3.2. 100-1000 MW
- 9.3.3. Above 1000 MW
- 9.1. Market Analysis, Insights and Forecast - by Reactor Type
- 10. Middle East & Africa APAC Nuclear Power Reactor Decommissioning Industry Analysis, Insights and Forecast, 2020-2032
- 10.1. Market Analysis, Insights and Forecast - by Reactor Type
- 10.1.1. Pressurized Water Reactor
- 10.1.2. Pressurized Heavy Water Reactor
- 10.1.3. Boiling Water Reactor
- 10.1.4. High-temperature Gas-cooled Reactor
- 10.1.5. Liquid Metal Fast Breeder Reactor
- 10.1.6. Other Reactor Types
- 10.2. Market Analysis, Insights and Forecast - by Application
- 10.2.1. Commercial Power Reactor
- 10.2.2. Prototype Power Reactor
- 10.2.3. Research Reactor
- 10.3. Market Analysis, Insights and Forecast - by Capacity
- 10.3.1. Below 100 MW
- 10.3.2. 100-1000 MW
- 10.3.3. Above 1000 MW
- 10.1. Market Analysis, Insights and Forecast - by Reactor Type
- 11. Asia Pacific APAC Nuclear Power Reactor Decommissioning Industry Analysis, Insights and Forecast, 2020-2032
- 11.1. Market Analysis, Insights and Forecast - by Reactor Type
- 11.1.1. Pressurized Water Reactor
- 11.1.2. Pressurized Heavy Water Reactor
- 11.1.3. Boiling Water Reactor
- 11.1.4. High-temperature Gas-cooled Reactor
- 11.1.5. Liquid Metal Fast Breeder Reactor
- 11.1.6. Other Reactor Types
- 11.2. Market Analysis, Insights and Forecast - by Application
- 11.2.1. Commercial Power Reactor
- 11.2.2. Prototype Power Reactor
- 11.2.3. Research Reactor
- 11.3. Market Analysis, Insights and Forecast - by Capacity
- 11.3.1. Below 100 MW
- 11.3.2. 100-1000 MW
- 11.3.3. Above 1000 MW
- 11.1. Market Analysis, Insights and Forecast - by Reactor Type
- 12. Competitive Analysis
- 12.1. Company Profiles
- 12.1.1 Toshiba Corp*List Not Exhaustive
- 12.1.1.1. Company Overview
- 12.1.1.2. Products
- 12.1.1.3. Company Financials
- 12.1.1.4. SWOT Analysis
- 12.1.2 Korea Hydro & Nuclear Power Co Ltd
- 12.1.2.1. Company Overview
- 12.1.2.2. Products
- 12.1.2.3. Company Financials
- 12.1.2.4. SWOT Analysis
- 12.1.3 Orano SA
- 12.1.3.1. Company Overview
- 12.1.3.2. Products
- 12.1.3.3. Company Financials
- 12.1.3.4. SWOT Analysis
- 12.1.4 TÜV Rheinland Group
- 12.1.4.1. Company Overview
- 12.1.4.2. Products
- 12.1.4.3. Company Financials
- 12.1.4.4. SWOT Analysis
- 12.1.5 Snc-Lavalin Group Inc (Atkins)
- 12.1.5.1. Company Overview
- 12.1.5.2. Products
- 12.1.5.3. Company Financials
- 12.1.5.4. SWOT Analysis
- 12.1.6 The Japan Atomic Power Co
- 12.1.6.1. Company Overview
- 12.1.6.2. Products
- 12.1.6.3. Company Financials
- 12.1.6.4. SWOT Analysis
- 12.1.7 GE- Hitachi Nuclear Energy Ltd
- 12.1.7.1. Company Overview
- 12.1.7.2. Products
- 12.1.7.3. Company Financials
- 12.1.7.4. SWOT Analysis
- 12.1.8 Tokyo Electric Power Company Holdings Inc
- 12.1.8.1. Company Overview
- 12.1.8.2. Products
- 12.1.8.3. Company Financials
- 12.1.8.4. SWOT Analysis
- 12.1.1 Toshiba Corp*List Not Exhaustive
- 12.2. Market Entropy
- 12.2.1 Company's Key Areas Served
- 12.2.2 Recent Developments
- 12.3. Company Market Share Analysis 2025
- 12.3.1 Top 5 Companies Market Share Analysis
- 12.3.2 Top 3 Companies Market Share Analysis
- 12.4. List of Potential Customers
- 13. Research Methodology
List of Figures
- Figure 1: Global APAC Nuclear Power Reactor Decommissioning Industry Revenue Breakdown (billion, %) by Region 2025 & 2033
- Figure 2: North America APAC Nuclear Power Reactor Decommissioning Industry Revenue (billion), by Reactor Type 2025 & 2033
- Figure 3: North America APAC Nuclear Power Reactor Decommissioning Industry Revenue Share (%), by Reactor Type 2025 & 2033
- Figure 4: North America APAC Nuclear Power Reactor Decommissioning Industry Revenue (billion), by Application 2025 & 2033
- Figure 5: North America APAC Nuclear Power Reactor Decommissioning Industry Revenue Share (%), by Application 2025 & 2033
- Figure 6: North America APAC Nuclear Power Reactor Decommissioning Industry Revenue (billion), by Capacity 2025 & 2033
- Figure 7: North America APAC Nuclear Power Reactor Decommissioning Industry Revenue Share (%), by Capacity 2025 & 2033
- Figure 8: North America APAC Nuclear Power Reactor Decommissioning Industry Revenue (billion), by Country 2025 & 2033
- Figure 9: North America APAC Nuclear Power Reactor Decommissioning Industry Revenue Share (%), by Country 2025 & 2033
- Figure 10: South America APAC Nuclear Power Reactor Decommissioning Industry Revenue (billion), by Reactor Type 2025 & 2033
- Figure 11: South America APAC Nuclear Power Reactor Decommissioning Industry Revenue Share (%), by Reactor Type 2025 & 2033
- Figure 12: South America APAC Nuclear Power Reactor Decommissioning Industry Revenue (billion), by Application 2025 & 2033
- Figure 13: South America APAC Nuclear Power Reactor Decommissioning Industry Revenue Share (%), by Application 2025 & 2033
- Figure 14: South America APAC Nuclear Power Reactor Decommissioning Industry Revenue (billion), by Capacity 2025 & 2033
- Figure 15: South America APAC Nuclear Power Reactor Decommissioning Industry Revenue Share (%), by Capacity 2025 & 2033
- Figure 16: South America APAC Nuclear Power Reactor Decommissioning Industry Revenue (billion), by Country 2025 & 2033
- Figure 17: South America APAC Nuclear Power Reactor Decommissioning Industry Revenue Share (%), by Country 2025 & 2033
- Figure 18: Europe APAC Nuclear Power Reactor Decommissioning Industry Revenue (billion), by Reactor Type 2025 & 2033
- Figure 19: Europe APAC Nuclear Power Reactor Decommissioning Industry Revenue Share (%), by Reactor Type 2025 & 2033
- Figure 20: Europe APAC Nuclear Power Reactor Decommissioning Industry Revenue (billion), by Application 2025 & 2033
- Figure 21: Europe APAC Nuclear Power Reactor Decommissioning Industry Revenue Share (%), by Application 2025 & 2033
- Figure 22: Europe APAC Nuclear Power Reactor Decommissioning Industry Revenue (billion), by Capacity 2025 & 2033
- Figure 23: Europe APAC Nuclear Power Reactor Decommissioning Industry Revenue Share (%), by Capacity 2025 & 2033
- Figure 24: Europe APAC Nuclear Power Reactor Decommissioning Industry Revenue (billion), by Country 2025 & 2033
- Figure 25: Europe APAC Nuclear Power Reactor Decommissioning Industry Revenue Share (%), by Country 2025 & 2033
- Figure 26: Middle East & Africa APAC Nuclear Power Reactor Decommissioning Industry Revenue (billion), by Reactor Type 2025 & 2033
- Figure 27: Middle East & Africa APAC Nuclear Power Reactor Decommissioning Industry Revenue Share (%), by Reactor Type 2025 & 2033
- Figure 28: Middle East & Africa APAC Nuclear Power Reactor Decommissioning Industry Revenue (billion), by Application 2025 & 2033
- Figure 29: Middle East & Africa APAC Nuclear Power Reactor Decommissioning Industry Revenue Share (%), by Application 2025 & 2033
- Figure 30: Middle East & Africa APAC Nuclear Power Reactor Decommissioning Industry Revenue (billion), by Capacity 2025 & 2033
- Figure 31: Middle East & Africa APAC Nuclear Power Reactor Decommissioning Industry Revenue Share (%), by Capacity 2025 & 2033
- Figure 32: Middle East & Africa APAC Nuclear Power Reactor Decommissioning Industry Revenue (billion), by Country 2025 & 2033
- Figure 33: Middle East & Africa APAC Nuclear Power Reactor Decommissioning Industry Revenue Share (%), by Country 2025 & 2033
- Figure 34: Asia Pacific APAC Nuclear Power Reactor Decommissioning Industry Revenue (billion), by Reactor Type 2025 & 2033
- Figure 35: Asia Pacific APAC Nuclear Power Reactor Decommissioning Industry Revenue Share (%), by Reactor Type 2025 & 2033
- Figure 36: Asia Pacific APAC Nuclear Power Reactor Decommissioning Industry Revenue (billion), by Application 2025 & 2033
- Figure 37: Asia Pacific APAC Nuclear Power Reactor Decommissioning Industry Revenue Share (%), by Application 2025 & 2033
- Figure 38: Asia Pacific APAC Nuclear Power Reactor Decommissioning Industry Revenue (billion), by Capacity 2025 & 2033
- Figure 39: Asia Pacific APAC Nuclear Power Reactor Decommissioning Industry Revenue Share (%), by Capacity 2025 & 2033
- Figure 40: Asia Pacific APAC Nuclear Power Reactor Decommissioning Industry Revenue (billion), by Country 2025 & 2033
- Figure 41: Asia Pacific APAC Nuclear Power Reactor Decommissioning Industry Revenue Share (%), by Country 2025 & 2033
List of Tables
- Table 1: Global APAC Nuclear Power Reactor Decommissioning Industry Revenue billion Forecast, by Reactor Type 2020 & 2033
- Table 2: Global APAC Nuclear Power Reactor Decommissioning Industry Revenue billion Forecast, by Application 2020 & 2033
- Table 3: Global APAC Nuclear Power Reactor Decommissioning Industry Revenue billion Forecast, by Capacity 2020 & 2033
- Table 4: Global APAC Nuclear Power Reactor Decommissioning Industry Revenue billion Forecast, by Region 2020 & 2033
- Table 5: Global APAC Nuclear Power Reactor Decommissioning Industry Revenue billion Forecast, by Reactor Type 2020 & 2033
- Table 6: Global APAC Nuclear Power Reactor Decommissioning Industry Revenue billion Forecast, by Application 2020 & 2033
- Table 7: Global APAC Nuclear Power Reactor Decommissioning Industry Revenue billion Forecast, by Capacity 2020 & 2033
- Table 8: Global APAC Nuclear Power Reactor Decommissioning Industry Revenue billion Forecast, by Country 2020 & 2033
- Table 9: United States APAC Nuclear Power Reactor Decommissioning Industry Revenue (billion) Forecast, by Application 2020 & 2033
- Table 10: Canada APAC Nuclear Power Reactor Decommissioning Industry Revenue (billion) Forecast, by Application 2020 & 2033
- Table 11: Mexico APAC Nuclear Power Reactor Decommissioning Industry Revenue (billion) Forecast, by Application 2020 & 2033
- Table 12: Global APAC Nuclear Power Reactor Decommissioning Industry Revenue billion Forecast, by Reactor Type 2020 & 2033
- Table 13: Global APAC Nuclear Power Reactor Decommissioning Industry Revenue billion Forecast, by Application 2020 & 2033
- Table 14: Global APAC Nuclear Power Reactor Decommissioning Industry Revenue billion Forecast, by Capacity 2020 & 2033
- Table 15: Global APAC Nuclear Power Reactor Decommissioning Industry Revenue billion Forecast, by Country 2020 & 2033
- Table 16: Brazil APAC Nuclear Power Reactor Decommissioning Industry Revenue (billion) Forecast, by Application 2020 & 2033
- Table 17: Argentina APAC Nuclear Power Reactor Decommissioning Industry Revenue (billion) Forecast, by Application 2020 & 2033
- Table 18: Rest of South America APAC Nuclear Power Reactor Decommissioning Industry Revenue (billion) Forecast, by Application 2020 & 2033
- Table 19: Global APAC Nuclear Power Reactor Decommissioning Industry Revenue billion Forecast, by Reactor Type 2020 & 2033
- Table 20: Global APAC Nuclear Power Reactor Decommissioning Industry Revenue billion Forecast, by Application 2020 & 2033
- Table 21: Global APAC Nuclear Power Reactor Decommissioning Industry Revenue billion Forecast, by Capacity 2020 & 2033
- Table 22: Global APAC Nuclear Power Reactor Decommissioning Industry Revenue billion Forecast, by Country 2020 & 2033
- Table 23: United Kingdom APAC Nuclear Power Reactor Decommissioning Industry Revenue (billion) Forecast, by Application 2020 & 2033
- Table 24: Germany APAC Nuclear Power Reactor Decommissioning Industry Revenue (billion) Forecast, by Application 2020 & 2033
- Table 25: France APAC Nuclear Power Reactor Decommissioning Industry Revenue (billion) Forecast, by Application 2020 & 2033
- Table 26: Italy APAC Nuclear Power Reactor Decommissioning Industry Revenue (billion) Forecast, by Application 2020 & 2033
- Table 27: Spain APAC Nuclear Power Reactor Decommissioning Industry Revenue (billion) Forecast, by Application 2020 & 2033
- Table 28: Russia APAC Nuclear Power Reactor Decommissioning Industry Revenue (billion) Forecast, by Application 2020 & 2033
- Table 29: Benelux APAC Nuclear Power Reactor Decommissioning Industry Revenue (billion) Forecast, by Application 2020 & 2033
- Table 30: Nordics APAC Nuclear Power Reactor Decommissioning Industry Revenue (billion) Forecast, by Application 2020 & 2033
- Table 31: Rest of Europe APAC Nuclear Power Reactor Decommissioning Industry Revenue (billion) Forecast, by Application 2020 & 2033
- Table 32: Global APAC Nuclear Power Reactor Decommissioning Industry Revenue billion Forecast, by Reactor Type 2020 & 2033
- Table 33: Global APAC Nuclear Power Reactor Decommissioning Industry Revenue billion Forecast, by Application 2020 & 2033
- Table 34: Global APAC Nuclear Power Reactor Decommissioning Industry Revenue billion Forecast, by Capacity 2020 & 2033
- Table 35: Global APAC Nuclear Power Reactor Decommissioning Industry Revenue billion Forecast, by Country 2020 & 2033
- Table 36: Turkey APAC Nuclear Power Reactor Decommissioning Industry Revenue (billion) Forecast, by Application 2020 & 2033
- Table 37: Israel APAC Nuclear Power Reactor Decommissioning Industry Revenue (billion) Forecast, by Application 2020 & 2033
- Table 38: GCC APAC Nuclear Power Reactor Decommissioning Industry Revenue (billion) Forecast, by Application 2020 & 2033
- Table 39: North Africa APAC Nuclear Power Reactor Decommissioning Industry Revenue (billion) Forecast, by Application 2020 & 2033
- Table 40: South Africa APAC Nuclear Power Reactor Decommissioning Industry Revenue (billion) Forecast, by Application 2020 & 2033
- Table 41: Rest of Middle East & Africa APAC Nuclear Power Reactor Decommissioning Industry Revenue (billion) Forecast, by Application 2020 & 2033
- Table 42: Global APAC Nuclear Power Reactor Decommissioning Industry Revenue billion Forecast, by Reactor Type 2020 & 2033
- Table 43: Global APAC Nuclear Power Reactor Decommissioning Industry Revenue billion Forecast, by Application 2020 & 2033
- Table 44: Global APAC Nuclear Power Reactor Decommissioning Industry Revenue billion Forecast, by Capacity 2020 & 2033
- Table 45: Global APAC Nuclear Power Reactor Decommissioning Industry Revenue billion Forecast, by Country 2020 & 2033
- Table 46: China APAC Nuclear Power Reactor Decommissioning Industry Revenue (billion) Forecast, by Application 2020 & 2033
- Table 47: India APAC Nuclear Power Reactor Decommissioning Industry Revenue (billion) Forecast, by Application 2020 & 2033
- Table 48: Japan APAC Nuclear Power Reactor Decommissioning Industry Revenue (billion) Forecast, by Application 2020 & 2033
- Table 49: South Korea APAC Nuclear Power Reactor Decommissioning Industry Revenue (billion) Forecast, by Application 2020 & 2033
- Table 50: ASEAN APAC Nuclear Power Reactor Decommissioning Industry Revenue (billion) Forecast, by Application 2020 & 2033
- Table 51: Oceania APAC Nuclear Power Reactor Decommissioning Industry Revenue (billion) Forecast, by Application 2020 & 2033
- Table 52: Rest of Asia Pacific APAC Nuclear Power Reactor Decommissioning Industry Revenue (billion) Forecast, by Application 2020 & 2033
Frequently Asked Questions
1. What is the projected Compound Annual Growth Rate (CAGR) of the APAC Nuclear Power Reactor Decommissioning Industry?
The projected CAGR is approximately 3.59%.
2. Which companies are prominent players in the APAC Nuclear Power Reactor Decommissioning Industry?
Key companies in the market include Toshiba Corp*List Not Exhaustive, Korea Hydro & Nuclear Power Co Ltd, Orano SA, TÜV Rheinland Group, Snc-Lavalin Group Inc (Atkins), The Japan Atomic Power Co, GE- Hitachi Nuclear Energy Ltd, Tokyo Electric Power Company Holdings Inc.
3. What are the main segments of the APAC Nuclear Power Reactor Decommissioning Industry?
The market segments include Reactor Type, Application, Capacity.
4. Can you provide details about the market size?
The market size is estimated to be USD 8.01 billion as of 2022.
5. What are some drivers contributing to market growth?
Rising Demand for Reliable Electricity; Increasing Government Support for Hydropower Generation.
6. What are the notable trends driving market growth?
Commercial Power Reactor Expected to Dominate the Market.
7. Are there any restraints impacting market growth?
Negative Environmental Consequences of Hydropower Projects.
8. Can you provide examples of recent developments in the market?
May 2022: USA-based engineering group Jacobs has been selected by Tokyo Electric Power Company (Tepco) to support decommissioning efforts at its damaged Fukushima Daiichi nuclear power plant in Japan.
9. What pricing options are available for accessing the report?
Pricing options include single-user, multi-user, and enterprise licenses priced at USD 4750, USD 5250, and USD 8750 respectively.
10. Is the market size provided in terms of value or volume?
The market size is provided in terms of value, measured in billion.
11. Are there any specific market keywords associated with the report?
Yes, the market keyword associated with the report is "APAC Nuclear Power Reactor Decommissioning Industry," which aids in identifying and referencing the specific market segment covered.
12. How do I determine which pricing option suits my needs best?
The pricing options vary based on user requirements and access needs. Individual users may opt for single-user licenses, while businesses requiring broader access may choose multi-user or enterprise licenses for cost-effective access to the report.
13. Are there any additional resources or data provided in the APAC Nuclear Power Reactor Decommissioning Industry report?
While the report offers comprehensive insights, it's advisable to review the specific contents or supplementary materials provided to ascertain if additional resources or data are available.
14. How can I stay updated on further developments or reports in the APAC Nuclear Power Reactor Decommissioning Industry?
To stay informed about further developments, trends, and reports in the APAC Nuclear Power Reactor Decommissioning Industry, consider subscribing to industry newsletters, following relevant companies and organizations, or regularly checking reputable industry news sources and publications.
Methodology
Step 1 - Identification of Relevant Samples Size from Population Database


Step 2 - Approaches for Defining Global Market Size (Value, Volume* & Price*)

Note*: In applicable scenarios
Step 3 - Data Sources
Primary Research
- Web Analytics
- Survey Reports
- Research Institute
- Latest Research Reports
- Opinion Leaders
Secondary Research
- Annual Reports
- White Paper
- Latest Press Release
- Industry Association
- Paid Database
- Investor Presentations

Step 4 - Data Triangulation
Involves using different sources of information in order to increase the validity of a study
These sources are likely to be stakeholders in a program - participants, other researchers, program staff, other community members, and so on.
Then we put all data in single framework & apply various statistical tools to find out the dynamic on the market.
During the analysis stage, feedback from the stakeholder groups would be compared to determine areas of agreement as well as areas of divergence