

Key Insights
The Australian coal industry demonstrates resilience amid global decarbonization trends, supported by robust domestic demand and strategic export markets. The market, valued at approximately $57 billion in 2024, is projected to grow at a Compound Annual Growth Rate (CAGR) of 2.2% through 2033. Key growth drivers include sustained demand for thermal coal from Asia-Pacific power generation and essential coking coal for steel production. Despite challenges from environmental regulations and the rise of renewable energy, ongoing energy security needs in critical import nations provide a counterbalance. The industry's segmentation by coal type (thermal, coking, semi-soft coking) and end-use reveals diverse growth potential influenced by specific applications and global economic conditions. Major players are adopting strategies such as export market diversification and technological advancements to mitigate environmental impact. Strong competition persists, particularly in thermal coal, though coking coal demand offers market stability.
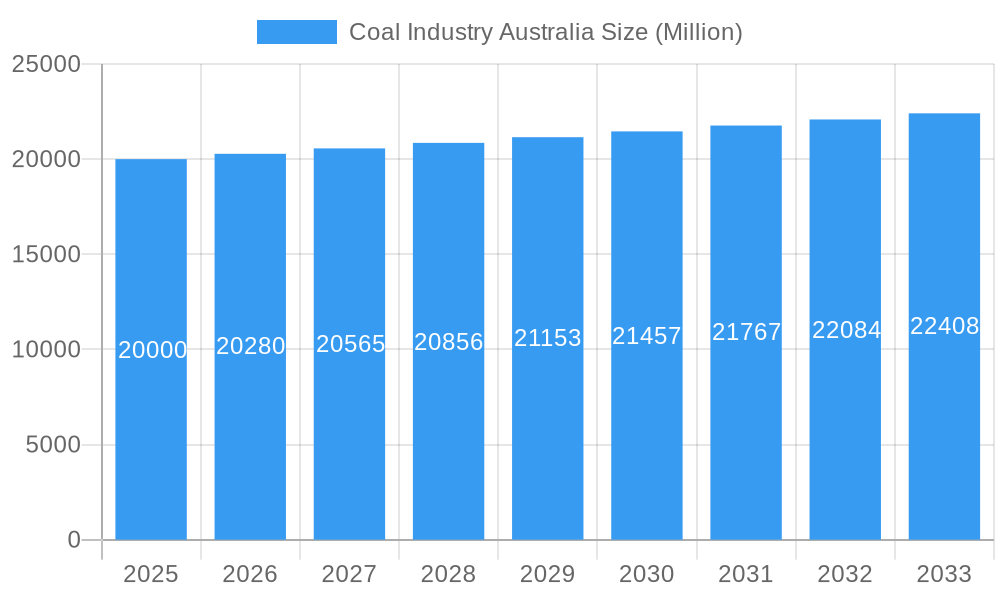
Coal Industry Australia Market Size (In Billion)
Regional concentration in the Asia-Pacific highlights the industry's reliance on regional economic growth and energy policies. Australia's established mining infrastructure and export channels solidify its position as a leading global supplier. Future demand assessments must account for emerging renewable energy technologies and potential policy shifts. Successful navigation of these dynamics hinges on technological innovation, strategic diversification, and adaptability to evolving global energy landscapes. Industry participants are prioritizing responsible mining practices and carbon footprint reduction in response to increasing environmental scrutiny. This ongoing equilibrium between economic viability and environmental sustainability will dictate the Australian coal industry's future trajectory.
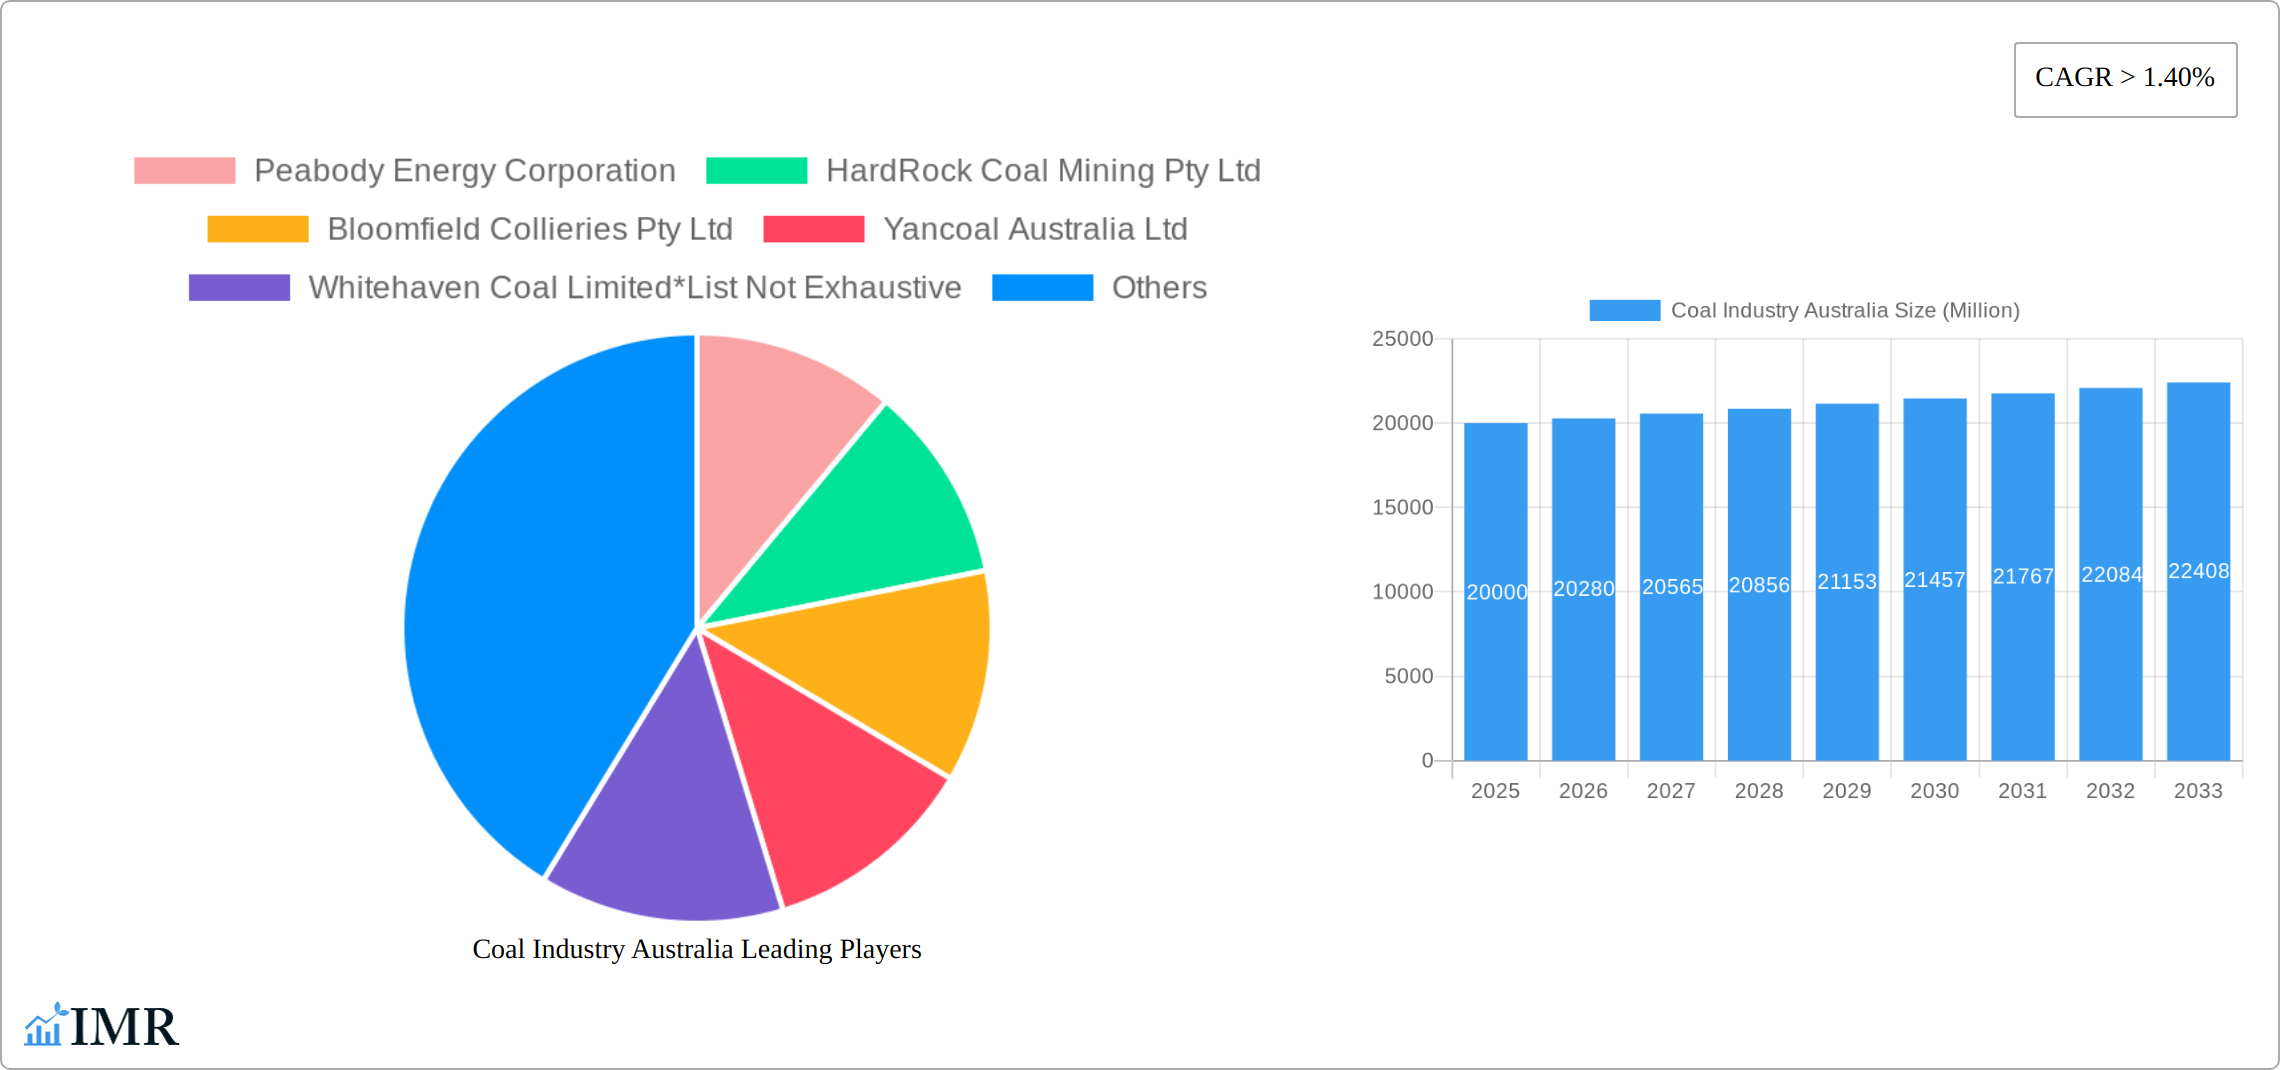
Coal Industry Australia Company Market Share
Coal Industry Australia: Market Dynamics, Growth, and Future Outlook (2019-2033)
This comprehensive report provides an in-depth analysis of the Australian coal industry, covering market dynamics, growth trends, key players, and future outlook from 2019 to 2033. With a focus on both thermal and coking coal segments, the report offers invaluable insights for industry professionals, investors, and policymakers. The study period covers 2019-2033, with 2025 as the base and estimated year. The forecast period is 2025-2033, and the historical period is 2019-2024. The report's quantitative analysis includes market size in millions of units and qualitative assessments of key industry drivers and challenges.
Coal Industry Australia Market Dynamics & Structure
This section analyzes the competitive landscape, technological advancements, regulatory environment, and market trends within the Australian coal industry. We examine market concentration, assessing the dominance of major players like Peabody Energy Corporation, Yancoal Australia Ltd, and Whitehaven Coal Limited, among others. The report quantifies market share percentages and analyzes the impact of mergers and acquisitions (M&A) activity. We also investigate the influence of evolving government regulations, the presence of substitute energy sources, and the shifting demographics of end-users.
- Market Concentration: Analysis of market share held by top 10 players (xx%).
- Technological Innovation: Assessment of automation, extraction techniques, and efficiency improvements (xx% increase in productivity projected by 2033).
- Regulatory Framework: Impact of environmental regulations, carbon emission targets, and mining licenses on industry operations.
- Competitive Substitutes: Evaluation of renewable energy sources (solar, wind) and their impact on coal demand (xx% decrease in coal consumption projected by 2033 due to renewable energy adoption).
- End-User Demographics: Analysis of coal demand from power generation, steelmaking, and industrial sectors.
- M&A Trends: Review of past M&A activity and projection of future consolidation (xx number of M&A deals predicted between 2025-2033).
Coal Industry Australia Growth Trends & Insights
The Australian coal market is a dynamic landscape shaped by complex interplay of global energy demand, technological advancements, environmental regulations, and economic factors. This section provides a detailed analysis of the industry's growth trajectory, leveraging robust data and insightful projections to forecast future market size and identify key growth drivers and challenges. We delve into the Compound Annual Growth Rate (CAGR), market penetration across diverse coal types (thermal, metallurgical/coking, and semi-soft coking coal), and end-use applications (electricity generation, steel production, and industrial processes). Furthermore, we examine the impact of technological innovation on production efficiency, the influence of evolving government policies and environmental regulations on consumer behavior, and the strategic responses of industry players to these shifting dynamics.
Dominant Regions, Countries, or Segments in Coal Industry Australia
This section identifies the leading regions, countries, and segments within the Australian coal market. We analyze the dominance factors for each, including market share, growth potential, and influencing factors like economic policies and infrastructure development. Specific focus is given to the performance of thermal coal versus coking coal and the end-use sectors (power generation, steelmaking, industrial applications).
- Key Drivers: Economic growth in Asia (particularly China and India), government policies supporting coal production (e.g., resource extraction permits), and existing infrastructure supporting coal transport and handling.
- Dominant Regions: Analysis of leading coal-producing states (e.g., Queensland, New South Wales) and their contribution to national coal output.
- Market Share: Breakdown of market share by coal type and end-use sector (e.g., thermal coal for power generation).
- Growth Potential: Projection of future growth based on anticipated demand and supply-side factors.
Coal Industry Australia Product Landscape
This section describes the key coal products within the Australian market, outlining their applications and performance characteristics. We highlight unique selling propositions (USPs), technological advancements in coal extraction and processing, and emerging product innovations designed to meet evolving end-user requirements and address environmental concerns.
Key Drivers, Barriers & Challenges in Coal Industry Australia
The growth of the Australian coal industry is influenced by a multitude of factors, both propelling and hindering its progress. Understanding this complex interplay is crucial for strategic planning and informed decision-making.
Key Drivers:
- Robust Global Energy Demand: Continued strong demand for energy, particularly from developing economies, fuels the need for reliable and affordable energy sources, including coal.
- Technological Advancements: Innovations in mining techniques, processing technologies, and logistics are enhancing efficiency and reducing production costs.
- Strategic Government Support (in specific regions): Targeted government policies and infrastructure investments in certain regions can provide a supportive environment for coal production.
Key Challenges & Restraints:
- Stringent Environmental Regulations: Increasingly stringent environmental regulations and carbon emission reduction targets pose significant challenges, impacting profitability and necessitating investments in cleaner technologies and emission reduction strategies. (Quantifiable impact on profitability should be included here, e.g., "projected X% reduction in profitability by 2030 under current regulatory frameworks").
- Competition from Renewable Energy: The rapid growth of renewable energy sources, such as solar and wind power, presents increasing competition and is projected to impact market share. (Include specific projections, e.g., "projected Y% market share loss by 2033 due to increased renewable energy adoption").
- Market Volatility and Supply Chain Disruptions: Fluctuations in global coal prices and potential supply chain disruptions due to geopolitical events or unforeseen circumstances can impact revenue stability and require robust risk management strategies. (Include specific projections, e.g., "projected Z% price volatility based on current market analysis").
Emerging Opportunities in Coal Industry Australia
Despite the challenges, several emerging opportunities exist for the Australian coal industry. These include exploring new applications for coal-derived products, investing in advanced clean coal technologies to reduce environmental impact, and strategically targeting export markets with high energy demand and supportive regulatory environments. This requires a focus on innovation, technological advancement, and strategic partnerships to navigate the evolving global energy landscape.
Growth Accelerators in the Coal Industry Australia Industry
The Australian coal industry can achieve accelerated growth by focusing on several key strategies. Technological breakthroughs in mining and processing, such as automation and improved efficiency, are crucial. Strategic partnerships within the supply chain can enhance logistics and reduce costs. Targeted market expansion strategies focused on key export destinations, particularly those with strong energy demands and less stringent environmental regulations, can also significantly contribute to growth. These proactive strategies can effectively mitigate the negative impacts of regulatory pressures and competition from renewable sources, ensuring the long-term sustainability and competitiveness of the industry.
Key Players Shaping the Coal Industry Australia Market
- Peabody Energy Corporation
- HardRock Coal Mining Pty Ltd
- Bloomfield Collieries Pty Ltd
- Yancoal Australia Ltd
- Whitehaven Coal Limited
- Idemitsu Australia Resources Pty Ltd
- Jellinbah Group Pty Ltd
- BHP Group Ltd
- Centennial Coal Company Ltd
- Vale S A
Notable Milestones in Coal Industry Australia Sector
- September 2022: AGL Energy announced the closure of its Loy Yang A coal-fired power station in Victoria by 2035. This signifies a shift away from coal-fired power generation, impacting long-term coal demand.
- October 2022: New South Wales (NSW) Electricity Infrastructure awarded contracts to replace four of its five remaining coal power stations over the next 11 years. This signals further investment in electricity infrastructure, but with a transition away from coal-fired power.
In-Depth Coal Industry Australia Market Outlook
The Australian coal industry faces significant challenges from environmental regulations and competition from renewable energy sources. However, continued global demand for energy, particularly in developing economies, coupled with technological advancements in coal mining and processing, suggests that the industry will retain relevance in the medium term. Strategic partnerships, focus on high-quality coal exports, and exploration of new applications can mitigate risks and capitalize on the remaining market opportunities. Further investment in carbon capture and storage technologies will become increasingly crucial.
Coal Industry Australia Segmentation
- 1. Electricity
- 2. Iron and Steel
- 3. Other Applications
Coal Industry Australia Segmentation By Geography
-
1. North America
- 1.1. United States
- 1.2. Canada
- 1.3. Mexico
-
2. South America
- 2.1. Brazil
- 2.2. Argentina
- 2.3. Rest of South America
-
3. Europe
- 3.1. United Kingdom
- 3.2. Germany
- 3.3. France
- 3.4. Italy
- 3.5. Spain
- 3.6. Russia
- 3.7. Benelux
- 3.8. Nordics
- 3.9. Rest of Europe
-
4. Middle East & Africa
- 4.1. Turkey
- 4.2. Israel
- 4.3. GCC
- 4.4. North Africa
- 4.5. South Africa
- 4.6. Rest of Middle East & Africa
-
5. Asia Pacific
- 5.1. China
- 5.2. India
- 5.3. Japan
- 5.4. South Korea
- 5.5. ASEAN
- 5.6. Oceania
- 5.7. Rest of Asia Pacific
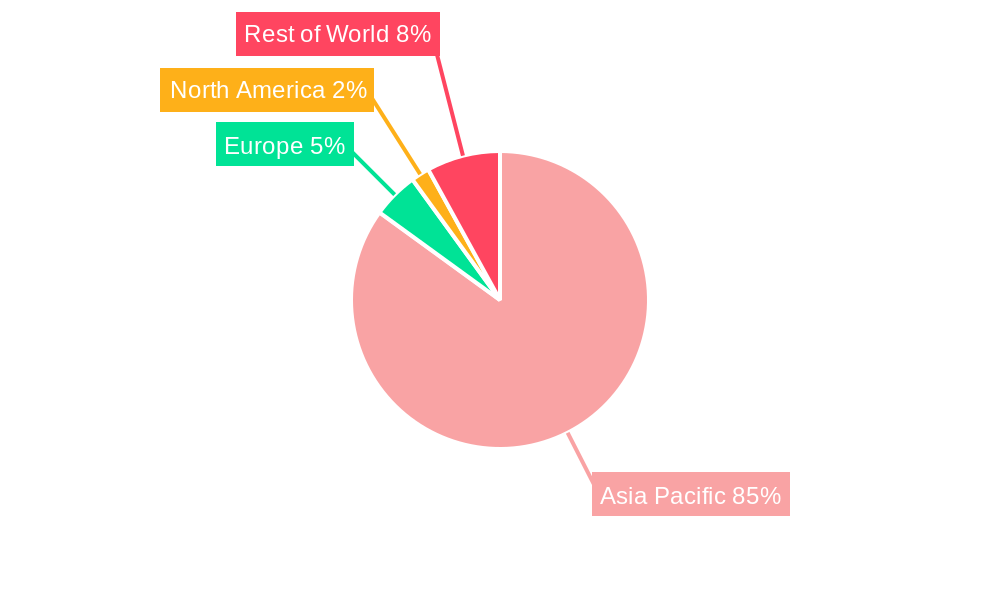
Coal Industry Australia Regional Market Share
Geographic Coverage of Coal Industry Australia
Coal Industry Australia REPORT HIGHLIGHTS
| Aspects | Details |
|---|---|
| Study Period | 2020-2034 |
| Base Year | 2025 |
| Estimated Year | 2026 |
| Forecast Period | 2026-2034 |
| Historical Period | 2020-2025 |
| Growth Rate | CAGR of 2.2% from 2020-2034 |
| Segmentation |
|
Table of Contents
- 1. Introduction
- 1.1. Research Scope
- 1.2. Market Segmentation
- 1.3. Research Objective
- 1.4. Definitions and Assumptions
- 2. Executive Summary
- 2.1. Market Snapshot
- 3. Market Dynamics
- 3.1. Market Drivers
- 3.2. Market Restrains
- 3.3. Market Trends
- 3.4. Market Opportunities
- 4. Market Factor Analysis
- 4.1. Porters Five Forces
- 4.1.1. Bargaining Power of Suppliers
- 4.1.2. Bargaining Power of Buyers
- 4.1.3. Threat of New Entrants
- 4.1.4. Threat of Substitutes
- 4.1.5. Competitive Rivalry
- 4.2. PESTEL analysis
- 4.3. BCG Analysis
- 4.3.1. Stars (High Growth, High Market Share)
- 4.3.2. Cash Cows (Low Growth, High Market Share)
- 4.3.3. Question Mark (High Growth, Low Market Share)
- 4.3.4. Dogs (Low Growth, Low Market Share)
- 4.4. Ansoff Matrix Analysis
- 4.5. Supply Chain Analysis
- 4.6. Regulatory Landscape
- 4.7. Current Market Potential and Opportunity Assessment (TAM–SAM–SOM Framework)
- 4.8. IMR Analyst Note
- 4.1. Porters Five Forces
- 5. Market Analysis, Insights and Forecast 2021-2033
- 5.1. Market Analysis, Insights and Forecast - by Electricity
- 5.2. Market Analysis, Insights and Forecast - by Iron and Steel
- 5.3. Market Analysis, Insights and Forecast - by Other Applications
- 5.4. Market Analysis, Insights and Forecast - by Region
- 5.4.1. North America
- 5.4.2. South America
- 5.4.3. Europe
- 5.4.4. Middle East & Africa
- 5.4.5. Asia Pacific
- 6. Global Coal Industry Australia Analysis, Insights and Forecast, 2021-2033
- 6.1. Market Analysis, Insights and Forecast - by Electricity
- 6.2. Market Analysis, Insights and Forecast - by Iron and Steel
- 6.3. Market Analysis, Insights and Forecast - by Other Applications
- 7. North America Coal Industry Australia Analysis, Insights and Forecast, 2020-2032
- 7.1. Market Analysis, Insights and Forecast - by Electricity
- 7.2. Market Analysis, Insights and Forecast - by Iron and Steel
- 7.3. Market Analysis, Insights and Forecast - by Other Applications
- 8. South America Coal Industry Australia Analysis, Insights and Forecast, 2020-2032
- 8.1. Market Analysis, Insights and Forecast - by Electricity
- 8.2. Market Analysis, Insights and Forecast - by Iron and Steel
- 8.3. Market Analysis, Insights and Forecast - by Other Applications
- 9. Europe Coal Industry Australia Analysis, Insights and Forecast, 2020-2032
- 9.1. Market Analysis, Insights and Forecast - by Electricity
- 9.2. Market Analysis, Insights and Forecast - by Iron and Steel
- 9.3. Market Analysis, Insights and Forecast - by Other Applications
- 10. Middle East & Africa Coal Industry Australia Analysis, Insights and Forecast, 2020-2032
- 10.1. Market Analysis, Insights and Forecast - by Electricity
- 10.2. Market Analysis, Insights and Forecast - by Iron and Steel
- 10.3. Market Analysis, Insights and Forecast - by Other Applications
- 11. Asia Pacific Coal Industry Australia Analysis, Insights and Forecast, 2020-2032
- 11.1. Market Analysis, Insights and Forecast - by Electricity
- 11.2. Market Analysis, Insights and Forecast - by Iron and Steel
- 11.3. Market Analysis, Insights and Forecast - by Other Applications
- 12. Competitive Analysis
- 12.1. Company Profiles
- 12.1.1 Peabody Energy Corporation
- 12.1.1.1. Company Overview
- 12.1.1.2. Products
- 12.1.1.3. Company Financials
- 12.1.1.4. SWOT Analysis
- 12.1.2 HardRock Coal Mining Pty Ltd
- 12.1.2.1. Company Overview
- 12.1.2.2. Products
- 12.1.2.3. Company Financials
- 12.1.2.4. SWOT Analysis
- 12.1.3 Bloomfield Collieries Pty Ltd
- 12.1.3.1. Company Overview
- 12.1.3.2. Products
- 12.1.3.3. Company Financials
- 12.1.3.4. SWOT Analysis
- 12.1.4 Yancoal Australia Ltd
- 12.1.4.1. Company Overview
- 12.1.4.2. Products
- 12.1.4.3. Company Financials
- 12.1.4.4. SWOT Analysis
- 12.1.5 Whitehaven Coal Limited*List Not Exhaustive
- 12.1.5.1. Company Overview
- 12.1.5.2. Products
- 12.1.5.3. Company Financials
- 12.1.5.4. SWOT Analysis
- 12.1.6 Idemitsu Australia Resources Pty Ltd
- 12.1.6.1. Company Overview
- 12.1.6.2. Products
- 12.1.6.3. Company Financials
- 12.1.6.4. SWOT Analysis
- 12.1.7 Jellinbah Group Pty Ltd
- 12.1.7.1. Company Overview
- 12.1.7.2. Products
- 12.1.7.3. Company Financials
- 12.1.7.4. SWOT Analysis
- 12.1.8 BHP Group Ltd
- 12.1.8.1. Company Overview
- 12.1.8.2. Products
- 12.1.8.3. Company Financials
- 12.1.8.4. SWOT Analysis
- 12.1.9 Centennial Coal Company Ltd
- 12.1.9.1. Company Overview
- 12.1.9.2. Products
- 12.1.9.3. Company Financials
- 12.1.9.4. SWOT Analysis
- 12.1.10 Vale S A
- 12.1.10.1. Company Overview
- 12.1.10.2. Products
- 12.1.10.3. Company Financials
- 12.1.10.4. SWOT Analysis
- 12.1.1 Peabody Energy Corporation
- 12.2. Market Entropy
- 12.2.1 Company's Key Areas Served
- 12.2.2 Recent Developments
- 12.3. Company Market Share Analysis 2025
- 12.3.1 Top 5 Companies Market Share Analysis
- 12.3.2 Top 3 Companies Market Share Analysis
- 12.4. List of Potential Customers
- 13. Research Methodology
List of Figures
- Figure 1: Global Coal Industry Australia Revenue Breakdown (billion, %) by Region 2025 & 2033
- Figure 2: Global Coal Industry Australia Volume Breakdown (Kiloton, %) by Region 2025 & 2033
- Figure 3: North America Coal Industry Australia Revenue (billion), by Electricity 2025 & 2033
- Figure 4: North America Coal Industry Australia Volume (Kiloton), by Electricity 2025 & 2033
- Figure 5: North America Coal Industry Australia Revenue Share (%), by Electricity 2025 & 2033
- Figure 6: North America Coal Industry Australia Volume Share (%), by Electricity 2025 & 2033
- Figure 7: North America Coal Industry Australia Revenue (billion), by Iron and Steel 2025 & 2033
- Figure 8: North America Coal Industry Australia Volume (Kiloton), by Iron and Steel 2025 & 2033
- Figure 9: North America Coal Industry Australia Revenue Share (%), by Iron and Steel 2025 & 2033
- Figure 10: North America Coal Industry Australia Volume Share (%), by Iron and Steel 2025 & 2033
- Figure 11: North America Coal Industry Australia Revenue (billion), by Other Applications 2025 & 2033
- Figure 12: North America Coal Industry Australia Volume (Kiloton), by Other Applications 2025 & 2033
- Figure 13: North America Coal Industry Australia Revenue Share (%), by Other Applications 2025 & 2033
- Figure 14: North America Coal Industry Australia Volume Share (%), by Other Applications 2025 & 2033
- Figure 15: North America Coal Industry Australia Revenue (billion), by Country 2025 & 2033
- Figure 16: North America Coal Industry Australia Volume (Kiloton), by Country 2025 & 2033
- Figure 17: North America Coal Industry Australia Revenue Share (%), by Country 2025 & 2033
- Figure 18: North America Coal Industry Australia Volume Share (%), by Country 2025 & 2033
- Figure 19: South America Coal Industry Australia Revenue (billion), by Electricity 2025 & 2033
- Figure 20: South America Coal Industry Australia Volume (Kiloton), by Electricity 2025 & 2033
- Figure 21: South America Coal Industry Australia Revenue Share (%), by Electricity 2025 & 2033
- Figure 22: South America Coal Industry Australia Volume Share (%), by Electricity 2025 & 2033
- Figure 23: South America Coal Industry Australia Revenue (billion), by Iron and Steel 2025 & 2033
- Figure 24: South America Coal Industry Australia Volume (Kiloton), by Iron and Steel 2025 & 2033
- Figure 25: South America Coal Industry Australia Revenue Share (%), by Iron and Steel 2025 & 2033
- Figure 26: South America Coal Industry Australia Volume Share (%), by Iron and Steel 2025 & 2033
- Figure 27: South America Coal Industry Australia Revenue (billion), by Other Applications 2025 & 2033
- Figure 28: South America Coal Industry Australia Volume (Kiloton), by Other Applications 2025 & 2033
- Figure 29: South America Coal Industry Australia Revenue Share (%), by Other Applications 2025 & 2033
- Figure 30: South America Coal Industry Australia Volume Share (%), by Other Applications 2025 & 2033
- Figure 31: South America Coal Industry Australia Revenue (billion), by Country 2025 & 2033
- Figure 32: South America Coal Industry Australia Volume (Kiloton), by Country 2025 & 2033
- Figure 33: South America Coal Industry Australia Revenue Share (%), by Country 2025 & 2033
- Figure 34: South America Coal Industry Australia Volume Share (%), by Country 2025 & 2033
- Figure 35: Europe Coal Industry Australia Revenue (billion), by Electricity 2025 & 2033
- Figure 36: Europe Coal Industry Australia Volume (Kiloton), by Electricity 2025 & 2033
- Figure 37: Europe Coal Industry Australia Revenue Share (%), by Electricity 2025 & 2033
- Figure 38: Europe Coal Industry Australia Volume Share (%), by Electricity 2025 & 2033
- Figure 39: Europe Coal Industry Australia Revenue (billion), by Iron and Steel 2025 & 2033
- Figure 40: Europe Coal Industry Australia Volume (Kiloton), by Iron and Steel 2025 & 2033
- Figure 41: Europe Coal Industry Australia Revenue Share (%), by Iron and Steel 2025 & 2033
- Figure 42: Europe Coal Industry Australia Volume Share (%), by Iron and Steel 2025 & 2033
- Figure 43: Europe Coal Industry Australia Revenue (billion), by Other Applications 2025 & 2033
- Figure 44: Europe Coal Industry Australia Volume (Kiloton), by Other Applications 2025 & 2033
- Figure 45: Europe Coal Industry Australia Revenue Share (%), by Other Applications 2025 & 2033
- Figure 46: Europe Coal Industry Australia Volume Share (%), by Other Applications 2025 & 2033
- Figure 47: Europe Coal Industry Australia Revenue (billion), by Country 2025 & 2033
- Figure 48: Europe Coal Industry Australia Volume (Kiloton), by Country 2025 & 2033
- Figure 49: Europe Coal Industry Australia Revenue Share (%), by Country 2025 & 2033
- Figure 50: Europe Coal Industry Australia Volume Share (%), by Country 2025 & 2033
- Figure 51: Middle East & Africa Coal Industry Australia Revenue (billion), by Electricity 2025 & 2033
- Figure 52: Middle East & Africa Coal Industry Australia Volume (Kiloton), by Electricity 2025 & 2033
- Figure 53: Middle East & Africa Coal Industry Australia Revenue Share (%), by Electricity 2025 & 2033
- Figure 54: Middle East & Africa Coal Industry Australia Volume Share (%), by Electricity 2025 & 2033
- Figure 55: Middle East & Africa Coal Industry Australia Revenue (billion), by Iron and Steel 2025 & 2033
- Figure 56: Middle East & Africa Coal Industry Australia Volume (Kiloton), by Iron and Steel 2025 & 2033
- Figure 57: Middle East & Africa Coal Industry Australia Revenue Share (%), by Iron and Steel 2025 & 2033
- Figure 58: Middle East & Africa Coal Industry Australia Volume Share (%), by Iron and Steel 2025 & 2033
- Figure 59: Middle East & Africa Coal Industry Australia Revenue (billion), by Other Applications 2025 & 2033
- Figure 60: Middle East & Africa Coal Industry Australia Volume (Kiloton), by Other Applications 2025 & 2033
- Figure 61: Middle East & Africa Coal Industry Australia Revenue Share (%), by Other Applications 2025 & 2033
- Figure 62: Middle East & Africa Coal Industry Australia Volume Share (%), by Other Applications 2025 & 2033
- Figure 63: Middle East & Africa Coal Industry Australia Revenue (billion), by Country 2025 & 2033
- Figure 64: Middle East & Africa Coal Industry Australia Volume (Kiloton), by Country 2025 & 2033
- Figure 65: Middle East & Africa Coal Industry Australia Revenue Share (%), by Country 2025 & 2033
- Figure 66: Middle East & Africa Coal Industry Australia Volume Share (%), by Country 2025 & 2033
- Figure 67: Asia Pacific Coal Industry Australia Revenue (billion), by Electricity 2025 & 2033
- Figure 68: Asia Pacific Coal Industry Australia Volume (Kiloton), by Electricity 2025 & 2033
- Figure 69: Asia Pacific Coal Industry Australia Revenue Share (%), by Electricity 2025 & 2033
- Figure 70: Asia Pacific Coal Industry Australia Volume Share (%), by Electricity 2025 & 2033
- Figure 71: Asia Pacific Coal Industry Australia Revenue (billion), by Iron and Steel 2025 & 2033
- Figure 72: Asia Pacific Coal Industry Australia Volume (Kiloton), by Iron and Steel 2025 & 2033
- Figure 73: Asia Pacific Coal Industry Australia Revenue Share (%), by Iron and Steel 2025 & 2033
- Figure 74: Asia Pacific Coal Industry Australia Volume Share (%), by Iron and Steel 2025 & 2033
- Figure 75: Asia Pacific Coal Industry Australia Revenue (billion), by Other Applications 2025 & 2033
- Figure 76: Asia Pacific Coal Industry Australia Volume (Kiloton), by Other Applications 2025 & 2033
- Figure 77: Asia Pacific Coal Industry Australia Revenue Share (%), by Other Applications 2025 & 2033
- Figure 78: Asia Pacific Coal Industry Australia Volume Share (%), by Other Applications 2025 & 2033
- Figure 79: Asia Pacific Coal Industry Australia Revenue (billion), by Country 2025 & 2033
- Figure 80: Asia Pacific Coal Industry Australia Volume (Kiloton), by Country 2025 & 2033
- Figure 81: Asia Pacific Coal Industry Australia Revenue Share (%), by Country 2025 & 2033
- Figure 82: Asia Pacific Coal Industry Australia Volume Share (%), by Country 2025 & 2033
List of Tables
- Table 1: Global Coal Industry Australia Revenue billion Forecast, by Electricity 2020 & 2033
- Table 2: Global Coal Industry Australia Volume Kiloton Forecast, by Electricity 2020 & 2033
- Table 3: Global Coal Industry Australia Revenue billion Forecast, by Iron and Steel 2020 & 2033
- Table 4: Global Coal Industry Australia Volume Kiloton Forecast, by Iron and Steel 2020 & 2033
- Table 5: Global Coal Industry Australia Revenue billion Forecast, by Other Applications 2020 & 2033
- Table 6: Global Coal Industry Australia Volume Kiloton Forecast, by Other Applications 2020 & 2033
- Table 7: Global Coal Industry Australia Revenue billion Forecast, by Region 2020 & 2033
- Table 8: Global Coal Industry Australia Volume Kiloton Forecast, by Region 2020 & 2033
- Table 9: Global Coal Industry Australia Revenue billion Forecast, by Electricity 2020 & 2033
- Table 10: Global Coal Industry Australia Volume Kiloton Forecast, by Electricity 2020 & 2033
- Table 11: Global Coal Industry Australia Revenue billion Forecast, by Iron and Steel 2020 & 2033
- Table 12: Global Coal Industry Australia Volume Kiloton Forecast, by Iron and Steel 2020 & 2033
- Table 13: Global Coal Industry Australia Revenue billion Forecast, by Other Applications 2020 & 2033
- Table 14: Global Coal Industry Australia Volume Kiloton Forecast, by Other Applications 2020 & 2033
- Table 15: Global Coal Industry Australia Revenue billion Forecast, by Country 2020 & 2033
- Table 16: Global Coal Industry Australia Volume Kiloton Forecast, by Country 2020 & 2033
- Table 17: United States Coal Industry Australia Revenue (billion) Forecast, by Application 2020 & 2033
- Table 18: United States Coal Industry Australia Volume (Kiloton) Forecast, by Application 2020 & 2033
- Table 19: Canada Coal Industry Australia Revenue (billion) Forecast, by Application 2020 & 2033
- Table 20: Canada Coal Industry Australia Volume (Kiloton) Forecast, by Application 2020 & 2033
- Table 21: Mexico Coal Industry Australia Revenue (billion) Forecast, by Application 2020 & 2033
- Table 22: Mexico Coal Industry Australia Volume (Kiloton) Forecast, by Application 2020 & 2033
- Table 23: Global Coal Industry Australia Revenue billion Forecast, by Electricity 2020 & 2033
- Table 24: Global Coal Industry Australia Volume Kiloton Forecast, by Electricity 2020 & 2033
- Table 25: Global Coal Industry Australia Revenue billion Forecast, by Iron and Steel 2020 & 2033
- Table 26: Global Coal Industry Australia Volume Kiloton Forecast, by Iron and Steel 2020 & 2033
- Table 27: Global Coal Industry Australia Revenue billion Forecast, by Other Applications 2020 & 2033
- Table 28: Global Coal Industry Australia Volume Kiloton Forecast, by Other Applications 2020 & 2033
- Table 29: Global Coal Industry Australia Revenue billion Forecast, by Country 2020 & 2033
- Table 30: Global Coal Industry Australia Volume Kiloton Forecast, by Country 2020 & 2033
- Table 31: Brazil Coal Industry Australia Revenue (billion) Forecast, by Application 2020 & 2033
- Table 32: Brazil Coal Industry Australia Volume (Kiloton) Forecast, by Application 2020 & 2033
- Table 33: Argentina Coal Industry Australia Revenue (billion) Forecast, by Application 2020 & 2033
- Table 34: Argentina Coal Industry Australia Volume (Kiloton) Forecast, by Application 2020 & 2033
- Table 35: Rest of South America Coal Industry Australia Revenue (billion) Forecast, by Application 2020 & 2033
- Table 36: Rest of South America Coal Industry Australia Volume (Kiloton) Forecast, by Application 2020 & 2033
- Table 37: Global Coal Industry Australia Revenue billion Forecast, by Electricity 2020 & 2033
- Table 38: Global Coal Industry Australia Volume Kiloton Forecast, by Electricity 2020 & 2033
- Table 39: Global Coal Industry Australia Revenue billion Forecast, by Iron and Steel 2020 & 2033
- Table 40: Global Coal Industry Australia Volume Kiloton Forecast, by Iron and Steel 2020 & 2033
- Table 41: Global Coal Industry Australia Revenue billion Forecast, by Other Applications 2020 & 2033
- Table 42: Global Coal Industry Australia Volume Kiloton Forecast, by Other Applications 2020 & 2033
- Table 43: Global Coal Industry Australia Revenue billion Forecast, by Country 2020 & 2033
- Table 44: Global Coal Industry Australia Volume Kiloton Forecast, by Country 2020 & 2033
- Table 45: United Kingdom Coal Industry Australia Revenue (billion) Forecast, by Application 2020 & 2033
- Table 46: United Kingdom Coal Industry Australia Volume (Kiloton) Forecast, by Application 2020 & 2033
- Table 47: Germany Coal Industry Australia Revenue (billion) Forecast, by Application 2020 & 2033
- Table 48: Germany Coal Industry Australia Volume (Kiloton) Forecast, by Application 2020 & 2033
- Table 49: France Coal Industry Australia Revenue (billion) Forecast, by Application 2020 & 2033
- Table 50: France Coal Industry Australia Volume (Kiloton) Forecast, by Application 2020 & 2033
- Table 51: Italy Coal Industry Australia Revenue (billion) Forecast, by Application 2020 & 2033
- Table 52: Italy Coal Industry Australia Volume (Kiloton) Forecast, by Application 2020 & 2033
- Table 53: Spain Coal Industry Australia Revenue (billion) Forecast, by Application 2020 & 2033
- Table 54: Spain Coal Industry Australia Volume (Kiloton) Forecast, by Application 2020 & 2033
- Table 55: Russia Coal Industry Australia Revenue (billion) Forecast, by Application 2020 & 2033
- Table 56: Russia Coal Industry Australia Volume (Kiloton) Forecast, by Application 2020 & 2033
- Table 57: Benelux Coal Industry Australia Revenue (billion) Forecast, by Application 2020 & 2033
- Table 58: Benelux Coal Industry Australia Volume (Kiloton) Forecast, by Application 2020 & 2033
- Table 59: Nordics Coal Industry Australia Revenue (billion) Forecast, by Application 2020 & 2033
- Table 60: Nordics Coal Industry Australia Volume (Kiloton) Forecast, by Application 2020 & 2033
- Table 61: Rest of Europe Coal Industry Australia Revenue (billion) Forecast, by Application 2020 & 2033
- Table 62: Rest of Europe Coal Industry Australia Volume (Kiloton) Forecast, by Application 2020 & 2033
- Table 63: Global Coal Industry Australia Revenue billion Forecast, by Electricity 2020 & 2033
- Table 64: Global Coal Industry Australia Volume Kiloton Forecast, by Electricity 2020 & 2033
- Table 65: Global Coal Industry Australia Revenue billion Forecast, by Iron and Steel 2020 & 2033
- Table 66: Global Coal Industry Australia Volume Kiloton Forecast, by Iron and Steel 2020 & 2033
- Table 67: Global Coal Industry Australia Revenue billion Forecast, by Other Applications 2020 & 2033
- Table 68: Global Coal Industry Australia Volume Kiloton Forecast, by Other Applications 2020 & 2033
- Table 69: Global Coal Industry Australia Revenue billion Forecast, by Country 2020 & 2033
- Table 70: Global Coal Industry Australia Volume Kiloton Forecast, by Country 2020 & 2033
- Table 71: Turkey Coal Industry Australia Revenue (billion) Forecast, by Application 2020 & 2033
- Table 72: Turkey Coal Industry Australia Volume (Kiloton) Forecast, by Application 2020 & 2033
- Table 73: Israel Coal Industry Australia Revenue (billion) Forecast, by Application 2020 & 2033
- Table 74: Israel Coal Industry Australia Volume (Kiloton) Forecast, by Application 2020 & 2033
- Table 75: GCC Coal Industry Australia Revenue (billion) Forecast, by Application 2020 & 2033
- Table 76: GCC Coal Industry Australia Volume (Kiloton) Forecast, by Application 2020 & 2033
- Table 77: North Africa Coal Industry Australia Revenue (billion) Forecast, by Application 2020 & 2033
- Table 78: North Africa Coal Industry Australia Volume (Kiloton) Forecast, by Application 2020 & 2033
- Table 79: South Africa Coal Industry Australia Revenue (billion) Forecast, by Application 2020 & 2033
- Table 80: South Africa Coal Industry Australia Volume (Kiloton) Forecast, by Application 2020 & 2033
- Table 81: Rest of Middle East & Africa Coal Industry Australia Revenue (billion) Forecast, by Application 2020 & 2033
- Table 82: Rest of Middle East & Africa Coal Industry Australia Volume (Kiloton) Forecast, by Application 2020 & 2033
- Table 83: Global Coal Industry Australia Revenue billion Forecast, by Electricity 2020 & 2033
- Table 84: Global Coal Industry Australia Volume Kiloton Forecast, by Electricity 2020 & 2033
- Table 85: Global Coal Industry Australia Revenue billion Forecast, by Iron and Steel 2020 & 2033
- Table 86: Global Coal Industry Australia Volume Kiloton Forecast, by Iron and Steel 2020 & 2033
- Table 87: Global Coal Industry Australia Revenue billion Forecast, by Other Applications 2020 & 2033
- Table 88: Global Coal Industry Australia Volume Kiloton Forecast, by Other Applications 2020 & 2033
- Table 89: Global Coal Industry Australia Revenue billion Forecast, by Country 2020 & 2033
- Table 90: Global Coal Industry Australia Volume Kiloton Forecast, by Country 2020 & 2033
- Table 91: China Coal Industry Australia Revenue (billion) Forecast, by Application 2020 & 2033
- Table 92: China Coal Industry Australia Volume (Kiloton) Forecast, by Application 2020 & 2033
- Table 93: India Coal Industry Australia Revenue (billion) Forecast, by Application 2020 & 2033
- Table 94: India Coal Industry Australia Volume (Kiloton) Forecast, by Application 2020 & 2033
- Table 95: Japan Coal Industry Australia Revenue (billion) Forecast, by Application 2020 & 2033
- Table 96: Japan Coal Industry Australia Volume (Kiloton) Forecast, by Application 2020 & 2033
- Table 97: South Korea Coal Industry Australia Revenue (billion) Forecast, by Application 2020 & 2033
- Table 98: South Korea Coal Industry Australia Volume (Kiloton) Forecast, by Application 2020 & 2033
- Table 99: ASEAN Coal Industry Australia Revenue (billion) Forecast, by Application 2020 & 2033
- Table 100: ASEAN Coal Industry Australia Volume (Kiloton) Forecast, by Application 2020 & 2033
- Table 101: Oceania Coal Industry Australia Revenue (billion) Forecast, by Application 2020 & 2033
- Table 102: Oceania Coal Industry Australia Volume (Kiloton) Forecast, by Application 2020 & 2033
- Table 103: Rest of Asia Pacific Coal Industry Australia Revenue (billion) Forecast, by Application 2020 & 2033
- Table 104: Rest of Asia Pacific Coal Industry Australia Volume (Kiloton) Forecast, by Application 2020 & 2033
Frequently Asked Questions
1. What is the projected Compound Annual Growth Rate (CAGR) of the Coal Industry Australia?
The projected CAGR is approximately 2.2%.
2. Which companies are prominent players in the Coal Industry Australia?
Key companies in the market include Peabody Energy Corporation, HardRock Coal Mining Pty Ltd, Bloomfield Collieries Pty Ltd, Yancoal Australia Ltd, Whitehaven Coal Limited*List Not Exhaustive, Idemitsu Australia Resources Pty Ltd, Jellinbah Group Pty Ltd, BHP Group Ltd, Centennial Coal Company Ltd, Vale S A.
3. What are the main segments of the Coal Industry Australia?
The market segments include Electricity, Iron and Steel, Other Applications.
4. Can you provide details about the market size?
The market size is estimated to be USD 57 billion as of 2022.
5. What are some drivers contributing to market growth?
4.; Increase in Prices of Electricity Procured from Conventional Mechanisms 4.; Decline in Cost of Solar Energy Infrastructure.
6. What are the notable trends driving market growth?
Demand for Bituminous Coal to Drive the Market.
7. Are there any restraints impacting market growth?
4.; Competition from Other Alternative Energy Sources.
8. Can you provide examples of recent developments in the market?
September 2022: AGL Energy announced the company's coal-fired Loy Yang A power station in Victoria will close in 2035.
9. What pricing options are available for accessing the report?
Pricing options include single-user, multi-user, and enterprise licenses priced at USD 3800, USD 4500, and USD 5800 respectively.
10. Is the market size provided in terms of value or volume?
The market size is provided in terms of value, measured in billion and volume, measured in Kiloton.
11. Are there any specific market keywords associated with the report?
Yes, the market keyword associated with the report is "Coal Industry Australia," which aids in identifying and referencing the specific market segment covered.
12. How do I determine which pricing option suits my needs best?
The pricing options vary based on user requirements and access needs. Individual users may opt for single-user licenses, while businesses requiring broader access may choose multi-user or enterprise licenses for cost-effective access to the report.
13. Are there any additional resources or data provided in the Coal Industry Australia report?
While the report offers comprehensive insights, it's advisable to review the specific contents or supplementary materials provided to ascertain if additional resources or data are available.
14. How can I stay updated on further developments or reports in the Coal Industry Australia?
To stay informed about further developments, trends, and reports in the Coal Industry Australia, consider subscribing to industry newsletters, following relevant companies and organizations, or regularly checking reputable industry news sources and publications.
Methodology
Step 1 - Identification of Relevant Samples Size from Population Database


Step 2 - Approaches for Defining Global Market Size (Value, Volume* & Price*)

Note*: In applicable scenarios
Step 3 - Data Sources
Primary Research
- Web Analytics
- Survey Reports
- Research Institute
- Latest Research Reports
- Opinion Leaders
Secondary Research
- Annual Reports
- White Paper
- Latest Press Release
- Industry Association
- Paid Database
- Investor Presentations

Step 4 - Data Triangulation
Involves using different sources of information in order to increase the validity of a study
These sources are likely to be stakeholders in a program - participants, other researchers, program staff, other community members, and so on.
Then we put all data in single framework & apply various statistical tools to find out the dynamic on the market.
During the analysis stage, feedback from the stakeholder groups would be compared to determine areas of agreement as well as areas of divergence