

Key Insights
The East Africa Petroleum Product Industry is projected for substantial growth, with an estimated market size of $10.3 billion by 2023 and a Compound Annual Growth Rate (CAGR) of 2.3% from 2023 to 2033. This expansion is driven by increasing regional energy demand from industrialization, urbanization, and a rising middle class. Infrastructure development, including new transportation and energy projects, fuels demand for petroleum products. The growing transportation sector, coupled with government efforts to enhance energy security, further stimulates market activity. Evolving downstream investments and trade dynamics are shaping the industry's landscape.
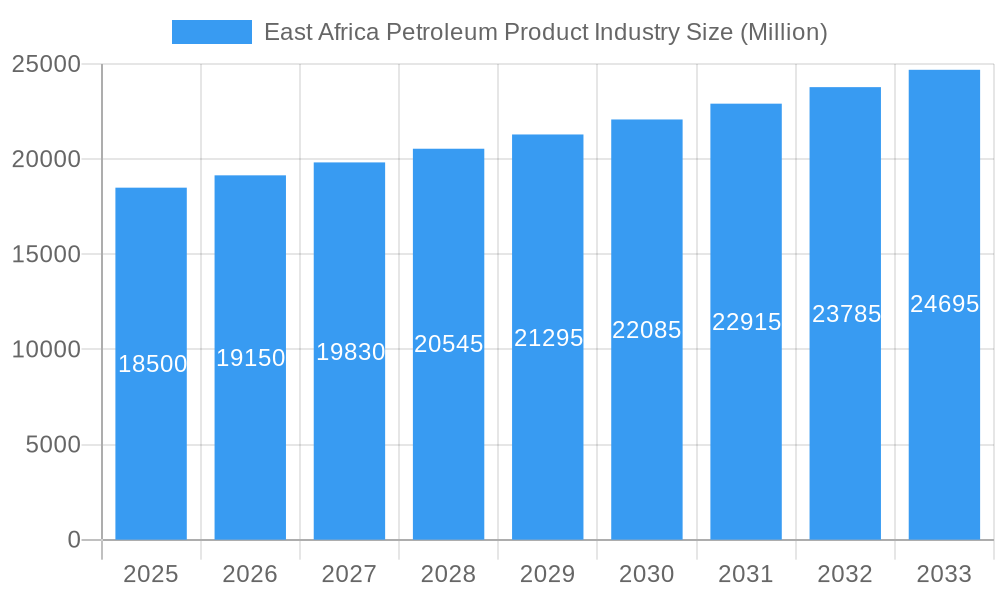
East Africa Petroleum Product Industry Market Size (In Billion)
Challenges for the East Africa Petroleum Product Industry include volatile global crude oil prices, geopolitical risks, and evolving regulations. Dependence on imported refined products also presents supply chain and currency risks. The industry is responding with investments in refining capacity, alternative energy development, and improved distribution. A focus on cleaner fuels and stricter environmental standards is influencing production and demand. Middle distillates are expected to see strong demand from transportation and industrial sectors. Companies are optimizing supply chains and expanding retail presence to capture market opportunities.
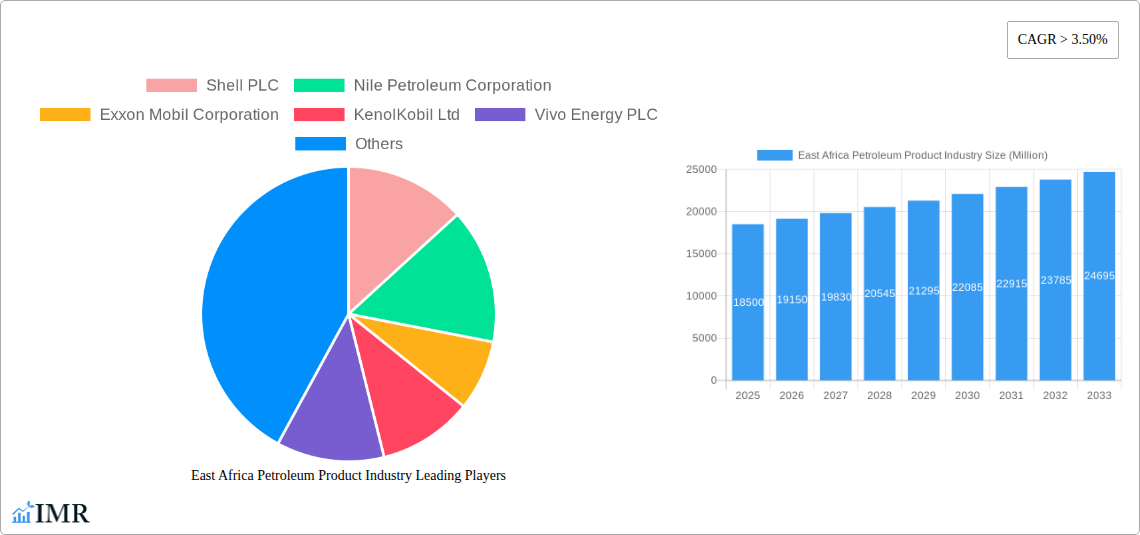
East Africa Petroleum Product Industry Company Market Share
East Africa Petroleum Product Industry: Market Analysis and Future Projections (2023-2033)
This comprehensive report analyzes the East Africa Petroleum Product Industry, providing critical insights into market dynamics, growth trajectories, regional leadership, and future opportunities. Covering the period from 2023 to 2033, with a base year of 2023, this research is vital for stakeholders navigating the evolving petroleum sector in East Africa.
East Africa Petroleum Product Industry Market Dynamics & Structure
The East Africa Petroleum Product Industry is characterized by a moderately concentrated market, with key players like Shell PLC, Nile Petroleum Corporation, Exxon Mobil Corporation, KenolKobil Ltd, Vivo Energy PLC, TotalEnergies SE, and National Oil Ethiopia PLC holding significant influence. Technological innovation is primarily driven by advancements in refining efficiency, exploration techniques, and the integration of digital solutions for supply chain management and customer service. The regulatory framework across East African nations is a crucial determinant of market operations, with evolving policies on fuel standards, environmental regulations, and import/export duties impacting business strategies. Competitive product substitutes are emerging, particularly in the renewable energy sector, though petroleum products continue to dominate due to established infrastructure and cost-effectiveness for core applications. End-user demographics are shifting, with a growing middle class in urban centers driving demand for transportation fuels and industrial products, while rural areas rely on traditional fuels. Mergers and acquisitions (M&A) trends indicate a consolidation phase, with larger entities acquiring smaller players to enhance market share and operational synergies. For instance, the historical period saw xx M&A deals with a total transaction value of $xxx Million. Innovation barriers include high capital investment requirements for new technologies and the challenges associated with navigating diverse regulatory environments across the region.
- Market Concentration: Moderate, with major international and national oil companies dominating.
- Technological Drivers: Refining efficiency, exploration tech, digital supply chain, customer service integration.
- Regulatory Impact: Fuel standards, environmental regulations, import/export policies, and taxation.
- Substitute Products: Growing presence of renewables, but petroleum remains dominant in the short to medium term.
- End-User Demographics: Rising middle class in urban areas, industrial growth, and persistent rural demand.
- M&A Trends: Consolidation, strategic acquisitions for market share and synergies.
- Innovation Barriers: High capital expenditure, complex regulatory landscapes.
East Africa Petroleum Product Industry Growth Trends & Insights
The East Africa Petroleum Product Industry is poised for significant growth, driven by robust economic expansion and increasing energy demands across the continent. Market size is projected to evolve substantially, with an estimated market value of $xx Billion by 2025 and a Compound Annual Growth Rate (CAGR) of xx% anticipated throughout the forecast period (2025-2033). Adoption rates for refined petroleum products remain high, underpinned by widespread infrastructure for distribution and consumption, though a gradual shift towards cleaner energy alternatives is observed in the long term. Technological disruptions are primarily focused on improving the efficiency and environmental performance of existing refining processes and the development of advanced fuel formulations. Consumer behavior shifts are evident, with a growing awareness of fuel efficiency and environmental impact influencing purchasing decisions, particularly among fleet operators and higher-income households. The market penetration of certain refined products, such as gasoline and diesel, remains deep due to their essential role in transportation and industry. The historical period (2019-2024) witnessed a market size evolution from $xx Billion to $xx Billion, demonstrating steady upward momentum. The base year of 2025 estimates the market size at $xx Billion, with key segments like Middle Distillates holding a dominant share. The study period, encompassing 2019-2033, highlights the long-term strategic importance of petroleum products while acknowledging the evolving energy transition landscape. Insights from the estimated year of 2025 indicate strong demand for gasoline and diesel, fueled by infrastructure development and a growing automotive sector. The growth trajectory is further supported by increasing industrialization across key economies.
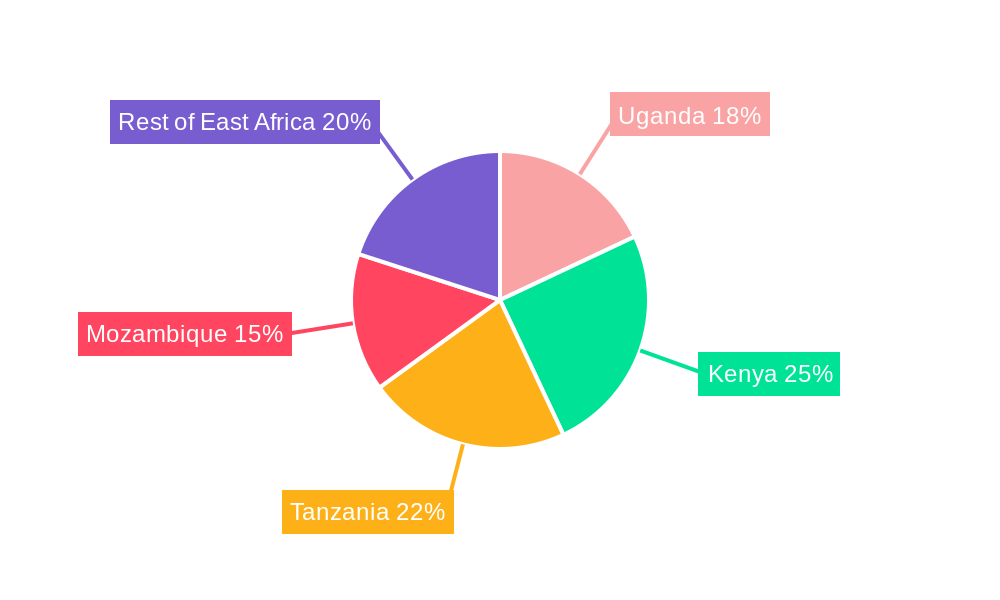
Dominant Regions, Countries, or Segments in East Africa Petroleum Product Industry
Kenya and Tanzania are emerging as dominant forces within the East Africa Petroleum Product Industry, driven by their strategic geographic locations, robust economic policies, and significant infrastructure development. Kenya, with its well-established port facilities in Mombasa and a relatively advanced refining capacity, acts as a crucial hub for the distribution of petroleum products across the region. The country’s diversified economy, with strong contributions from agriculture, manufacturing, and services, creates a consistent demand for various fuel types. Tanzania, similarly, benefits from its strategic coastline and is actively investing in its energy infrastructure, including oil and gas exploration and pipeline projects, further bolstering its position.
Among the product segments, Middle Distillates are currently the most dominant, encompassing diesel fuel and jet fuel, which are critical for the region's transportation sector (both road and air) and industrial machinery. The increasing mechanization of agriculture, expanding manufacturing capabilities, and the burgeoning logistics and transport industries are primary drivers for the sustained high demand for diesel. Additionally, the growth in air travel, fueled by tourism and business connectivity, directly impacts the consumption of jet fuel.
- Key Drivers in Kenya & Tanzania:
- Strategic Geographic Location: Access to ports and well-positioned for regional distribution.
- Economic Policies: Favorable investment climates and support for infrastructure development.
- Infrastructure Investment: Expansion of port facilities, refineries, pipelines, and road networks.
- Industrial Growth: Increasing manufacturing, mining, and construction activities.
- Urbanization & Population Growth: Leading to higher demand for transportation and energy.
- Dominant Segment - Middle Distillates:
- Diesel Fuel: Critical for transportation (trucking, buses), agriculture (machinery), and industrial power generation.
- Jet Fuel: Driven by the growth in air travel for tourism and business.
- Market Share: Middle distillates are estimated to hold over xx% of the total market share in 2025.
- Growth Potential: Continual demand expected due to ongoing economic development and infrastructure projects.
- Rest of East Africa: While Uganda, Rwanda, Burundi, and South Sudan are growing markets, their demand is often met through imports facilitated by Kenya and Tanzania, underscoring the dominance of these two countries in the regional supply chain. Mozambique, with its significant offshore natural gas discoveries, presents a different energy landscape but still relies on petroleum products for a substantial portion of its transportation and industrial needs, though its growth is increasingly tied to its gas sector.
East Africa Petroleum Product Industry Product Landscape
The product landscape within the East Africa Petroleum Product Industry is characterized by a spectrum of refined fuels tailored to diverse applications. Light Distillates, including gasoline (petrol) and naphtha, are crucial for the growing automotive sector and as feedstock for petrochemical industries. Middle Distillates, such as diesel and jet fuel, are indispensable for transportation, powering the region's vast trucking industry, agricultural machinery, and burgeoning aviation sector. Heavy Distillates, including fuel oil and bitumen, serve critical roles in industrial power generation, shipping, and road construction. Product innovations focus on enhancing fuel efficiency, reducing emissions, and meeting evolving international quality standards, such as Euro V. The unique selling proposition of these products lies in their availability and established distribution networks, making them the primary energy source for many economies in the region. Technological advancements are aimed at improving refinery yields and developing cleaner-burning formulations.
Key Drivers, Barriers & Challenges in East Africa Petroleum Product Industry
Key Drivers: The East Africa Petroleum Product Industry is propelled by robust economic growth across the region, leading to increased demand for transportation fuels and industrial energy. Infrastructure development projects, including roads, ports, and power plants, directly boost consumption of diesel and fuel oil. A growing middle class with rising disposable incomes fuels automotive sales and, consequently, gasoline demand. Furthermore, the vast undeveloped oil and gas reserves in countries like Uganda and exploration activities in other nations indicate future supply potential and investment interest. Technological advancements in refining efficiency and product formulation also contribute to market competitiveness.
Barriers & Challenges: Significant challenges include price volatility of crude oil in the international market, which impacts the cost of imported refined products. Regulatory inconsistencies and bureaucratic hurdles across different East African countries can hinder cross-border trade and investment. The transition towards cleaner energy sources and electric mobility poses a long-term threat to demand for traditional petroleum products. Supply chain disruptions, due to logistical complexities and occasional political instability, can impact product availability and prices. Competition from informal markets and the high cost of establishing modern refining facilities also present barriers.
Emerging Opportunities in East Africa Petroleum Product Industry
Emerging opportunities in the East Africa Petroleum Product Industry lie in capitalizing on the region's burgeoning demand for specialized fuels and lubricants driven by industrial expansion and a growing automotive fleet. There is significant untapped potential in the development of value-added petrochemical products derived from naphtha. Furthermore, the increasing focus on cleaner fuels presents an opportunity for the introduction of advanced, lower-sulfur diesel and gasoline formulations, as well as the exploration of cleaner burning heavy fuel oils. The expansion of aviation and logistics sectors will continue to drive demand for jet fuel and specialized lubricants. Investment in modernizing existing refining capacities and developing new distribution networks to reach underserved rural populations also presents lucrative avenues.
Growth Accelerators in the East Africa Petroleum Product Industry Industry
Growth accelerators in the East Africa Petroleum Product Industry include ongoing large-scale infrastructure projects across key nations like Kenya, Tanzania, and Uganda, which significantly increase the demand for diesel and heavy fuel oils. The exploration and potential production of crude oil in countries like Uganda and Mozambique are poised to transform the regional supply dynamics, potentially leading to increased local refining capacity and reduced import reliance. Government policies aimed at promoting industrialization and manufacturing will further stimulate demand for petroleum-based feedstocks and energy. Strategic partnerships between international oil companies and local entities are crucial for leveraging expertise and capital for large-scale projects and market penetration.
Key Players Shaping the East Africa Petroleum Product Industry Market
- Shell PLC
- Nile Petroleum Corporation
- Exxon Mobil Corporation
- KenolKobil Ltd
- Vivo Energy PLC
- TotalEnergies SE
- National Oil Ethiopia PLC
Notable Milestones in East Africa Petroleum Product Industry Sector
- 2019: Vivo Energy PLC's expansion into new markets, enhancing distribution networks.
- 2020: TotalEnergies SE's significant investments in downstream infrastructure and retail networks.
- 2021: Discovery of significant crude oil reserves in Uganda, boosting future production potential.
- 2022: Shell PLC's focus on cleaner fuel initiatives and enhanced product offerings in key markets.
- 2023: National Oil Ethiopia PLC's strategic partnerships to improve fuel import and distribution efficiency.
- 2024: Exxon Mobil Corporation's continued exploration activities and potential for future upstream contributions.
- 2025 (Estimated): Increased regional collaboration on fuel standards and cross-border trade agreements.
In-Depth East Africa Petroleum Product Industry Market Outlook
The future market outlook for the East Africa Petroleum Product Industry remains robust, underpinned by sustained economic development and a growing population. While the global energy transition presents long-term considerations, the immediate to medium-term demand for petroleum products, particularly light and middle distillates, is projected to remain strong. Strategic opportunities lie in enhancing refining capabilities to meet regional demand and diversify product offerings, as well as investing in advanced logistical networks to improve supply chain efficiency. Growth accelerators such as infrastructure expansion and industrialization will continue to fuel demand, while emerging opportunities in cleaner fuel technologies and petrochemicals will shape the industry's evolution. Stakeholders are advised to focus on innovation, strategic partnerships, and navigating the evolving regulatory landscape to capitalize on the significant potential within this dynamic market.
East Africa Petroleum Product Industry Segmentation
-
1. Type
- 1.1. Light Distillates
- 1.2. Middle Distillates
- 1.3. Heavy Distillates
-
2. Geography
- 2.1. Uganda
- 2.2. Kenya
- 2.3. Tanzania
- 2.4. Mozambique
- 2.5. Rest of East Africa
East Africa Petroleum Product Industry Segmentation By Geography
- 1. Uganda
- 2. Kenya
- 3. Tanzania
- 4. Mozambique
- 5. Rest of East Africa
East Africa Petroleum Product Industry Regional Market Share
Geographic Coverage of East Africa Petroleum Product Industry
East Africa Petroleum Product Industry REPORT HIGHLIGHTS
| Aspects | Details |
|---|---|
| Study Period | 2020-2034 |
| Base Year | 2025 |
| Estimated Year | 2026 |
| Forecast Period | 2026-2034 |
| Historical Period | 2020-2025 |
| Growth Rate | CAGR of 2.3% from 2020-2034 |
| Segmentation |
|
Table of Contents
- 1. Introduction
- 1.1. Research Scope
- 1.2. Market Segmentation
- 1.3. Research Objective
- 1.4. Definitions and Assumptions
- 2. Executive Summary
- 2.1. Market Snapshot
- 3. Market Dynamics
- 3.1. Market Drivers
- 3.2. Market Restrains
- 3.3. Market Trends
- 3.4. Market Opportunities
- 4. Market Factor Analysis
- 4.1. Porters Five Forces
- 4.1.1. Bargaining Power of Suppliers
- 4.1.2. Bargaining Power of Buyers
- 4.1.3. Threat of New Entrants
- 4.1.4. Threat of Substitutes
- 4.1.5. Competitive Rivalry
- 4.2. PESTEL analysis
- 4.3. BCG Analysis
- 4.3.1. Stars (High Growth, High Market Share)
- 4.3.2. Cash Cows (Low Growth, High Market Share)
- 4.3.3. Question Mark (High Growth, Low Market Share)
- 4.3.4. Dogs (Low Growth, Low Market Share)
- 4.4. Ansoff Matrix Analysis
- 4.5. Supply Chain Analysis
- 4.6. Regulatory Landscape
- 4.7. Current Market Potential and Opportunity Assessment (TAM–SAM–SOM Framework)
- 4.8. IMR Analyst Note
- 4.1. Porters Five Forces
- 5. Market Analysis, Insights and Forecast 2021-2033
- 5.1. Market Analysis, Insights and Forecast - by Type
- 5.1.1. Light Distillates
- 5.1.2. Middle Distillates
- 5.1.3. Heavy Distillates
- 5.2. Market Analysis, Insights and Forecast - by Geography
- 5.2.1. Uganda
- 5.2.2. Kenya
- 5.2.3. Tanzania
- 5.2.4. Mozambique
- 5.2.5. Rest of East Africa
- 5.3. Market Analysis, Insights and Forecast - by Region
- 5.3.1. Uganda
- 5.3.2. Kenya
- 5.3.3. Tanzania
- 5.3.4. Mozambique
- 5.3.5. Rest of East Africa
- 5.1. Market Analysis, Insights and Forecast - by Type
- 6. East Africa Petroleum Product Industry Analysis, Insights and Forecast, 2021-2033
- 6.1. Market Analysis, Insights and Forecast - by Type
- 6.1.1. Light Distillates
- 6.1.2. Middle Distillates
- 6.1.3. Heavy Distillates
- 6.2. Market Analysis, Insights and Forecast - by Geography
- 6.2.1. Uganda
- 6.2.2. Kenya
- 6.2.3. Tanzania
- 6.2.4. Mozambique
- 6.2.5. Rest of East Africa
- 6.1. Market Analysis, Insights and Forecast - by Type
- 7. Uganda East Africa Petroleum Product Industry Analysis, Insights and Forecast, 2020-2032
- 7.1. Market Analysis, Insights and Forecast - by Type
- 7.1.1. Light Distillates
- 7.1.2. Middle Distillates
- 7.1.3. Heavy Distillates
- 7.2. Market Analysis, Insights and Forecast - by Geography
- 7.2.1. Uganda
- 7.2.2. Kenya
- 7.2.3. Tanzania
- 7.2.4. Mozambique
- 7.2.5. Rest of East Africa
- 7.1. Market Analysis, Insights and Forecast - by Type
- 8. Kenya East Africa Petroleum Product Industry Analysis, Insights and Forecast, 2020-2032
- 8.1. Market Analysis, Insights and Forecast - by Type
- 8.1.1. Light Distillates
- 8.1.2. Middle Distillates
- 8.1.3. Heavy Distillates
- 8.2. Market Analysis, Insights and Forecast - by Geography
- 8.2.1. Uganda
- 8.2.2. Kenya
- 8.2.3. Tanzania
- 8.2.4. Mozambique
- 8.2.5. Rest of East Africa
- 8.1. Market Analysis, Insights and Forecast - by Type
- 9. Tanzania East Africa Petroleum Product Industry Analysis, Insights and Forecast, 2020-2032
- 9.1. Market Analysis, Insights and Forecast - by Type
- 9.1.1. Light Distillates
- 9.1.2. Middle Distillates
- 9.1.3. Heavy Distillates
- 9.2. Market Analysis, Insights and Forecast - by Geography
- 9.2.1. Uganda
- 9.2.2. Kenya
- 9.2.3. Tanzania
- 9.2.4. Mozambique
- 9.2.5. Rest of East Africa
- 9.1. Market Analysis, Insights and Forecast - by Type
- 10. Mozambique East Africa Petroleum Product Industry Analysis, Insights and Forecast, 2020-2032
- 10.1. Market Analysis, Insights and Forecast - by Type
- 10.1.1. Light Distillates
- 10.1.2. Middle Distillates
- 10.1.3. Heavy Distillates
- 10.2. Market Analysis, Insights and Forecast - by Geography
- 10.2.1. Uganda
- 10.2.2. Kenya
- 10.2.3. Tanzania
- 10.2.4. Mozambique
- 10.2.5. Rest of East Africa
- 10.1. Market Analysis, Insights and Forecast - by Type
- 11. Rest of East Africa East Africa Petroleum Product Industry Analysis, Insights and Forecast, 2020-2032
- 11.1. Market Analysis, Insights and Forecast - by Type
- 11.1.1. Light Distillates
- 11.1.2. Middle Distillates
- 11.1.3. Heavy Distillates
- 11.2. Market Analysis, Insights and Forecast - by Geography
- 11.2.1. Uganda
- 11.2.2. Kenya
- 11.2.3. Tanzania
- 11.2.4. Mozambique
- 11.2.5. Rest of East Africa
- 11.1. Market Analysis, Insights and Forecast - by Type
- 12. Competitive Analysis
- 12.1. Company Profiles
- 12.1.1 Shell PLC
- 12.1.1.1. Company Overview
- 12.1.1.2. Products
- 12.1.1.3. Company Financials
- 12.1.1.4. SWOT Analysis
- 12.1.2 Nile Petroleum Corporation
- 12.1.2.1. Company Overview
- 12.1.2.2. Products
- 12.1.2.3. Company Financials
- 12.1.2.4. SWOT Analysis
- 12.1.3 Exxon Mobil Corporation
- 12.1.3.1. Company Overview
- 12.1.3.2. Products
- 12.1.3.3. Company Financials
- 12.1.3.4. SWOT Analysis
- 12.1.4 KenolKobil Ltd
- 12.1.4.1. Company Overview
- 12.1.4.2. Products
- 12.1.4.3. Company Financials
- 12.1.4.4. SWOT Analysis
- 12.1.5 Vivo Energy PLC
- 12.1.5.1. Company Overview
- 12.1.5.2. Products
- 12.1.5.3. Company Financials
- 12.1.5.4. SWOT Analysis
- 12.1.6 TotalEnergies SE
- 12.1.6.1. Company Overview
- 12.1.6.2. Products
- 12.1.6.3. Company Financials
- 12.1.6.4. SWOT Analysis
- 12.1.7 National Oil Ethiopia PLC
- 12.1.7.1. Company Overview
- 12.1.7.2. Products
- 12.1.7.3. Company Financials
- 12.1.7.4. SWOT Analysis
- 12.1.1 Shell PLC
- 12.2. Market Entropy
- 12.2.1 Company's Key Areas Served
- 12.2.2 Recent Developments
- 12.3. Company Market Share Analysis 2025
- 12.3.1 Top 5 Companies Market Share Analysis
- 12.3.2 Top 3 Companies Market Share Analysis
- 12.4. List of Potential Customers
- 13. Research Methodology
List of Figures
- Figure 1: East Africa Petroleum Product Industry Revenue Breakdown (billion, %) by Product 2025 & 2033
- Figure 2: East Africa Petroleum Product Industry Share (%) by Company 2025
List of Tables
- Table 1: East Africa Petroleum Product Industry Revenue billion Forecast, by Type 2020 & 2033
- Table 2: East Africa Petroleum Product Industry Volume K Unit Forecast, by Type 2020 & 2033
- Table 3: East Africa Petroleum Product Industry Revenue billion Forecast, by Geography 2020 & 2033
- Table 4: East Africa Petroleum Product Industry Volume K Unit Forecast, by Geography 2020 & 2033
- Table 5: East Africa Petroleum Product Industry Revenue billion Forecast, by Region 2020 & 2033
- Table 6: East Africa Petroleum Product Industry Volume K Unit Forecast, by Region 2020 & 2033
- Table 7: East Africa Petroleum Product Industry Revenue billion Forecast, by Type 2020 & 2033
- Table 8: East Africa Petroleum Product Industry Volume K Unit Forecast, by Type 2020 & 2033
- Table 9: East Africa Petroleum Product Industry Revenue billion Forecast, by Geography 2020 & 2033
- Table 10: East Africa Petroleum Product Industry Volume K Unit Forecast, by Geography 2020 & 2033
- Table 11: East Africa Petroleum Product Industry Revenue billion Forecast, by Country 2020 & 2033
- Table 12: East Africa Petroleum Product Industry Volume K Unit Forecast, by Country 2020 & 2033
- Table 13: East Africa Petroleum Product Industry Revenue billion Forecast, by Type 2020 & 2033
- Table 14: East Africa Petroleum Product Industry Volume K Unit Forecast, by Type 2020 & 2033
- Table 15: East Africa Petroleum Product Industry Revenue billion Forecast, by Geography 2020 & 2033
- Table 16: East Africa Petroleum Product Industry Volume K Unit Forecast, by Geography 2020 & 2033
- Table 17: East Africa Petroleum Product Industry Revenue billion Forecast, by Country 2020 & 2033
- Table 18: East Africa Petroleum Product Industry Volume K Unit Forecast, by Country 2020 & 2033
- Table 19: East Africa Petroleum Product Industry Revenue billion Forecast, by Type 2020 & 2033
- Table 20: East Africa Petroleum Product Industry Volume K Unit Forecast, by Type 2020 & 2033
- Table 21: East Africa Petroleum Product Industry Revenue billion Forecast, by Geography 2020 & 2033
- Table 22: East Africa Petroleum Product Industry Volume K Unit Forecast, by Geography 2020 & 2033
- Table 23: East Africa Petroleum Product Industry Revenue billion Forecast, by Country 2020 & 2033
- Table 24: East Africa Petroleum Product Industry Volume K Unit Forecast, by Country 2020 & 2033
- Table 25: East Africa Petroleum Product Industry Revenue billion Forecast, by Type 2020 & 2033
- Table 26: East Africa Petroleum Product Industry Volume K Unit Forecast, by Type 2020 & 2033
- Table 27: East Africa Petroleum Product Industry Revenue billion Forecast, by Geography 2020 & 2033
- Table 28: East Africa Petroleum Product Industry Volume K Unit Forecast, by Geography 2020 & 2033
- Table 29: East Africa Petroleum Product Industry Revenue billion Forecast, by Country 2020 & 2033
- Table 30: East Africa Petroleum Product Industry Volume K Unit Forecast, by Country 2020 & 2033
- Table 31: East Africa Petroleum Product Industry Revenue billion Forecast, by Type 2020 & 2033
- Table 32: East Africa Petroleum Product Industry Volume K Unit Forecast, by Type 2020 & 2033
- Table 33: East Africa Petroleum Product Industry Revenue billion Forecast, by Geography 2020 & 2033
- Table 34: East Africa Petroleum Product Industry Volume K Unit Forecast, by Geography 2020 & 2033
- Table 35: East Africa Petroleum Product Industry Revenue billion Forecast, by Country 2020 & 2033
- Table 36: East Africa Petroleum Product Industry Volume K Unit Forecast, by Country 2020 & 2033
Frequently Asked Questions
1. What is the projected Compound Annual Growth Rate (CAGR) of the East Africa Petroleum Product Industry?
The projected CAGR is approximately 2.3%.
2. Which companies are prominent players in the East Africa Petroleum Product Industry?
Key companies in the market include Shell PLC, Nile Petroleum Corporation, Exxon Mobil Corporation, KenolKobil Ltd, Vivo Energy PLC, TotalEnergies SE, National Oil Ethiopia PLC.
3. What are the main segments of the East Africa Petroleum Product Industry?
The market segments include Type, Geography.
4. Can you provide details about the market size?
The market size is estimated to be USD 10.3 billion as of 2022.
5. What are some drivers contributing to market growth?
4.; Abundant Oil and Gas Reserves4.; Favorable Investment in Upstream Sector.
6. What are the notable trends driving market growth?
Middle Distillates to Dominate the Market.
7. Are there any restraints impacting market growth?
4.; Volatility of Crude Oil Prices.
8. Can you provide examples of recent developments in the market?
N/A
9. What pricing options are available for accessing the report?
Pricing options include single-user, multi-user, and enterprise licenses priced at USD 4750, USD 5250, and USD 8750 respectively.
10. Is the market size provided in terms of value or volume?
The market size is provided in terms of value, measured in billion and volume, measured in K Unit.
11. Are there any specific market keywords associated with the report?
Yes, the market keyword associated with the report is "East Africa Petroleum Product Industry," which aids in identifying and referencing the specific market segment covered.
12. How do I determine which pricing option suits my needs best?
The pricing options vary based on user requirements and access needs. Individual users may opt for single-user licenses, while businesses requiring broader access may choose multi-user or enterprise licenses for cost-effective access to the report.
13. Are there any additional resources or data provided in the East Africa Petroleum Product Industry report?
While the report offers comprehensive insights, it's advisable to review the specific contents or supplementary materials provided to ascertain if additional resources or data are available.
14. How can I stay updated on further developments or reports in the East Africa Petroleum Product Industry?
To stay informed about further developments, trends, and reports in the East Africa Petroleum Product Industry, consider subscribing to industry newsletters, following relevant companies and organizations, or regularly checking reputable industry news sources and publications.
Methodology
Step 1 - Identification of Relevant Samples Size from Population Database


Step 2 - Approaches for Defining Global Market Size (Value, Volume* & Price*)

Note*: In applicable scenarios
Step 3 - Data Sources
Primary Research
- Web Analytics
- Survey Reports
- Research Institute
- Latest Research Reports
- Opinion Leaders
Secondary Research
- Annual Reports
- White Paper
- Latest Press Release
- Industry Association
- Paid Database
- Investor Presentations

Step 4 - Data Triangulation
Involves using different sources of information in order to increase the validity of a study
These sources are likely to be stakeholders in a program - participants, other researchers, program staff, other community members, and so on.
Then we put all data in single framework & apply various statistical tools to find out the dynamic on the market.
During the analysis stage, feedback from the stakeholder groups would be compared to determine areas of agreement as well as areas of divergence