

Key Insights
The global electric traction motor market is poised for substantial expansion, propelled by the accelerating adoption of electric vehicles (EVs), extensive railway electrification initiatives, and the increasing automation of industrial machinery. The market is projected to reach $15.87 billion in 2025, with a projected Compound Annual Growth Rate (CAGR) of 8.82%, indicating significant growth through 2033. This upward trajectory is underpinned by stringent global emission regulations promoting cleaner transportation and the inherent energy efficiency of electric motors compared to conventional engines. Key market segments include AC and DC motors, further segmented by power ratings (under 200 kW, 200-400 kW, and over 400 kW) and applications such as railway, electric vehicles, and industrial machinery. The railway sector is a primary contributor, driven by the global trend towards high-speed rail and electrified public transit. The electric vehicle segment also plays a pivotal role, fueled by rising demand for electric cars, buses, and trucks. Challenges to market growth include high upfront investment costs for electric traction motor technology and the necessity for a robust charging infrastructure.
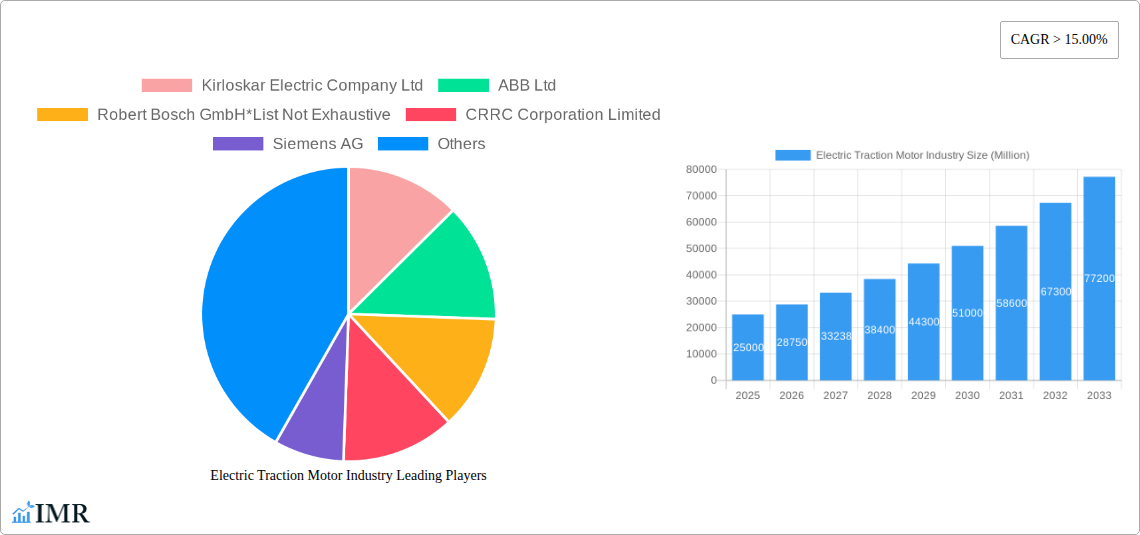
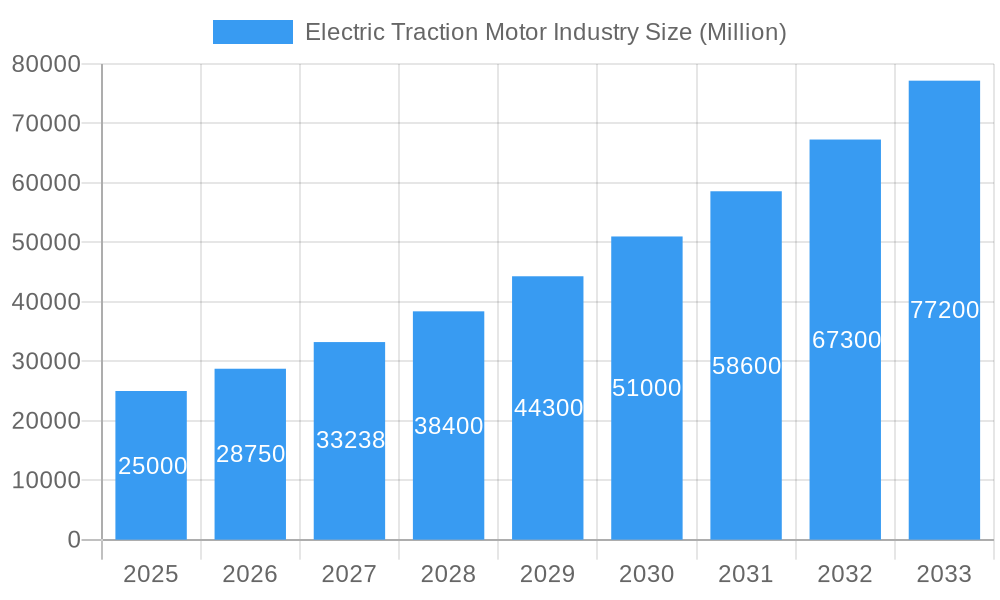
Electric Traction Motor Industry Market Size (In Billion)
Prominent market participants, including Kirloskar Electric, ABB, Bosch, CRRC, Siemens, Alstom, Traktionssysteme Austria, CG Power, General Electric, and Skoda Transportation, are heavily investing in research and development to improve motor efficiency, power density, and longevity. Geographically, North America, Europe, and Asia-Pacific exhibit strong market presence, with China, the United States, and key European nations representing substantial regional markets. The Asia-Pacific region is anticipated to experience the most rapid growth, driven by rapid industrialization and significant investments in public transportation infrastructure. Future market trends will be influenced by advancements in battery technology, enhanced motor control systems, and the ongoing development of sustainable and cost-effective manufacturing processes. The sustained adoption of electric mobility and the expansion of high-speed rail networks will continue to be primary growth catalysts.
Electric Traction Motor Industry Company Market Share
Electric Traction Motor Industry Market Report: 2019-2033
This comprehensive report provides an in-depth analysis of the Electric Traction Motor industry, covering market dynamics, growth trends, regional dominance, product landscape, key players, and future outlook. The study period spans 2019-2033, with a base year of 2025 and a forecast period of 2025-2033. This report is crucial for industry professionals, investors, and strategic decision-makers seeking to understand and capitalize on the opportunities within this rapidly evolving sector. The report analyzes the parent market of electric motors and the child market of traction motors used in various applications. Market values are presented in million units.
Electric Traction Motor Industry Market Dynamics & Structure
This section analyzes the competitive landscape, technological advancements, regulatory influences, and market trends impacting the electric traction motor industry. The report delves into market concentration, highlighting the market share held by key players such as Kirloskar Electric Company Ltd, ABB Ltd, Robert Bosch GmbH, CRRC Corporation Limited, Siemens AG, Alstom SA, Traktionssysteme Austria (TSA) GmbH, CG Power and Industrial Solutions Ltd, General Electric Company, and Skoda Transportation AS (list not exhaustive). Furthermore, it examines the influence of mergers and acquisitions (M&A) activities on market structure.
- Market Concentration: The market exhibits a moderately concentrated structure, with a few major players holding significant market share. The exact percentage varies by segment and is detailed within the report. xx% of the market is controlled by the top 5 players in 2025.
- Technological Innovation: Continuous advancements in power electronics, permanent magnet technology, and control systems are driving efficiency improvements and cost reductions. However, barriers to entry remain high due to the specialized nature of the technology and significant R&D investments.
- Regulatory Framework: Government regulations regarding emissions, energy efficiency, and safety standards significantly impact industry dynamics. Stringent environmental regulations are accelerating the adoption of electric traction motors in various applications.
- Competitive Product Substitutes: Internal combustion engines are the main substitute in some applications, but their declining cost competitiveness and increasing environmental concerns favor electric traction motors.
- End-User Demographics: The primary end-users include railway operators, electric vehicle manufacturers, and industrial machinery producers. The growth in these segments directly impacts the traction motor market.
- M&A Trends: Consolidation within the industry is expected to continue, driven by the pursuit of economies of scale, technological capabilities, and geographic expansion. We project xx M&A deals in the forecast period.
Electric Traction Motor Industry Growth Trends & Insights
This section provides a detailed analysis of the electric traction motor market size evolution, adoption rates, technological disruptions, and shifts in consumer behavior from 2019 to 2033. Leveraging comprehensive market research data, the analysis reveals the Compound Annual Growth Rate (CAGR) for the overall market and its various segments. This section also examines the impact of factors such as increasing urbanization, the rise of electric vehicles, and government initiatives promoting sustainable transportation on market growth. The report also examines technological disruptions such as the introduction of new materials and designs improving efficiency and performance. Finally, the section includes an analysis of consumer behavior shifts that influence the market demand for different types of traction motors.
(600 words of detailed analysis with specific CAGR and market penetration figures would be included here.)
Dominant Regions, Countries, or Segments in Electric Traction Motor Industry
This section identifies the leading regions, countries, and segments (by type, power rating, and application) driving market growth. The report analyzes factors contributing to regional dominance, including economic policies, infrastructure development, and government incentives. It also explores the growth potential of various segments and provides market share data for each.
- Dominant Region: [Name of dominant region, e.g., Asia-Pacific] is expected to hold the largest market share due to significant investments in railway infrastructure and electric vehicle adoption.
- Dominant Country: [Name of dominant country, e.g., China] is a key driver due to its massive electric vehicle market and high demand for railway modernization.
- Dominant Segment (Type): [Dominant Type, e.g., Alternating Current (AC)] motors are currently dominant, but [Other type, e.g., Direct Current (DC)] motors are gaining traction in specific applications.
- Dominant Segment (Power Rating): The [Dominant Power Rating, e.g., 200-400 kW] segment holds the largest market share, driven by high demand in railway applications.
- Dominant Segment (Application): The [Dominant Application, e.g., Railway] sector is the largest consumer of electric traction motors, due to large-scale electrification projects.
(500 words of further analysis with market share and growth potential figures would be included here.)
Electric Traction Motor Industry Product Landscape
The electric traction motor market offers a diverse range of products, categorized by type (AC and DC), power rating (below 200 kW, 200-400 kW, above 400 kW), and application (railway, electric vehicle, industrial machinery, others). Recent innovations focus on improving efficiency, reducing weight, and enhancing power density. Key advancements include the adoption of high-performance permanent magnets, advanced control systems, and optimized motor designs. These advancements lead to improved performance metrics, including higher torque, greater efficiency, and extended lifespan. Unique selling propositions include superior energy efficiency, compact size, and quieter operation.
Key Drivers, Barriers & Challenges in Electric Traction Motor Industry
Key Drivers:
- Growing demand for electric vehicles and hybrid electric vehicles.
- Increasing investments in railway electrification projects worldwide.
- Stringent environmental regulations promoting sustainable transportation.
- Technological advancements improving efficiency and performance.
Key Challenges:
- High initial investment costs associated with adopting electric traction motors.
- Supply chain disruptions impacting the availability of raw materials and components.
- Intense competition from established players and new entrants.
- Regulatory hurdles and safety standards varying across different regions. xx% of projects are delayed due to regulatory issues.
Emerging Opportunities in Electric Traction Motor Industry
Emerging opportunities include the expansion into new applications such as electric buses, trams, and marine vessels. The growth of the electric aviation sector also presents significant opportunities. Furthermore, innovative applications in off-highway vehicles and industrial automation are gaining traction. The development of more efficient and cost-effective traction motors will further open new market segments.
Growth Accelerators in the Electric Traction Motor Industry
Long-term growth will be fueled by technological breakthroughs in power electronics, battery technology, and lightweight materials. Strategic partnerships between motor manufacturers and vehicle/machinery producers will play a key role in driving adoption. Market expansion strategies targeting emerging economies with growing infrastructure needs will also contribute significantly.
Key Players Shaping the Electric Traction Motor Industry Market
- Kirloskar Electric Company Ltd
- ABB Ltd
- Robert Bosch GmbH
- CRRC Corporation Limited
- Siemens AG
- Alstom SA
- Traktionssysteme Austria (TSA) GmbH
- CG Power and Industrial Solutions Ltd
- General Electric Company
- Skoda Transportation AS
Notable Milestones in Electric Traction Motor Industry Sector
- 2020: Introduction of a new high-efficiency permanent magnet motor by [Company Name].
- 2021: Merger between [Company A] and [Company B], expanding market reach.
- 2022: Launch of a new traction motor designed specifically for electric buses by [Company Name].
- (Further milestones would be listed here.)
In-Depth Electric Traction Motor Industry Market Outlook
The electric traction motor market is poised for significant growth over the next decade. Technological advancements, coupled with supportive government policies and increasing demand for sustainable transportation, will drive market expansion. Strategic partnerships and investments in R&D will play a crucial role in shaping the future of this dynamic industry. The focus on improving energy efficiency, reducing emissions, and enhancing performance will continue to shape product development and market trends. The market offers significant opportunities for both established players and new entrants to innovate and capture market share.
Electric Traction Motor Industry Segmentation
-
1. Type
- 1.1. Alternating Current
- 1.2. Direct Current
-
2. Power Rating
- 2.1. Below 200 kW
- 2.2. 200 - 400 kW
- 2.3. Above 400 kW
-
3. Application
- 3.1. Railway
- 3.2. Electric Vehicle
- 3.3. Industrial Machinery
- 3.4. Others
Electric Traction Motor Industry Segmentation By Geography
- 1. North America
- 2. Asia Pacific
- 3. Europe
- 4. South America
- 5. Middle East and Africa
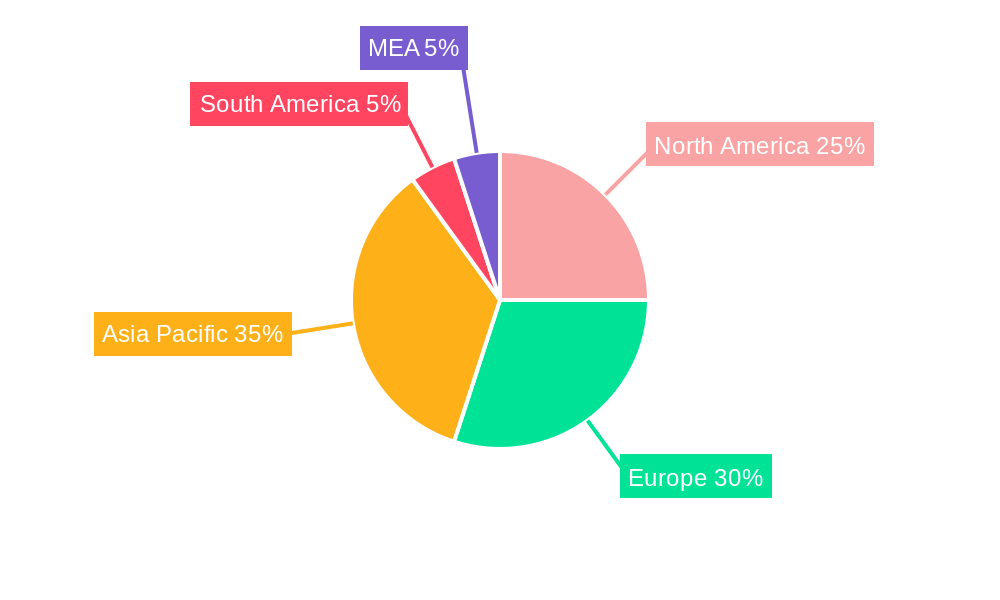
Electric Traction Motor Industry Regional Market Share
Geographic Coverage of Electric Traction Motor Industry
Electric Traction Motor Industry REPORT HIGHLIGHTS
| Aspects | Details |
|---|---|
| Study Period | 2020-2034 |
| Base Year | 2025 |
| Estimated Year | 2026 |
| Forecast Period | 2026-2034 |
| Historical Period | 2020-2025 |
| Growth Rate | CAGR of 8.82% from 2020-2034 |
| Segmentation |
|
Table of Contents
- 1. Introduction
- 1.1. Research Scope
- 1.2. Market Segmentation
- 1.3. Research Objective
- 1.4. Definitions and Assumptions
- 2. Executive Summary
- 2.1. Market Snapshot
- 3. Market Dynamics
- 3.1. Market Drivers
- 3.2. Market Restrains
- 3.3. Market Trends
- 3.4. Market Opportunities
- 4. Market Factor Analysis
- 4.1. Porters Five Forces
- 4.1.1. Bargaining Power of Suppliers
- 4.1.2. Bargaining Power of Buyers
- 4.1.3. Threat of New Entrants
- 4.1.4. Threat of Substitutes
- 4.1.5. Competitive Rivalry
- 4.2. PESTEL analysis
- 4.3. BCG Analysis
- 4.3.1. Stars (High Growth, High Market Share)
- 4.3.2. Cash Cows (Low Growth, High Market Share)
- 4.3.3. Question Mark (High Growth, Low Market Share)
- 4.3.4. Dogs (Low Growth, Low Market Share)
- 4.4. Ansoff Matrix Analysis
- 4.5. Supply Chain Analysis
- 4.6. Regulatory Landscape
- 4.7. Current Market Potential and Opportunity Assessment (TAM–SAM–SOM Framework)
- 4.8. IMR Analyst Note
- 4.1. Porters Five Forces
- 5. Market Analysis, Insights and Forecast 2021-2033
- 5.1. Market Analysis, Insights and Forecast - by Type
- 5.1.1. Alternating Current
- 5.1.2. Direct Current
- 5.2. Market Analysis, Insights and Forecast - by Power Rating
- 5.2.1. Below 200 kW
- 5.2.2. 200 - 400 kW
- 5.2.3. Above 400 kW
- 5.3. Market Analysis, Insights and Forecast - by Application
- 5.3.1. Railway
- 5.3.2. Electric Vehicle
- 5.3.3. Industrial Machinery
- 5.3.4. Others
- 5.4. Market Analysis, Insights and Forecast - by Region
- 5.4.1. North America
- 5.4.2. Asia Pacific
- 5.4.3. Europe
- 5.4.4. South America
- 5.4.5. Middle East and Africa
- 5.1. Market Analysis, Insights and Forecast - by Type
- 6. Global Electric Traction Motor Industry Analysis, Insights and Forecast, 2021-2033
- 6.1. Market Analysis, Insights and Forecast - by Type
- 6.1.1. Alternating Current
- 6.1.2. Direct Current
- 6.2. Market Analysis, Insights and Forecast - by Power Rating
- 6.2.1. Below 200 kW
- 6.2.2. 200 - 400 kW
- 6.2.3. Above 400 kW
- 6.3. Market Analysis, Insights and Forecast - by Application
- 6.3.1. Railway
- 6.3.2. Electric Vehicle
- 6.3.3. Industrial Machinery
- 6.3.4. Others
- 6.1. Market Analysis, Insights and Forecast - by Type
- 7. North America Electric Traction Motor Industry Analysis, Insights and Forecast, 2020-2032
- 7.1. Market Analysis, Insights and Forecast - by Type
- 7.1.1. Alternating Current
- 7.1.2. Direct Current
- 7.2. Market Analysis, Insights and Forecast - by Power Rating
- 7.2.1. Below 200 kW
- 7.2.2. 200 - 400 kW
- 7.2.3. Above 400 kW
- 7.3. Market Analysis, Insights and Forecast - by Application
- 7.3.1. Railway
- 7.3.2. Electric Vehicle
- 7.3.3. Industrial Machinery
- 7.3.4. Others
- 7.1. Market Analysis, Insights and Forecast - by Type
- 8. Asia Pacific Electric Traction Motor Industry Analysis, Insights and Forecast, 2020-2032
- 8.1. Market Analysis, Insights and Forecast - by Type
- 8.1.1. Alternating Current
- 8.1.2. Direct Current
- 8.2. Market Analysis, Insights and Forecast - by Power Rating
- 8.2.1. Below 200 kW
- 8.2.2. 200 - 400 kW
- 8.2.3. Above 400 kW
- 8.3. Market Analysis, Insights and Forecast - by Application
- 8.3.1. Railway
- 8.3.2. Electric Vehicle
- 8.3.3. Industrial Machinery
- 8.3.4. Others
- 8.1. Market Analysis, Insights and Forecast - by Type
- 9. Europe Electric Traction Motor Industry Analysis, Insights and Forecast, 2020-2032
- 9.1. Market Analysis, Insights and Forecast - by Type
- 9.1.1. Alternating Current
- 9.1.2. Direct Current
- 9.2. Market Analysis, Insights and Forecast - by Power Rating
- 9.2.1. Below 200 kW
- 9.2.2. 200 - 400 kW
- 9.2.3. Above 400 kW
- 9.3. Market Analysis, Insights and Forecast - by Application
- 9.3.1. Railway
- 9.3.2. Electric Vehicle
- 9.3.3. Industrial Machinery
- 9.3.4. Others
- 9.1. Market Analysis, Insights and Forecast - by Type
- 10. South America Electric Traction Motor Industry Analysis, Insights and Forecast, 2020-2032
- 10.1. Market Analysis, Insights and Forecast - by Type
- 10.1.1. Alternating Current
- 10.1.2. Direct Current
- 10.2. Market Analysis, Insights and Forecast - by Power Rating
- 10.2.1. Below 200 kW
- 10.2.2. 200 - 400 kW
- 10.2.3. Above 400 kW
- 10.3. Market Analysis, Insights and Forecast - by Application
- 10.3.1. Railway
- 10.3.2. Electric Vehicle
- 10.3.3. Industrial Machinery
- 10.3.4. Others
- 10.1. Market Analysis, Insights and Forecast - by Type
- 11. Middle East and Africa Electric Traction Motor Industry Analysis, Insights and Forecast, 2020-2032
- 11.1. Market Analysis, Insights and Forecast - by Type
- 11.1.1. Alternating Current
- 11.1.2. Direct Current
- 11.2. Market Analysis, Insights and Forecast - by Power Rating
- 11.2.1. Below 200 kW
- 11.2.2. 200 - 400 kW
- 11.2.3. Above 400 kW
- 11.3. Market Analysis, Insights and Forecast - by Application
- 11.3.1. Railway
- 11.3.2. Electric Vehicle
- 11.3.3. Industrial Machinery
- 11.3.4. Others
- 11.1. Market Analysis, Insights and Forecast - by Type
- 12. Competitive Analysis
- 12.1. Company Profiles
- 12.1.1 Kirloskar Electric Company Ltd
- 12.1.1.1. Company Overview
- 12.1.1.2. Products
- 12.1.1.3. Company Financials
- 12.1.1.4. SWOT Analysis
- 12.1.2 ABB Ltd
- 12.1.2.1. Company Overview
- 12.1.2.2. Products
- 12.1.2.3. Company Financials
- 12.1.2.4. SWOT Analysis
- 12.1.3 Robert Bosch GmbH*List Not Exhaustive
- 12.1.3.1. Company Overview
- 12.1.3.2. Products
- 12.1.3.3. Company Financials
- 12.1.3.4. SWOT Analysis
- 12.1.4 CRRC Corporation Limited
- 12.1.4.1. Company Overview
- 12.1.4.2. Products
- 12.1.4.3. Company Financials
- 12.1.4.4. SWOT Analysis
- 12.1.5 Siemens AG
- 12.1.5.1. Company Overview
- 12.1.5.2. Products
- 12.1.5.3. Company Financials
- 12.1.5.4. SWOT Analysis
- 12.1.6 Alstom SA
- 12.1.6.1. Company Overview
- 12.1.6.2. Products
- 12.1.6.3. Company Financials
- 12.1.6.4. SWOT Analysis
- 12.1.7 Traktionssysteme Austria (TSA) GmbH
- 12.1.7.1. Company Overview
- 12.1.7.2. Products
- 12.1.7.3. Company Financials
- 12.1.7.4. SWOT Analysis
- 12.1.8 CG Power and Industrial Solutions Ltd
- 12.1.8.1. Company Overview
- 12.1.8.2. Products
- 12.1.8.3. Company Financials
- 12.1.8.4. SWOT Analysis
- 12.1.9 General Electric Company
- 12.1.9.1. Company Overview
- 12.1.9.2. Products
- 12.1.9.3. Company Financials
- 12.1.9.4. SWOT Analysis
- 12.1.10 Skoda Transportation AS
- 12.1.10.1. Company Overview
- 12.1.10.2. Products
- 12.1.10.3. Company Financials
- 12.1.10.4. SWOT Analysis
- 12.1.1 Kirloskar Electric Company Ltd
- 12.2. Market Entropy
- 12.2.1 Company's Key Areas Served
- 12.2.2 Recent Developments
- 12.3. Company Market Share Analysis 2025
- 12.3.1 Top 5 Companies Market Share Analysis
- 12.3.2 Top 3 Companies Market Share Analysis
- 12.4. List of Potential Customers
- 13. Research Methodology
List of Figures
- Figure 1: Global Electric Traction Motor Industry Revenue Breakdown (billion, %) by Region 2025 & 2033
- Figure 2: North America Electric Traction Motor Industry Revenue (billion), by Type 2025 & 2033
- Figure 3: North America Electric Traction Motor Industry Revenue Share (%), by Type 2025 & 2033
- Figure 4: North America Electric Traction Motor Industry Revenue (billion), by Power Rating 2025 & 2033
- Figure 5: North America Electric Traction Motor Industry Revenue Share (%), by Power Rating 2025 & 2033
- Figure 6: North America Electric Traction Motor Industry Revenue (billion), by Application 2025 & 2033
- Figure 7: North America Electric Traction Motor Industry Revenue Share (%), by Application 2025 & 2033
- Figure 8: North America Electric Traction Motor Industry Revenue (billion), by Country 2025 & 2033
- Figure 9: North America Electric Traction Motor Industry Revenue Share (%), by Country 2025 & 2033
- Figure 10: Asia Pacific Electric Traction Motor Industry Revenue (billion), by Type 2025 & 2033
- Figure 11: Asia Pacific Electric Traction Motor Industry Revenue Share (%), by Type 2025 & 2033
- Figure 12: Asia Pacific Electric Traction Motor Industry Revenue (billion), by Power Rating 2025 & 2033
- Figure 13: Asia Pacific Electric Traction Motor Industry Revenue Share (%), by Power Rating 2025 & 2033
- Figure 14: Asia Pacific Electric Traction Motor Industry Revenue (billion), by Application 2025 & 2033
- Figure 15: Asia Pacific Electric Traction Motor Industry Revenue Share (%), by Application 2025 & 2033
- Figure 16: Asia Pacific Electric Traction Motor Industry Revenue (billion), by Country 2025 & 2033
- Figure 17: Asia Pacific Electric Traction Motor Industry Revenue Share (%), by Country 2025 & 2033
- Figure 18: Europe Electric Traction Motor Industry Revenue (billion), by Type 2025 & 2033
- Figure 19: Europe Electric Traction Motor Industry Revenue Share (%), by Type 2025 & 2033
- Figure 20: Europe Electric Traction Motor Industry Revenue (billion), by Power Rating 2025 & 2033
- Figure 21: Europe Electric Traction Motor Industry Revenue Share (%), by Power Rating 2025 & 2033
- Figure 22: Europe Electric Traction Motor Industry Revenue (billion), by Application 2025 & 2033
- Figure 23: Europe Electric Traction Motor Industry Revenue Share (%), by Application 2025 & 2033
- Figure 24: Europe Electric Traction Motor Industry Revenue (billion), by Country 2025 & 2033
- Figure 25: Europe Electric Traction Motor Industry Revenue Share (%), by Country 2025 & 2033
- Figure 26: South America Electric Traction Motor Industry Revenue (billion), by Type 2025 & 2033
- Figure 27: South America Electric Traction Motor Industry Revenue Share (%), by Type 2025 & 2033
- Figure 28: South America Electric Traction Motor Industry Revenue (billion), by Power Rating 2025 & 2033
- Figure 29: South America Electric Traction Motor Industry Revenue Share (%), by Power Rating 2025 & 2033
- Figure 30: South America Electric Traction Motor Industry Revenue (billion), by Application 2025 & 2033
- Figure 31: South America Electric Traction Motor Industry Revenue Share (%), by Application 2025 & 2033
- Figure 32: South America Electric Traction Motor Industry Revenue (billion), by Country 2025 & 2033
- Figure 33: South America Electric Traction Motor Industry Revenue Share (%), by Country 2025 & 2033
- Figure 34: Middle East and Africa Electric Traction Motor Industry Revenue (billion), by Type 2025 & 2033
- Figure 35: Middle East and Africa Electric Traction Motor Industry Revenue Share (%), by Type 2025 & 2033
- Figure 36: Middle East and Africa Electric Traction Motor Industry Revenue (billion), by Power Rating 2025 & 2033
- Figure 37: Middle East and Africa Electric Traction Motor Industry Revenue Share (%), by Power Rating 2025 & 2033
- Figure 38: Middle East and Africa Electric Traction Motor Industry Revenue (billion), by Application 2025 & 2033
- Figure 39: Middle East and Africa Electric Traction Motor Industry Revenue Share (%), by Application 2025 & 2033
- Figure 40: Middle East and Africa Electric Traction Motor Industry Revenue (billion), by Country 2025 & 2033
- Figure 41: Middle East and Africa Electric Traction Motor Industry Revenue Share (%), by Country 2025 & 2033
List of Tables
- Table 1: Global Electric Traction Motor Industry Revenue billion Forecast, by Type 2020 & 2033
- Table 2: Global Electric Traction Motor Industry Revenue billion Forecast, by Power Rating 2020 & 2033
- Table 3: Global Electric Traction Motor Industry Revenue billion Forecast, by Application 2020 & 2033
- Table 4: Global Electric Traction Motor Industry Revenue billion Forecast, by Region 2020 & 2033
- Table 5: Global Electric Traction Motor Industry Revenue billion Forecast, by Type 2020 & 2033
- Table 6: Global Electric Traction Motor Industry Revenue billion Forecast, by Power Rating 2020 & 2033
- Table 7: Global Electric Traction Motor Industry Revenue billion Forecast, by Application 2020 & 2033
- Table 8: Global Electric Traction Motor Industry Revenue billion Forecast, by Country 2020 & 2033
- Table 9: Global Electric Traction Motor Industry Revenue billion Forecast, by Type 2020 & 2033
- Table 10: Global Electric Traction Motor Industry Revenue billion Forecast, by Power Rating 2020 & 2033
- Table 11: Global Electric Traction Motor Industry Revenue billion Forecast, by Application 2020 & 2033
- Table 12: Global Electric Traction Motor Industry Revenue billion Forecast, by Country 2020 & 2033
- Table 13: Global Electric Traction Motor Industry Revenue billion Forecast, by Type 2020 & 2033
- Table 14: Global Electric Traction Motor Industry Revenue billion Forecast, by Power Rating 2020 & 2033
- Table 15: Global Electric Traction Motor Industry Revenue billion Forecast, by Application 2020 & 2033
- Table 16: Global Electric Traction Motor Industry Revenue billion Forecast, by Country 2020 & 2033
- Table 17: Global Electric Traction Motor Industry Revenue billion Forecast, by Type 2020 & 2033
- Table 18: Global Electric Traction Motor Industry Revenue billion Forecast, by Power Rating 2020 & 2033
- Table 19: Global Electric Traction Motor Industry Revenue billion Forecast, by Application 2020 & 2033
- Table 20: Global Electric Traction Motor Industry Revenue billion Forecast, by Country 2020 & 2033
- Table 21: Global Electric Traction Motor Industry Revenue billion Forecast, by Type 2020 & 2033
- Table 22: Global Electric Traction Motor Industry Revenue billion Forecast, by Power Rating 2020 & 2033
- Table 23: Global Electric Traction Motor Industry Revenue billion Forecast, by Application 2020 & 2033
- Table 24: Global Electric Traction Motor Industry Revenue billion Forecast, by Country 2020 & 2033
Frequently Asked Questions
1. What is the projected Compound Annual Growth Rate (CAGR) of the Electric Traction Motor Industry?
The projected CAGR is approximately 8.82%.
2. Which companies are prominent players in the Electric Traction Motor Industry?
Key companies in the market include Kirloskar Electric Company Ltd, ABB Ltd, Robert Bosch GmbH*List Not Exhaustive, CRRC Corporation Limited, Siemens AG, Alstom SA, Traktionssysteme Austria (TSA) GmbH, CG Power and Industrial Solutions Ltd, General Electric Company, Skoda Transportation AS.
3. What are the main segments of the Electric Traction Motor Industry?
The market segments include Type, Power Rating, Application.
4. Can you provide details about the market size?
The market size is estimated to be USD 15.87 billion as of 2022.
5. What are some drivers contributing to market growth?
4.; Increasing Integration Of Renewable Energy Generation4.; Aging Power Grids And Investments In Transmission And Distribution Infrastructure.
6. What are the notable trends driving market growth?
Electric Vehicle to Witness Significant Growth.
7. Are there any restraints impacting market growth?
4.; Lack Of Investor Confidence Due To Sociopolitical Instability In Some Countries.
8. Can you provide examples of recent developments in the market?
N/A
9. What pricing options are available for accessing the report?
Pricing options include single-user, multi-user, and enterprise licenses priced at USD 4750, USD 5250, and USD 8750 respectively.
10. Is the market size provided in terms of value or volume?
The market size is provided in terms of value, measured in billion.
11. Are there any specific market keywords associated with the report?
Yes, the market keyword associated with the report is "Electric Traction Motor Industry," which aids in identifying and referencing the specific market segment covered.
12. How do I determine which pricing option suits my needs best?
The pricing options vary based on user requirements and access needs. Individual users may opt for single-user licenses, while businesses requiring broader access may choose multi-user or enterprise licenses for cost-effective access to the report.
13. Are there any additional resources or data provided in the Electric Traction Motor Industry report?
While the report offers comprehensive insights, it's advisable to review the specific contents or supplementary materials provided to ascertain if additional resources or data are available.
14. How can I stay updated on further developments or reports in the Electric Traction Motor Industry?
To stay informed about further developments, trends, and reports in the Electric Traction Motor Industry, consider subscribing to industry newsletters, following relevant companies and organizations, or regularly checking reputable industry news sources and publications.
Methodology
Step 1 - Identification of Relevant Samples Size from Population Database


Step 2 - Approaches for Defining Global Market Size (Value, Volume* & Price*)

Note*: In applicable scenarios
Step 3 - Data Sources
Primary Research
- Web Analytics
- Survey Reports
- Research Institute
- Latest Research Reports
- Opinion Leaders
Secondary Research
- Annual Reports
- White Paper
- Latest Press Release
- Industry Association
- Paid Database
- Investor Presentations

Step 4 - Data Triangulation
Involves using different sources of information in order to increase the validity of a study
These sources are likely to be stakeholders in a program - participants, other researchers, program staff, other community members, and so on.
Then we put all data in single framework & apply various statistical tools to find out the dynamic on the market.
During the analysis stage, feedback from the stakeholder groups would be compared to determine areas of agreement as well as areas of divergence