

Key Insights
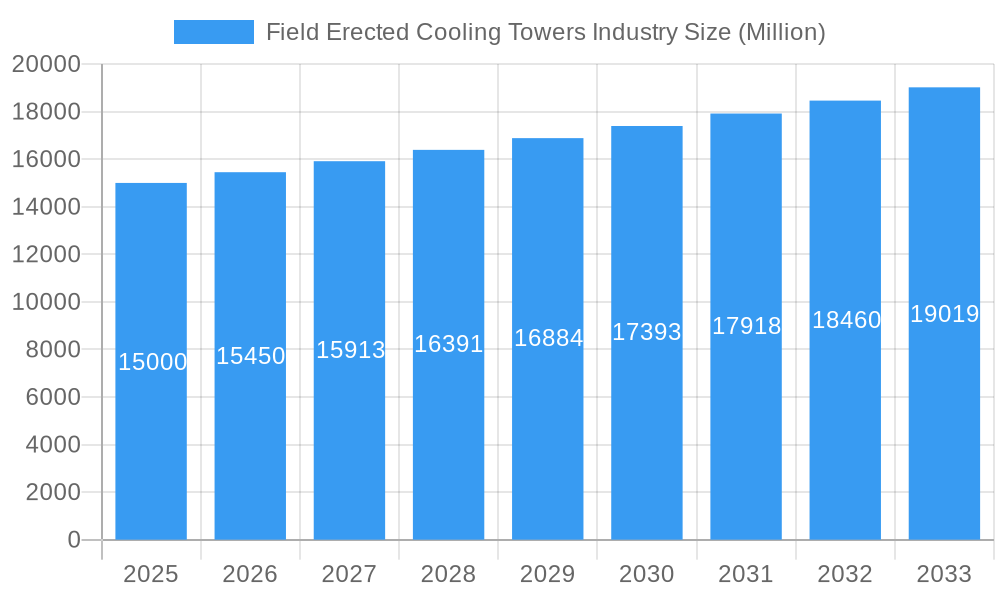
The global field-erected cooling towers market is projected to expand significantly, with an estimated market size of $2.93 billion in the base year 2025. The market is anticipated to grow at a Compound Annual Growth Rate (CAGR) of 5.65% during the forecast period (2025-2033). Key growth drivers include escalating demand from the power generation, petrochemical, and oil & gas sectors, fueled by rising global energy consumption and the imperative for efficient cooling in industrial processes. Technological advancements in hybrid and dry cooling systems are enhancing efficiency and minimizing environmental impact, further propelling market expansion. Despite regulatory pressures concerning water usage and emissions, the market outlook remains robust.
Field Erected Cooling Towers Industry Market Size (In Billion)
The market is segmented by end-user industries (power generation, petrochemicals, oil & gas, and others), cooling tower type (wet, dry, hybrid), and design (natural, induced, forced). North America and Asia Pacific are expected to lead market dominance due to intense industrial activity and ongoing infrastructure development.
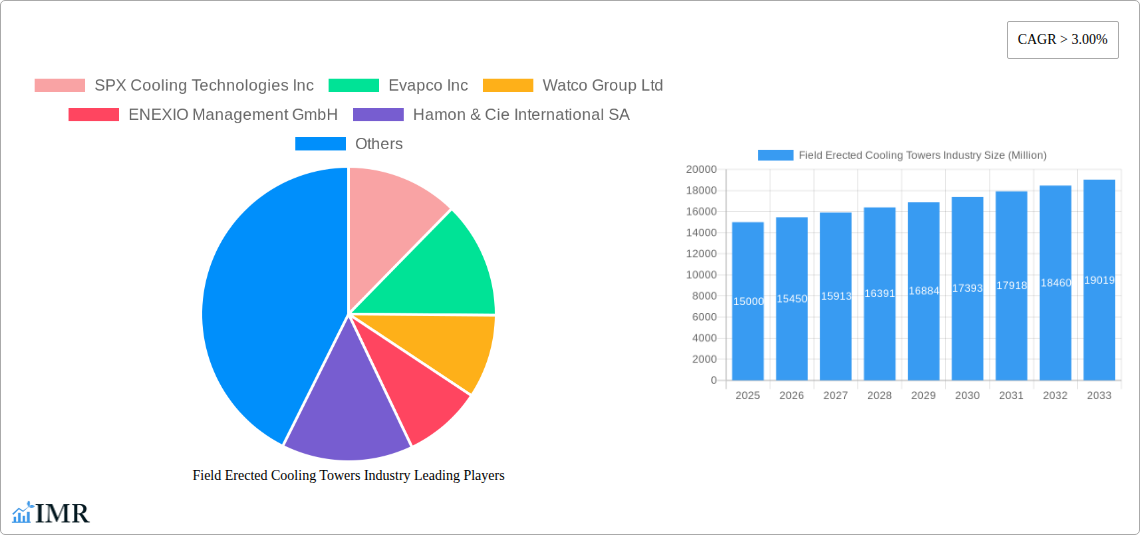
Field Erected Cooling Towers Industry Company Market Share
Sustained market growth will be further bolstered by increased investments in renewable energy sources, necessitating advanced cooling solutions. Innovations in materials science are yielding more durable and cost-effective cooling tower components. The expansion of petrochemical and oil & gas industries in emerging economies also contributes to market growth. Potential restraints include high initial investment and specialized installation requirements, although the long-term trajectory remains highly positive, driven by global trends towards efficiency, sustainability, and industrial growth.
Field Erected Cooling Towers Industry Market Report: 2019-2033
This comprehensive report provides an in-depth analysis of the Field Erected Cooling Towers market, encompassing market dynamics, growth trends, regional segmentation, product landscape, and key players. The study period covers 2019-2033, with 2025 as the base and estimated year. The report is essential for industry professionals, investors, and strategic decision-makers seeking a clear understanding of this vital sector within the broader Cooling Towers market. The global market size is estimated at xx Million in 2025 and is projected to reach xx Million by 2033.
Field Erected Cooling Towers Industry Market Dynamics & Structure
The field-erected cooling tower market is characterized by moderate concentration, with several major players vying for market share. Technological innovation, driven by the need for increased efficiency and reduced environmental impact, is a key driver. Stringent environmental regulations concerning water usage and emissions are shaping market dynamics, while the availability of alternative cooling technologies presents competitive pressure. The market sees considerable M&A activity, indicating consolidation and a drive for greater scale. End-user demographics, particularly within the power generation and petrochemical sectors, are major influence factors.
- Market Concentration: Moderately concentrated, with top 5 players holding approximately xx% market share in 2025.
- Technological Innovation: Focus on energy efficiency, reduced water consumption, and advanced materials. Barriers include high R&D costs and integration challenges.
- Regulatory Framework: Stringent environmental regulations impacting design and operational aspects, particularly in developed regions.
- Competitive Substitutes: Air-cooled systems and other advanced cooling technologies pose competition.
- End-User Demographics: Power generation, petrochemicals, and oil & gas remain dominant end-users.
- M&A Trends: Significant M&A activity observed in recent years, with xx major deals recorded between 2019 and 2024, driven by strategic expansion and technology acquisition.
Field Erected Cooling Towers Industry Growth Trends & Insights
The field-erected cooling towers market experienced significant growth during the historical period (2019-2024), driven by increasing demand from key industrial sectors and infrastructure development, particularly in emerging economies. The market is expected to maintain a healthy Compound Annual Growth Rate (CAGR) of xx% during the forecast period (2025-2033). Technological advancements, such as the adoption of hybrid cooling systems and advanced materials, are further fueling market growth. Shifting consumer preferences towards sustainable and energy-efficient solutions are influencing product development and market adoption. Market penetration is expected to increase significantly in developing regions due to expanding industrialization and infrastructure investments.
Dominant Regions, Countries, or Segments in Field Erected Cooling Towers Industry
The Asia-Pacific region is currently the dominant market for field-erected cooling towers, driven by rapid industrialization and substantial investments in power generation and petrochemical facilities. North America and Europe also hold significant market shares. Among the end-users, the power generation segment is the largest, accounting for approximately xx% of the overall market in 2025. Within cooling tower types, wet cooling towers currently dominate due to their cost-effectiveness and established technology, followed by hybrid cooling towers. Induced draft design holds the largest market share.
- Key Drivers (Asia-Pacific): Rapid industrialization, expanding power generation capacity, government initiatives promoting infrastructure development.
- Key Drivers (North America): Replacement cycles for aging infrastructure, focus on energy efficiency upgrades.
- Key Drivers (Europe): Stringent environmental regulations driving adoption of advanced technologies, increasing focus on renewable energy sources.
- Dominant Segment: Power Generation (xx% market share in 2025), followed by Petrochemicals (xx%) and Oil & Gas (xx%).
- Dominant Type: Wet cooling towers, due to cost-effectiveness.
Field Erected Cooling Towers Industry Product Landscape
Field-erected cooling towers are available in various designs (natural, induced, forced draft), types (wet, dry, hybrid), and sizes, catering to diverse industrial applications and cooling requirements. Recent innovations focus on improving efficiency, reducing water consumption, and minimizing environmental impact. Key features include advanced fill materials, optimized air distribution, and intelligent control systems. Unique selling propositions include customized design solutions, improved performance guarantees, and extended operational lifespans.
Key Drivers, Barriers & Challenges in Field Erected Cooling Towers Industry
Key Drivers: Increased demand from power generation and industrial sectors, stringent environmental regulations pushing for improved efficiency, and advancements in materials and designs.
Key Challenges: High initial investment costs, complex installation processes, competition from alternative cooling technologies (e.g., air-cooled systems), and potential supply chain disruptions impacting material availability and project timelines. This can lead to project delays and increased costs. Regulatory hurdles in certain regions may further hinder market expansion.
Emerging Opportunities in Field Erected Cooling Towers Industry
Emerging opportunities lie in the development of highly efficient hybrid and dry cooling towers, tailored solutions for specific industrial applications (e.g., data centers, renewable energy plants), and expanding into untapped markets in developing economies. The integration of smart technologies, including remote monitoring and predictive maintenance, presents significant opportunities for enhanced operational efficiency and reduced downtime.
Growth Accelerators in the Field Erected Cooling Towers Industry
Long-term growth will be fueled by technological advancements, particularly in areas such as AI-driven optimization, and materials science to improve energy efficiency and water conservation. Strategic partnerships between cooling tower manufacturers and end-users to develop customized solutions will play a vital role. Expansion into new geographic markets and exploration of innovative applications will further stimulate market growth.
Key Players Shaping the Field Erected Cooling Towers Industry Market
- SPX Cooling Technologies Inc
- Evapco Inc
- Watco Group Ltd
- ENEXIO Management GmbH
- Hamon & Cie International SA
- Towertech Cooling System Pvt Ltd
- Paharpur Cooling Towers Ltd
- Cyrco Inc
- Babcock & Wilcox Enterprises Inc
- Marley Flow Control Pty Ltd
- *List Not Exhaustive
Notable Milestones in Field Erected Cooling Towers Industry Sector
- February 2020: SPX Cooling Technologies Inc. launched the Marley MH Element Fluid Cooler, enhancing HVAC and industrial cooling solutions.
- December 2021: SWAT acquired Midwest Cooling Tower Services, strengthening its market presence in cooling tower maintenance and services.
In-Depth Field Erected Cooling Towers Industry Market Outlook
The field-erected cooling tower market is poised for sustained growth, driven by increasing industrialization, stringent environmental regulations, and technological advancements. Strategic opportunities lie in developing sustainable, energy-efficient, and cost-effective solutions. Companies focusing on innovation, strategic partnerships, and market expansion will be best positioned to capitalize on future market potential.
Field Erected Cooling Towers Industry Segmentation
-
1. Type
- 1.1. Wet
- 1.2. Dry
- 1.3. Hybrid
-
2. Design
- 2.1. Natural
- 2.2. Induced
- 2.3. Forced
-
3. End User
- 3.1. Power Generation
- 3.2. Petrochemicals
- 3.3. Oil & Gas
- 3.4. Other End Users
Field Erected Cooling Towers Industry Segmentation By Geography
- 1. North America
- 2. Europe
- 3. Asia Pacific
- 4. Middle East
- 5. South America
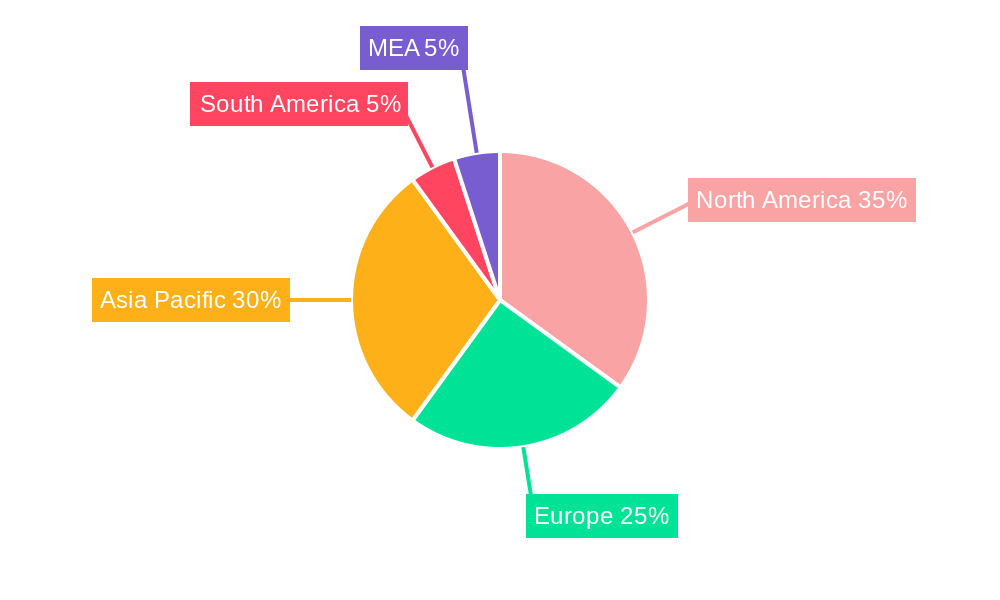
Field Erected Cooling Towers Industry Regional Market Share
Geographic Coverage of Field Erected Cooling Towers Industry
Field Erected Cooling Towers Industry REPORT HIGHLIGHTS
| Aspects | Details |
|---|---|
| Study Period | 2020-2034 |
| Base Year | 2025 |
| Estimated Year | 2026 |
| Forecast Period | 2026-2034 |
| Historical Period | 2020-2025 |
| Growth Rate | CAGR of 5.65% from 2020-2034 |
| Segmentation |
|
Table of Contents
- 1. Introduction
- 1.1. Research Scope
- 1.2. Market Segmentation
- 1.3. Research Objective
- 1.4. Definitions and Assumptions
- 2. Executive Summary
- 2.1. Market Snapshot
- 3. Market Dynamics
- 3.1. Market Drivers
- 3.2. Market Restrains
- 3.3. Market Trends
- 3.4. Market Opportunities
- 4. Market Factor Analysis
- 4.1. Porters Five Forces
- 4.1.1. Bargaining Power of Suppliers
- 4.1.2. Bargaining Power of Buyers
- 4.1.3. Threat of New Entrants
- 4.1.4. Threat of Substitutes
- 4.1.5. Competitive Rivalry
- 4.2. PESTEL analysis
- 4.3. BCG Analysis
- 4.3.1. Stars (High Growth, High Market Share)
- 4.3.2. Cash Cows (Low Growth, High Market Share)
- 4.3.3. Question Mark (High Growth, Low Market Share)
- 4.3.4. Dogs (Low Growth, Low Market Share)
- 4.4. Ansoff Matrix Analysis
- 4.5. Supply Chain Analysis
- 4.6. Regulatory Landscape
- 4.7. Current Market Potential and Opportunity Assessment (TAM–SAM–SOM Framework)
- 4.8. IMR Analyst Note
- 4.1. Porters Five Forces
- 5. Market Analysis, Insights and Forecast 2021-2033
- 5.1. Market Analysis, Insights and Forecast - by Type
- 5.1.1. Wet
- 5.1.2. Dry
- 5.1.3. Hybrid
- 5.2. Market Analysis, Insights and Forecast - by Design
- 5.2.1. Natural
- 5.2.2. Induced
- 5.2.3. Forced
- 5.3. Market Analysis, Insights and Forecast - by End User
- 5.3.1. Power Generation
- 5.3.2. Petrochemicals
- 5.3.3. Oil & Gas
- 5.3.4. Other End Users
- 5.4. Market Analysis, Insights and Forecast - by Region
- 5.4.1. North America
- 5.4.2. Europe
- 5.4.3. Asia Pacific
- 5.4.4. Middle East
- 5.4.5. South America
- 5.1. Market Analysis, Insights and Forecast - by Type
- 6. Global Field Erected Cooling Towers Industry Analysis, Insights and Forecast, 2021-2033
- 6.1. Market Analysis, Insights and Forecast - by Type
- 6.1.1. Wet
- 6.1.2. Dry
- 6.1.3. Hybrid
- 6.2. Market Analysis, Insights and Forecast - by Design
- 6.2.1. Natural
- 6.2.2. Induced
- 6.2.3. Forced
- 6.3. Market Analysis, Insights and Forecast - by End User
- 6.3.1. Power Generation
- 6.3.2. Petrochemicals
- 6.3.3. Oil & Gas
- 6.3.4. Other End Users
- 6.1. Market Analysis, Insights and Forecast - by Type
- 7. North America Field Erected Cooling Towers Industry Analysis, Insights and Forecast, 2020-2032
- 7.1. Market Analysis, Insights and Forecast - by Type
- 7.1.1. Wet
- 7.1.2. Dry
- 7.1.3. Hybrid
- 7.2. Market Analysis, Insights and Forecast - by Design
- 7.2.1. Natural
- 7.2.2. Induced
- 7.2.3. Forced
- 7.3. Market Analysis, Insights and Forecast - by End User
- 7.3.1. Power Generation
- 7.3.2. Petrochemicals
- 7.3.3. Oil & Gas
- 7.3.4. Other End Users
- 7.1. Market Analysis, Insights and Forecast - by Type
- 8. Europe Field Erected Cooling Towers Industry Analysis, Insights and Forecast, 2020-2032
- 8.1. Market Analysis, Insights and Forecast - by Type
- 8.1.1. Wet
- 8.1.2. Dry
- 8.1.3. Hybrid
- 8.2. Market Analysis, Insights and Forecast - by Design
- 8.2.1. Natural
- 8.2.2. Induced
- 8.2.3. Forced
- 8.3. Market Analysis, Insights and Forecast - by End User
- 8.3.1. Power Generation
- 8.3.2. Petrochemicals
- 8.3.3. Oil & Gas
- 8.3.4. Other End Users
- 8.1. Market Analysis, Insights and Forecast - by Type
- 9. Asia Pacific Field Erected Cooling Towers Industry Analysis, Insights and Forecast, 2020-2032
- 9.1. Market Analysis, Insights and Forecast - by Type
- 9.1.1. Wet
- 9.1.2. Dry
- 9.1.3. Hybrid
- 9.2. Market Analysis, Insights and Forecast - by Design
- 9.2.1. Natural
- 9.2.2. Induced
- 9.2.3. Forced
- 9.3. Market Analysis, Insights and Forecast - by End User
- 9.3.1. Power Generation
- 9.3.2. Petrochemicals
- 9.3.3. Oil & Gas
- 9.3.4. Other End Users
- 9.1. Market Analysis, Insights and Forecast - by Type
- 10. Middle East Field Erected Cooling Towers Industry Analysis, Insights and Forecast, 2020-2032
- 10.1. Market Analysis, Insights and Forecast - by Type
- 10.1.1. Wet
- 10.1.2. Dry
- 10.1.3. Hybrid
- 10.2. Market Analysis, Insights and Forecast - by Design
- 10.2.1. Natural
- 10.2.2. Induced
- 10.2.3. Forced
- 10.3. Market Analysis, Insights and Forecast - by End User
- 10.3.1. Power Generation
- 10.3.2. Petrochemicals
- 10.3.3. Oil & Gas
- 10.3.4. Other End Users
- 10.1. Market Analysis, Insights and Forecast - by Type
- 11. South America Field Erected Cooling Towers Industry Analysis, Insights and Forecast, 2020-2032
- 11.1. Market Analysis, Insights and Forecast - by Type
- 11.1.1. Wet
- 11.1.2. Dry
- 11.1.3. Hybrid
- 11.2. Market Analysis, Insights and Forecast - by Design
- 11.2.1. Natural
- 11.2.2. Induced
- 11.2.3. Forced
- 11.3. Market Analysis, Insights and Forecast - by End User
- 11.3.1. Power Generation
- 11.3.2. Petrochemicals
- 11.3.3. Oil & Gas
- 11.3.4. Other End Users
- 11.1. Market Analysis, Insights and Forecast - by Type
- 12. Competitive Analysis
- 12.1. Company Profiles
- 12.1.1 SPX Cooling Technologies Inc
- 12.1.1.1. Company Overview
- 12.1.1.2. Products
- 12.1.1.3. Company Financials
- 12.1.1.4. SWOT Analysis
- 12.1.2 Evapco Inc
- 12.1.2.1. Company Overview
- 12.1.2.2. Products
- 12.1.2.3. Company Financials
- 12.1.2.4. SWOT Analysis
- 12.1.3 Watco Group Ltd
- 12.1.3.1. Company Overview
- 12.1.3.2. Products
- 12.1.3.3. Company Financials
- 12.1.3.4. SWOT Analysis
- 12.1.4 ENEXIO Management GmbH
- 12.1.4.1. Company Overview
- 12.1.4.2. Products
- 12.1.4.3. Company Financials
- 12.1.4.4. SWOT Analysis
- 12.1.5 Hamon & Cie International SA
- 12.1.5.1. Company Overview
- 12.1.5.2. Products
- 12.1.5.3. Company Financials
- 12.1.5.4. SWOT Analysis
- 12.1.6 Towertech Cooling System Pvt Ltd
- 12.1.6.1. Company Overview
- 12.1.6.2. Products
- 12.1.6.3. Company Financials
- 12.1.6.4. SWOT Analysis
- 12.1.7 Paharpur Cooling Towers Ltd
- 12.1.7.1. Company Overview
- 12.1.7.2. Products
- 12.1.7.3. Company Financials
- 12.1.7.4. SWOT Analysis
- 12.1.8 Cyrco Inc
- 12.1.8.1. Company Overview
- 12.1.8.2. Products
- 12.1.8.3. Company Financials
- 12.1.8.4. SWOT Analysis
- 12.1.9 Babcock & Wilcox Enterprises Inc
- 12.1.9.1. Company Overview
- 12.1.9.2. Products
- 12.1.9.3. Company Financials
- 12.1.9.4. SWOT Analysis
- 12.1.10 Marley Flow Control Pty Ltd*List Not Exhaustive
- 12.1.10.1. Company Overview
- 12.1.10.2. Products
- 12.1.10.3. Company Financials
- 12.1.10.4. SWOT Analysis
- 12.1.1 SPX Cooling Technologies Inc
- 12.2. Market Entropy
- 12.2.1 Company's Key Areas Served
- 12.2.2 Recent Developments
- 12.3. Company Market Share Analysis 2025
- 12.3.1 Top 5 Companies Market Share Analysis
- 12.3.2 Top 3 Companies Market Share Analysis
- 12.4. List of Potential Customers
- 13. Research Methodology
List of Figures
- Figure 1: Global Field Erected Cooling Towers Industry Revenue Breakdown (billion, %) by Region 2025 & 2033
- Figure 2: Global Field Erected Cooling Towers Industry Volume Breakdown (Gigawatt, %) by Region 2025 & 2033
- Figure 3: North America Field Erected Cooling Towers Industry Revenue (billion), by Type 2025 & 2033
- Figure 4: North America Field Erected Cooling Towers Industry Volume (Gigawatt), by Type 2025 & 2033
- Figure 5: North America Field Erected Cooling Towers Industry Revenue Share (%), by Type 2025 & 2033
- Figure 6: North America Field Erected Cooling Towers Industry Volume Share (%), by Type 2025 & 2033
- Figure 7: North America Field Erected Cooling Towers Industry Revenue (billion), by Design 2025 & 2033
- Figure 8: North America Field Erected Cooling Towers Industry Volume (Gigawatt), by Design 2025 & 2033
- Figure 9: North America Field Erected Cooling Towers Industry Revenue Share (%), by Design 2025 & 2033
- Figure 10: North America Field Erected Cooling Towers Industry Volume Share (%), by Design 2025 & 2033
- Figure 11: North America Field Erected Cooling Towers Industry Revenue (billion), by End User 2025 & 2033
- Figure 12: North America Field Erected Cooling Towers Industry Volume (Gigawatt), by End User 2025 & 2033
- Figure 13: North America Field Erected Cooling Towers Industry Revenue Share (%), by End User 2025 & 2033
- Figure 14: North America Field Erected Cooling Towers Industry Volume Share (%), by End User 2025 & 2033
- Figure 15: North America Field Erected Cooling Towers Industry Revenue (billion), by Country 2025 & 2033
- Figure 16: North America Field Erected Cooling Towers Industry Volume (Gigawatt), by Country 2025 & 2033
- Figure 17: North America Field Erected Cooling Towers Industry Revenue Share (%), by Country 2025 & 2033
- Figure 18: North America Field Erected Cooling Towers Industry Volume Share (%), by Country 2025 & 2033
- Figure 19: Europe Field Erected Cooling Towers Industry Revenue (billion), by Type 2025 & 2033
- Figure 20: Europe Field Erected Cooling Towers Industry Volume (Gigawatt), by Type 2025 & 2033
- Figure 21: Europe Field Erected Cooling Towers Industry Revenue Share (%), by Type 2025 & 2033
- Figure 22: Europe Field Erected Cooling Towers Industry Volume Share (%), by Type 2025 & 2033
- Figure 23: Europe Field Erected Cooling Towers Industry Revenue (billion), by Design 2025 & 2033
- Figure 24: Europe Field Erected Cooling Towers Industry Volume (Gigawatt), by Design 2025 & 2033
- Figure 25: Europe Field Erected Cooling Towers Industry Revenue Share (%), by Design 2025 & 2033
- Figure 26: Europe Field Erected Cooling Towers Industry Volume Share (%), by Design 2025 & 2033
- Figure 27: Europe Field Erected Cooling Towers Industry Revenue (billion), by End User 2025 & 2033
- Figure 28: Europe Field Erected Cooling Towers Industry Volume (Gigawatt), by End User 2025 & 2033
- Figure 29: Europe Field Erected Cooling Towers Industry Revenue Share (%), by End User 2025 & 2033
- Figure 30: Europe Field Erected Cooling Towers Industry Volume Share (%), by End User 2025 & 2033
- Figure 31: Europe Field Erected Cooling Towers Industry Revenue (billion), by Country 2025 & 2033
- Figure 32: Europe Field Erected Cooling Towers Industry Volume (Gigawatt), by Country 2025 & 2033
- Figure 33: Europe Field Erected Cooling Towers Industry Revenue Share (%), by Country 2025 & 2033
- Figure 34: Europe Field Erected Cooling Towers Industry Volume Share (%), by Country 2025 & 2033
- Figure 35: Asia Pacific Field Erected Cooling Towers Industry Revenue (billion), by Type 2025 & 2033
- Figure 36: Asia Pacific Field Erected Cooling Towers Industry Volume (Gigawatt), by Type 2025 & 2033
- Figure 37: Asia Pacific Field Erected Cooling Towers Industry Revenue Share (%), by Type 2025 & 2033
- Figure 38: Asia Pacific Field Erected Cooling Towers Industry Volume Share (%), by Type 2025 & 2033
- Figure 39: Asia Pacific Field Erected Cooling Towers Industry Revenue (billion), by Design 2025 & 2033
- Figure 40: Asia Pacific Field Erected Cooling Towers Industry Volume (Gigawatt), by Design 2025 & 2033
- Figure 41: Asia Pacific Field Erected Cooling Towers Industry Revenue Share (%), by Design 2025 & 2033
- Figure 42: Asia Pacific Field Erected Cooling Towers Industry Volume Share (%), by Design 2025 & 2033
- Figure 43: Asia Pacific Field Erected Cooling Towers Industry Revenue (billion), by End User 2025 & 2033
- Figure 44: Asia Pacific Field Erected Cooling Towers Industry Volume (Gigawatt), by End User 2025 & 2033
- Figure 45: Asia Pacific Field Erected Cooling Towers Industry Revenue Share (%), by End User 2025 & 2033
- Figure 46: Asia Pacific Field Erected Cooling Towers Industry Volume Share (%), by End User 2025 & 2033
- Figure 47: Asia Pacific Field Erected Cooling Towers Industry Revenue (billion), by Country 2025 & 2033
- Figure 48: Asia Pacific Field Erected Cooling Towers Industry Volume (Gigawatt), by Country 2025 & 2033
- Figure 49: Asia Pacific Field Erected Cooling Towers Industry Revenue Share (%), by Country 2025 & 2033
- Figure 50: Asia Pacific Field Erected Cooling Towers Industry Volume Share (%), by Country 2025 & 2033
- Figure 51: Middle East Field Erected Cooling Towers Industry Revenue (billion), by Type 2025 & 2033
- Figure 52: Middle East Field Erected Cooling Towers Industry Volume (Gigawatt), by Type 2025 & 2033
- Figure 53: Middle East Field Erected Cooling Towers Industry Revenue Share (%), by Type 2025 & 2033
- Figure 54: Middle East Field Erected Cooling Towers Industry Volume Share (%), by Type 2025 & 2033
- Figure 55: Middle East Field Erected Cooling Towers Industry Revenue (billion), by Design 2025 & 2033
- Figure 56: Middle East Field Erected Cooling Towers Industry Volume (Gigawatt), by Design 2025 & 2033
- Figure 57: Middle East Field Erected Cooling Towers Industry Revenue Share (%), by Design 2025 & 2033
- Figure 58: Middle East Field Erected Cooling Towers Industry Volume Share (%), by Design 2025 & 2033
- Figure 59: Middle East Field Erected Cooling Towers Industry Revenue (billion), by End User 2025 & 2033
- Figure 60: Middle East Field Erected Cooling Towers Industry Volume (Gigawatt), by End User 2025 & 2033
- Figure 61: Middle East Field Erected Cooling Towers Industry Revenue Share (%), by End User 2025 & 2033
- Figure 62: Middle East Field Erected Cooling Towers Industry Volume Share (%), by End User 2025 & 2033
- Figure 63: Middle East Field Erected Cooling Towers Industry Revenue (billion), by Country 2025 & 2033
- Figure 64: Middle East Field Erected Cooling Towers Industry Volume (Gigawatt), by Country 2025 & 2033
- Figure 65: Middle East Field Erected Cooling Towers Industry Revenue Share (%), by Country 2025 & 2033
- Figure 66: Middle East Field Erected Cooling Towers Industry Volume Share (%), by Country 2025 & 2033
- Figure 67: South America Field Erected Cooling Towers Industry Revenue (billion), by Type 2025 & 2033
- Figure 68: South America Field Erected Cooling Towers Industry Volume (Gigawatt), by Type 2025 & 2033
- Figure 69: South America Field Erected Cooling Towers Industry Revenue Share (%), by Type 2025 & 2033
- Figure 70: South America Field Erected Cooling Towers Industry Volume Share (%), by Type 2025 & 2033
- Figure 71: South America Field Erected Cooling Towers Industry Revenue (billion), by Design 2025 & 2033
- Figure 72: South America Field Erected Cooling Towers Industry Volume (Gigawatt), by Design 2025 & 2033
- Figure 73: South America Field Erected Cooling Towers Industry Revenue Share (%), by Design 2025 & 2033
- Figure 74: South America Field Erected Cooling Towers Industry Volume Share (%), by Design 2025 & 2033
- Figure 75: South America Field Erected Cooling Towers Industry Revenue (billion), by End User 2025 & 2033
- Figure 76: South America Field Erected Cooling Towers Industry Volume (Gigawatt), by End User 2025 & 2033
- Figure 77: South America Field Erected Cooling Towers Industry Revenue Share (%), by End User 2025 & 2033
- Figure 78: South America Field Erected Cooling Towers Industry Volume Share (%), by End User 2025 & 2033
- Figure 79: South America Field Erected Cooling Towers Industry Revenue (billion), by Country 2025 & 2033
- Figure 80: South America Field Erected Cooling Towers Industry Volume (Gigawatt), by Country 2025 & 2033
- Figure 81: South America Field Erected Cooling Towers Industry Revenue Share (%), by Country 2025 & 2033
- Figure 82: South America Field Erected Cooling Towers Industry Volume Share (%), by Country 2025 & 2033
List of Tables
- Table 1: Global Field Erected Cooling Towers Industry Revenue billion Forecast, by Type 2020 & 2033
- Table 2: Global Field Erected Cooling Towers Industry Volume Gigawatt Forecast, by Type 2020 & 2033
- Table 3: Global Field Erected Cooling Towers Industry Revenue billion Forecast, by Design 2020 & 2033
- Table 4: Global Field Erected Cooling Towers Industry Volume Gigawatt Forecast, by Design 2020 & 2033
- Table 5: Global Field Erected Cooling Towers Industry Revenue billion Forecast, by End User 2020 & 2033
- Table 6: Global Field Erected Cooling Towers Industry Volume Gigawatt Forecast, by End User 2020 & 2033
- Table 7: Global Field Erected Cooling Towers Industry Revenue billion Forecast, by Region 2020 & 2033
- Table 8: Global Field Erected Cooling Towers Industry Volume Gigawatt Forecast, by Region 2020 & 2033
- Table 9: Global Field Erected Cooling Towers Industry Revenue billion Forecast, by Type 2020 & 2033
- Table 10: Global Field Erected Cooling Towers Industry Volume Gigawatt Forecast, by Type 2020 & 2033
- Table 11: Global Field Erected Cooling Towers Industry Revenue billion Forecast, by Design 2020 & 2033
- Table 12: Global Field Erected Cooling Towers Industry Volume Gigawatt Forecast, by Design 2020 & 2033
- Table 13: Global Field Erected Cooling Towers Industry Revenue billion Forecast, by End User 2020 & 2033
- Table 14: Global Field Erected Cooling Towers Industry Volume Gigawatt Forecast, by End User 2020 & 2033
- Table 15: Global Field Erected Cooling Towers Industry Revenue billion Forecast, by Country 2020 & 2033
- Table 16: Global Field Erected Cooling Towers Industry Volume Gigawatt Forecast, by Country 2020 & 2033
- Table 17: Global Field Erected Cooling Towers Industry Revenue billion Forecast, by Type 2020 & 2033
- Table 18: Global Field Erected Cooling Towers Industry Volume Gigawatt Forecast, by Type 2020 & 2033
- Table 19: Global Field Erected Cooling Towers Industry Revenue billion Forecast, by Design 2020 & 2033
- Table 20: Global Field Erected Cooling Towers Industry Volume Gigawatt Forecast, by Design 2020 & 2033
- Table 21: Global Field Erected Cooling Towers Industry Revenue billion Forecast, by End User 2020 & 2033
- Table 22: Global Field Erected Cooling Towers Industry Volume Gigawatt Forecast, by End User 2020 & 2033
- Table 23: Global Field Erected Cooling Towers Industry Revenue billion Forecast, by Country 2020 & 2033
- Table 24: Global Field Erected Cooling Towers Industry Volume Gigawatt Forecast, by Country 2020 & 2033
- Table 25: Global Field Erected Cooling Towers Industry Revenue billion Forecast, by Type 2020 & 2033
- Table 26: Global Field Erected Cooling Towers Industry Volume Gigawatt Forecast, by Type 2020 & 2033
- Table 27: Global Field Erected Cooling Towers Industry Revenue billion Forecast, by Design 2020 & 2033
- Table 28: Global Field Erected Cooling Towers Industry Volume Gigawatt Forecast, by Design 2020 & 2033
- Table 29: Global Field Erected Cooling Towers Industry Revenue billion Forecast, by End User 2020 & 2033
- Table 30: Global Field Erected Cooling Towers Industry Volume Gigawatt Forecast, by End User 2020 & 2033
- Table 31: Global Field Erected Cooling Towers Industry Revenue billion Forecast, by Country 2020 & 2033
- Table 32: Global Field Erected Cooling Towers Industry Volume Gigawatt Forecast, by Country 2020 & 2033
- Table 33: Global Field Erected Cooling Towers Industry Revenue billion Forecast, by Type 2020 & 2033
- Table 34: Global Field Erected Cooling Towers Industry Volume Gigawatt Forecast, by Type 2020 & 2033
- Table 35: Global Field Erected Cooling Towers Industry Revenue billion Forecast, by Design 2020 & 2033
- Table 36: Global Field Erected Cooling Towers Industry Volume Gigawatt Forecast, by Design 2020 & 2033
- Table 37: Global Field Erected Cooling Towers Industry Revenue billion Forecast, by End User 2020 & 2033
- Table 38: Global Field Erected Cooling Towers Industry Volume Gigawatt Forecast, by End User 2020 & 2033
- Table 39: Global Field Erected Cooling Towers Industry Revenue billion Forecast, by Country 2020 & 2033
- Table 40: Global Field Erected Cooling Towers Industry Volume Gigawatt Forecast, by Country 2020 & 2033
- Table 41: Global Field Erected Cooling Towers Industry Revenue billion Forecast, by Type 2020 & 2033
- Table 42: Global Field Erected Cooling Towers Industry Volume Gigawatt Forecast, by Type 2020 & 2033
- Table 43: Global Field Erected Cooling Towers Industry Revenue billion Forecast, by Design 2020 & 2033
- Table 44: Global Field Erected Cooling Towers Industry Volume Gigawatt Forecast, by Design 2020 & 2033
- Table 45: Global Field Erected Cooling Towers Industry Revenue billion Forecast, by End User 2020 & 2033
- Table 46: Global Field Erected Cooling Towers Industry Volume Gigawatt Forecast, by End User 2020 & 2033
- Table 47: Global Field Erected Cooling Towers Industry Revenue billion Forecast, by Country 2020 & 2033
- Table 48: Global Field Erected Cooling Towers Industry Volume Gigawatt Forecast, by Country 2020 & 2033
Frequently Asked Questions
1. What is the projected Compound Annual Growth Rate (CAGR) of the Field Erected Cooling Towers Industry?
The projected CAGR is approximately 5.65%.
2. Which companies are prominent players in the Field Erected Cooling Towers Industry?
Key companies in the market include SPX Cooling Technologies Inc, Evapco Inc, Watco Group Ltd, ENEXIO Management GmbH, Hamon & Cie International SA, Towertech Cooling System Pvt Ltd, Paharpur Cooling Towers Ltd, Cyrco Inc, Babcock & Wilcox Enterprises Inc, Marley Flow Control Pty Ltd*List Not Exhaustive.
3. What are the main segments of the Field Erected Cooling Towers Industry?
The market segments include Type, Design, End User.
4. Can you provide details about the market size?
The market size is estimated to be USD 2.93 billion as of 2022.
5. What are some drivers contributing to market growth?
4.; Declining Cost of Lithium Batteries4.; Increased Adoption of Renewable Energy.
6. What are the notable trends driving market growth?
Wet Type Segment to Dominate the Market.
7. Are there any restraints impacting market growth?
4.; Mismatch in Demand and Supply of Raw Materials for Battery Manufacturing.
8. Can you provide examples of recent developments in the market?
In February 2020, SPX Cooling Technologies Inc. launched its new Marley MH Element Fluid Cooler, an induced-draft, crossflow closed-circuit cooling tower suitable for heating, ventilation, air conditioning (HVAC), industrial, and process cooling applications.
9. What pricing options are available for accessing the report?
Pricing options include single-user, multi-user, and enterprise licenses priced at USD 4750, USD 5250, and USD 8750 respectively.
10. Is the market size provided in terms of value or volume?
The market size is provided in terms of value, measured in billion and volume, measured in Gigawatt.
11. Are there any specific market keywords associated with the report?
Yes, the market keyword associated with the report is "Field Erected Cooling Towers Industry," which aids in identifying and referencing the specific market segment covered.
12. How do I determine which pricing option suits my needs best?
The pricing options vary based on user requirements and access needs. Individual users may opt for single-user licenses, while businesses requiring broader access may choose multi-user or enterprise licenses for cost-effective access to the report.
13. Are there any additional resources or data provided in the Field Erected Cooling Towers Industry report?
While the report offers comprehensive insights, it's advisable to review the specific contents or supplementary materials provided to ascertain if additional resources or data are available.
14. How can I stay updated on further developments or reports in the Field Erected Cooling Towers Industry?
To stay informed about further developments, trends, and reports in the Field Erected Cooling Towers Industry, consider subscribing to industry newsletters, following relevant companies and organizations, or regularly checking reputable industry news sources and publications.
Methodology
Step 1 - Identification of Relevant Samples Size from Population Database


Step 2 - Approaches for Defining Global Market Size (Value, Volume* & Price*)

Note*: In applicable scenarios
Step 3 - Data Sources
Primary Research
- Web Analytics
- Survey Reports
- Research Institute
- Latest Research Reports
- Opinion Leaders
Secondary Research
- Annual Reports
- White Paper
- Latest Press Release
- Industry Association
- Paid Database
- Investor Presentations

Step 4 - Data Triangulation
Involves using different sources of information in order to increase the validity of a study
These sources are likely to be stakeholders in a program - participants, other researchers, program staff, other community members, and so on.
Then we put all data in single framework & apply various statistical tools to find out the dynamic on the market.
During the analysis stage, feedback from the stakeholder groups would be compared to determine areas of agreement as well as areas of divergence