

Key Insights
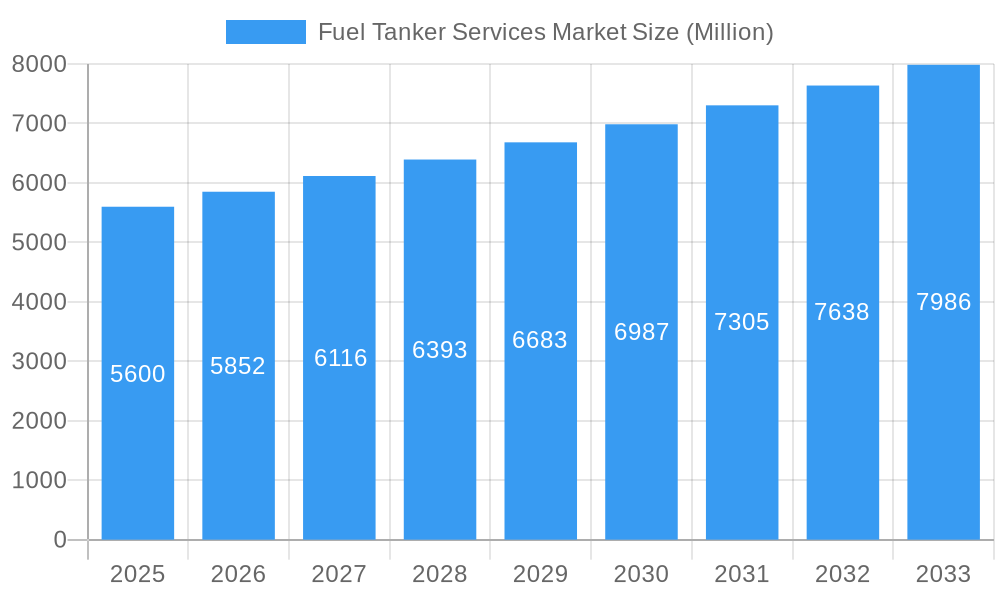
The global Fuel Tanker Services market, valued at $5.60 billion in 2025, is projected to experience robust growth, exhibiting a Compound Annual Growth Rate (CAGR) of 4.50% from 2025 to 2033. This expansion is driven by several key factors. Increased global demand for fuel, particularly in rapidly developing economies across Asia-Pacific and parts of South America, fuels the need for efficient and reliable fuel transportation. The burgeoning petrochemical and refining industries further contribute to market growth, requiring substantial fuel tanker services for the movement of raw materials and finished products. Furthermore, advancements in tanker technology, including the adoption of larger capacity vessels and improved fuel efficiency measures, enhance operational efficiency and reduce transportation costs, thereby stimulating market expansion. Stringent environmental regulations concerning fuel emissions are also pushing the adoption of cleaner fuel types like LNG, creating new market opportunities. However, fluctuating fuel prices and geopolitical instability can pose challenges, potentially impacting market growth trajectories. The market segmentation reveals a diverse landscape, with substantial demand across different tanker capacities (below 20,000 liters, 30,000-40,000 liters, above 40,000 liters) and fuel types (petrol, LNG, others). The involvement of major players like Compass Fuel Oils Ltd, Rigual SA, and Shell International Trading and Shipping Company Limited underscores the market's competitiveness and considerable investment potential.

Fuel Tanker Services Market Market Size (In Billion)
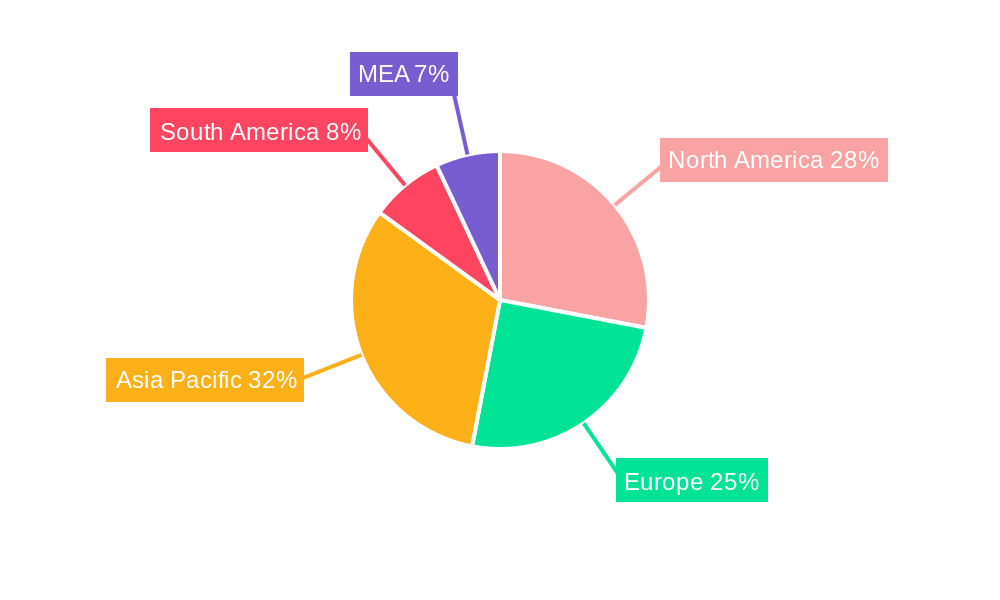
The regional distribution of the Fuel Tanker Services market reveals significant potential across different geographical areas. North America, particularly the United States, and Europe represent established markets with substantial fuel consumption and sophisticated logistics infrastructure. However, the fastest growth is anticipated in the Asia-Pacific region, driven by rapid industrialization and infrastructural development in countries like China, India, and Southeast Asia. South America also presents a promising market, with increasing demand fueled by economic growth and expanding energy sectors. The Middle East and Africa show steady growth potential, aligning with the expansion of their energy sectors. The market is characterized by a mix of retail petrol companies, refineries, and other operators, all driving demand for secure, efficient, and cost-effective fuel transportation solutions. The choice of materials in tanker construction (carbon steel, stainless steel, aluminum alloy) is determined by factors like cost, durability, and suitability for specific fuel types.
Fuel Tanker Services Market Company Market Share
Fuel Tanker Services Market: A Comprehensive Market Report (2019-2033)
This comprehensive report provides a detailed analysis of the Fuel Tanker Services market, encompassing market dynamics, growth trends, regional dominance, product landscape, key players, and future outlook. The study period spans from 2019 to 2033, with 2025 serving as the base and estimated year. The report offers invaluable insights for industry professionals, investors, and strategists seeking to navigate this evolving sector. The parent market is the Transportation and Logistics industry, while the child market focuses specifically on fuel transportation services. The market size is projected to reach xx Million by 2033.
Fuel Tanker Services Market Dynamics & Structure
The Fuel Tanker Services market is characterized by moderate concentration, with key players like Compass Fuel Oils Ltd, Rigual SA, Crown Oil Ltd, Shell International Trading and Shipping Company Limited, and Certas Energy UK Limited holding significant market share (exact percentages to be determined in the full report). Technological innovation, particularly in fuel efficiency and safety features, is a primary growth driver. Stringent regulatory frameworks concerning fuel transportation and environmental protection significantly impact market operations. The market faces competition from alternative transportation methods, such as pipelines and rail transport.
- Market Concentration: Moderately concentrated, with top 5 players holding approximately xx% market share in 2025.
- Technological Innovation: Focus on fuel efficiency, safety technologies (e.g., advanced sensors, remote monitoring), and sustainable fuel transportation.
- Regulatory Framework: Compliance with emission standards, safety regulations, and transportation permits significantly affects operational costs and market dynamics.
- Competitive Substitutes: Pipelines, rail transport, and other modes of fuel transportation pose competitive challenges.
- End-User Demographics: Primarily Refineries, Retail Petrol Companies, and other industrial users.
- M&A Trends: A moderate number of mergers and acquisitions are observed, with recent activity showing strategic expansion by major players (e.g., Compass Fuel Oils Ltd's acquisition of an Arctic fuel tanker). The estimated M&A deal volume for 2019-2024 was approximately xx deals.
Fuel Tanker Services Market Growth Trends & Insights
The Fuel Tanker Services market experienced steady growth between 2019 and 2024, driven by increasing global fuel demand and expansion of the transportation and logistics sector. The market size in 2024 was estimated at xx Million, with a CAGR of xx% during the historical period. Technological disruptions, such as the adoption of LNG and other alternative fuels, are reshaping the market landscape. Shifting consumer preferences towards environmentally friendly transportation options are creating new growth opportunities. The market is projected to grow at a CAGR of xx% during the forecast period (2025-2033), reaching xx Million by 2033. Market penetration of LNG-fueled tankers is expected to increase from xx% in 2025 to xx% by 2033.
Dominant Regions, Countries, or Segments in Fuel Tanker Services Market
The Fuel Tanker Services market is geographically diverse, with significant growth observed in several regions. The leading segment by capacity is "Above 40000 Liters" due to the increasing demand for bulk fuel transportation. Within fuel type, Petrol currently dominates, although LNG is experiencing substantial growth due to environmental concerns and government incentives. Refineries represent a major end-user segment, reflecting the substantial fuel movement needs of the refining process. Carbon Steel remains the dominant material type due to its cost-effectiveness, although Stainless Steel and Aluminum Alloy are gaining traction due to their corrosion resistance. North America and Europe currently dominate the market due to established infrastructure and high fuel consumption. However, developing economies in Asia-Pacific are showcasing promising growth potential.
- Capacity: Above 40000 Liters (largest market share)
- Fuel Type: Petrol (currently dominant, with LNG showing strong growth)
- Operator: Refineries (significant market share)
- Material Type: Carbon Steel (dominant, with increasing use of Stainless Steel and Aluminum Alloy)
- Key Growth Drivers: Expanding fuel demand, infrastructural development in emerging economies, and government support for sustainable fuel transportation.
Fuel Tanker Services Market Product Landscape
The Fuel Tanker Services market features a range of tankers, varying in capacity, fuel type compatibility, and material construction. Innovations focus on enhancing fuel efficiency, optimizing payload capacity, and improving safety features. Tankers equipped with advanced monitoring systems and remote diagnostics are gaining traction. The unique selling propositions include superior fuel efficiency, enhanced safety features, and reduced environmental impact. Technological advancements encompass the use of lightweight materials, advanced fuel management systems, and improved safety technologies.
Key Drivers, Barriers & Challenges in Fuel Tanker Services Market
Key Drivers: Increasing global fuel demand, growing logistics and transportation sector, rising investments in infrastructure development, and government regulations promoting sustainable transportation are key drivers.
Challenges & Restraints: Fluctuations in fuel prices, stringent environmental regulations, geopolitical instability affecting fuel supply chains, and competition from alternative transportation modes are major challenges. These challenges result in an estimated xx% reduction in market growth annually in specific regions.
Emerging Opportunities in Fuel Tanker Services Market
Emerging opportunities lie in the growing adoption of LNG and other alternative fuels, the expansion of fuel transportation networks in developing economies, and the increased demand for specialized tankers for handling hazardous materials. Untapped markets exist in regions with limited fuel transportation infrastructure, offering opportunities for market expansion. The development of innovative fuel tanker designs and technologies presents further opportunities for market growth.
Growth Accelerators in the Fuel Tanker Services Market Industry
Technological advancements, particularly in fuel efficiency and safety, are key growth accelerators. Strategic partnerships between tanker operators and fuel suppliers create synergies and expand market reach. Government policies promoting sustainable transportation and infrastructural development are also significant catalysts for market expansion.
Key Players Shaping the Fuel Tanker Services Market Market
- Compass Fuel Oils Ltd
- Rigual SA
- Crown Oil Ltd
- Shell International Trading and Shipping Company Limited
- Certas Energy UK Limited
- List Not Exhaustive
Notable Milestones in Fuel Tanker Services Market Sector
- January 2024: Compass Fuel Oils Ltd announced the acquisition of a new Arctic fuel tanker, expanding its fleet and enhancing capacity.
- December 2023: ReFuels announced the commencement of construction of a new CNG refueling facility, promoting sustainable transportation.
In-Depth Fuel Tanker Services Market Market Outlook
The Fuel Tanker Services market is poised for continued growth, driven by the factors mentioned earlier. Strategic investments in technology, infrastructure, and sustainable solutions will shape future market dynamics. Companies that adapt to changing regulatory landscapes and adopt innovative technologies will be best positioned to capitalize on emerging opportunities and capture significant market share. The market's future potential is significant, particularly in emerging economies and within the growing sustainable fuel transportation sector.
Fuel Tanker Services Market Segmentation
-
1. Material Type
- 1.1. Carbon Steel
- 1.2. Stainless Steel
- 1.3. Aluminum Alloy
-
2. Capacity
- 2.1. Below 20000 Liters
- 2.2. 30000 - 40000 Liters
- 2.3. Above 40000 Liters
-
3. Fuel Type
- 3.1. Petrol
- 3.2. LNG
- 3.3. Other Fuels
-
4. Operator
- 4.1. Retail Petrol Companies
- 4.2. Refineries
Fuel Tanker Services Market Segmentation By Geography
-
1. North America
- 1.1. United States
- 1.2. Canada
- 1.3. Rest of North America
-
2. Europe
- 2.1. Germany
- 2.2. France
- 2.3. United Kingdom
- 2.4. Italy
- 2.5. Spain
- 2.6. NORDIC
- 2.7. Russia
- 2.8. Rest of Europe
-
3. Asia Pacific
- 3.1. China
- 3.2. India
- 3.3. Australia
- 3.4. Malaysia
- 3.5. Indonesia
- 3.6. Thailand
- 3.7. Vietnam
- 3.8. Rest of Asia Pacific
-
4. Middle East and Africa
- 4.1. Saudi Arabia
- 4.2. United Arab Emirates
- 4.3. South Africa
- 4.4. Nigeria
- 4.5. Rest of Middle East and Africa
- 4.6. Egypt
-
5. South America
- 5.1. Brazil
- 5.2. Argentina
- 5.3. Colombia
- 5.4. Rest of South America
Fuel Tanker Services Market Regional Market Share
Geographic Coverage of Fuel Tanker Services Market
Fuel Tanker Services Market REPORT HIGHLIGHTS
| Aspects | Details |
|---|---|
| Study Period | 2020-2034 |
| Base Year | 2025 |
| Estimated Year | 2026 |
| Forecast Period | 2026-2034 |
| Historical Period | 2020-2025 |
| Growth Rate | CAGR of 4.50% from 2020-2034 |
| Segmentation |
|
Table of Contents
- 1. Introduction
- 1.1. Research Scope
- 1.2. Market Segmentation
- 1.3. Research Objective
- 1.4. Definitions and Assumptions
- 2. Executive Summary
- 2.1. Market Snapshot
- 3. Market Dynamics
- 3.1. Market Drivers
- 3.2. Market Restrains
- 3.3. Market Trends
- 3.4. Market Opportunities
- 4. Market Factor Analysis
- 4.1. Porters Five Forces
- 4.1.1. Bargaining Power of Suppliers
- 4.1.2. Bargaining Power of Buyers
- 4.1.3. Threat of New Entrants
- 4.1.4. Threat of Substitutes
- 4.1.5. Competitive Rivalry
- 4.2. PESTEL analysis
- 4.3. BCG Analysis
- 4.3.1. Stars (High Growth, High Market Share)
- 4.3.2. Cash Cows (Low Growth, High Market Share)
- 4.3.3. Question Mark (High Growth, Low Market Share)
- 4.3.4. Dogs (Low Growth, Low Market Share)
- 4.4. Ansoff Matrix Analysis
- 4.5. Supply Chain Analysis
- 4.6. Regulatory Landscape
- 4.7. Current Market Potential and Opportunity Assessment (TAM–SAM–SOM Framework)
- 4.8. IMR Analyst Note
- 4.1. Porters Five Forces
- 5. Market Analysis, Insights and Forecast 2021-2033
- 5.1. Market Analysis, Insights and Forecast - by Material Type
- 5.1.1. Carbon Steel
- 5.1.2. Stainless Steel
- 5.1.3. Aluminum Alloy
- 5.2. Market Analysis, Insights and Forecast - by Capacity
- 5.2.1. Below 20000 Liters
- 5.2.2. 30000 - 40000 Liters
- 5.2.3. Above 40000 Liters
- 5.3. Market Analysis, Insights and Forecast - by Fuel Type
- 5.3.1. Petrol
- 5.3.2. LNG
- 5.3.3. Other Fuels
- 5.4. Market Analysis, Insights and Forecast - by Operator
- 5.4.1. Retail Petrol Companies
- 5.4.2. Refineries
- 5.5. Market Analysis, Insights and Forecast - by Region
- 5.5.1. North America
- 5.5.2. Europe
- 5.5.3. Asia Pacific
- 5.5.4. Middle East and Africa
- 5.5.5. South America
- 5.1. Market Analysis, Insights and Forecast - by Material Type
- 6. Global Fuel Tanker Services Market Analysis, Insights and Forecast, 2021-2033
- 6.1. Market Analysis, Insights and Forecast - by Material Type
- 6.1.1. Carbon Steel
- 6.1.2. Stainless Steel
- 6.1.3. Aluminum Alloy
- 6.2. Market Analysis, Insights and Forecast - by Capacity
- 6.2.1. Below 20000 Liters
- 6.2.2. 30000 - 40000 Liters
- 6.2.3. Above 40000 Liters
- 6.3. Market Analysis, Insights and Forecast - by Fuel Type
- 6.3.1. Petrol
- 6.3.2. LNG
- 6.3.3. Other Fuels
- 6.4. Market Analysis, Insights and Forecast - by Operator
- 6.4.1. Retail Petrol Companies
- 6.4.2. Refineries
- 6.1. Market Analysis, Insights and Forecast - by Material Type
- 7. North America Fuel Tanker Services Market Analysis, Insights and Forecast, 2020-2032
- 7.1. Market Analysis, Insights and Forecast - by Material Type
- 7.1.1. Carbon Steel
- 7.1.2. Stainless Steel
- 7.1.3. Aluminum Alloy
- 7.2. Market Analysis, Insights and Forecast - by Capacity
- 7.2.1. Below 20000 Liters
- 7.2.2. 30000 - 40000 Liters
- 7.2.3. Above 40000 Liters
- 7.3. Market Analysis, Insights and Forecast - by Fuel Type
- 7.3.1. Petrol
- 7.3.2. LNG
- 7.3.3. Other Fuels
- 7.4. Market Analysis, Insights and Forecast - by Operator
- 7.4.1. Retail Petrol Companies
- 7.4.2. Refineries
- 7.1. Market Analysis, Insights and Forecast - by Material Type
- 8. Europe Fuel Tanker Services Market Analysis, Insights and Forecast, 2020-2032
- 8.1. Market Analysis, Insights and Forecast - by Material Type
- 8.1.1. Carbon Steel
- 8.1.2. Stainless Steel
- 8.1.3. Aluminum Alloy
- 8.2. Market Analysis, Insights and Forecast - by Capacity
- 8.2.1. Below 20000 Liters
- 8.2.2. 30000 - 40000 Liters
- 8.2.3. Above 40000 Liters
- 8.3. Market Analysis, Insights and Forecast - by Fuel Type
- 8.3.1. Petrol
- 8.3.2. LNG
- 8.3.3. Other Fuels
- 8.4. Market Analysis, Insights and Forecast - by Operator
- 8.4.1. Retail Petrol Companies
- 8.4.2. Refineries
- 8.1. Market Analysis, Insights and Forecast - by Material Type
- 9. Asia Pacific Fuel Tanker Services Market Analysis, Insights and Forecast, 2020-2032
- 9.1. Market Analysis, Insights and Forecast - by Material Type
- 9.1.1. Carbon Steel
- 9.1.2. Stainless Steel
- 9.1.3. Aluminum Alloy
- 9.2. Market Analysis, Insights and Forecast - by Capacity
- 9.2.1. Below 20000 Liters
- 9.2.2. 30000 - 40000 Liters
- 9.2.3. Above 40000 Liters
- 9.3. Market Analysis, Insights and Forecast - by Fuel Type
- 9.3.1. Petrol
- 9.3.2. LNG
- 9.3.3. Other Fuels
- 9.4. Market Analysis, Insights and Forecast - by Operator
- 9.4.1. Retail Petrol Companies
- 9.4.2. Refineries
- 9.1. Market Analysis, Insights and Forecast - by Material Type
- 10. Middle East and Africa Fuel Tanker Services Market Analysis, Insights and Forecast, 2020-2032
- 10.1. Market Analysis, Insights and Forecast - by Material Type
- 10.1.1. Carbon Steel
- 10.1.2. Stainless Steel
- 10.1.3. Aluminum Alloy
- 10.2. Market Analysis, Insights and Forecast - by Capacity
- 10.2.1. Below 20000 Liters
- 10.2.2. 30000 - 40000 Liters
- 10.2.3. Above 40000 Liters
- 10.3. Market Analysis, Insights and Forecast - by Fuel Type
- 10.3.1. Petrol
- 10.3.2. LNG
- 10.3.3. Other Fuels
- 10.4. Market Analysis, Insights and Forecast - by Operator
- 10.4.1. Retail Petrol Companies
- 10.4.2. Refineries
- 10.1. Market Analysis, Insights and Forecast - by Material Type
- 11. South America Fuel Tanker Services Market Analysis, Insights and Forecast, 2020-2032
- 11.1. Market Analysis, Insights and Forecast - by Material Type
- 11.1.1. Carbon Steel
- 11.1.2. Stainless Steel
- 11.1.3. Aluminum Alloy
- 11.2. Market Analysis, Insights and Forecast - by Capacity
- 11.2.1. Below 20000 Liters
- 11.2.2. 30000 - 40000 Liters
- 11.2.3. Above 40000 Liters
- 11.3. Market Analysis, Insights and Forecast - by Fuel Type
- 11.3.1. Petrol
- 11.3.2. LNG
- 11.3.3. Other Fuels
- 11.4. Market Analysis, Insights and Forecast - by Operator
- 11.4.1. Retail Petrol Companies
- 11.4.2. Refineries
- 11.1. Market Analysis, Insights and Forecast - by Material Type
- 12. Competitive Analysis
- 12.1. Company Profiles
- 12.1.1 Compass Fuel Oils Ltd
- 12.1.1.1. Company Overview
- 12.1.1.2. Products
- 12.1.1.3. Company Financials
- 12.1.1.4. SWOT Analysis
- 12.1.2 Rigual SA
- 12.1.2.1. Company Overview
- 12.1.2.2. Products
- 12.1.2.3. Company Financials
- 12.1.2.4. SWOT Analysis
- 12.1.3 Crown Oil Ltd
- 12.1.3.1. Company Overview
- 12.1.3.2. Products
- 12.1.3.3. Company Financials
- 12.1.3.4. SWOT Analysis
- 12.1.4 Shell International Trading and Shipping Company Limited*List Not Exhaustive
- 12.1.4.1. Company Overview
- 12.1.4.2. Products
- 12.1.4.3. Company Financials
- 12.1.4.4. SWOT Analysis
- 12.1.5 Certas Energy UK Limited
- 12.1.5.1. Company Overview
- 12.1.5.2. Products
- 12.1.5.3. Company Financials
- 12.1.5.4. SWOT Analysis
- 12.1.1 Compass Fuel Oils Ltd
- 12.2. Market Entropy
- 12.2.1 Company's Key Areas Served
- 12.2.2 Recent Developments
- 12.3. Company Market Share Analysis 2025
- 12.3.1 Top 5 Companies Market Share Analysis
- 12.3.2 Top 3 Companies Market Share Analysis
- 12.4. List of Potential Customers
- 13. Research Methodology
List of Figures
- Figure 1: Global Fuel Tanker Services Market Revenue Breakdown (Million, %) by Region 2025 & 2033
- Figure 2: North America Fuel Tanker Services Market Revenue (Million), by Material Type 2025 & 2033
- Figure 3: North America Fuel Tanker Services Market Revenue Share (%), by Material Type 2025 & 2033
- Figure 4: North America Fuel Tanker Services Market Revenue (Million), by Capacity 2025 & 2033
- Figure 5: North America Fuel Tanker Services Market Revenue Share (%), by Capacity 2025 & 2033
- Figure 6: North America Fuel Tanker Services Market Revenue (Million), by Fuel Type 2025 & 2033
- Figure 7: North America Fuel Tanker Services Market Revenue Share (%), by Fuel Type 2025 & 2033
- Figure 8: North America Fuel Tanker Services Market Revenue (Million), by Operator 2025 & 2033
- Figure 9: North America Fuel Tanker Services Market Revenue Share (%), by Operator 2025 & 2033
- Figure 10: North America Fuel Tanker Services Market Revenue (Million), by Country 2025 & 2033
- Figure 11: North America Fuel Tanker Services Market Revenue Share (%), by Country 2025 & 2033
- Figure 12: Europe Fuel Tanker Services Market Revenue (Million), by Material Type 2025 & 2033
- Figure 13: Europe Fuel Tanker Services Market Revenue Share (%), by Material Type 2025 & 2033
- Figure 14: Europe Fuel Tanker Services Market Revenue (Million), by Capacity 2025 & 2033
- Figure 15: Europe Fuel Tanker Services Market Revenue Share (%), by Capacity 2025 & 2033
- Figure 16: Europe Fuel Tanker Services Market Revenue (Million), by Fuel Type 2025 & 2033
- Figure 17: Europe Fuel Tanker Services Market Revenue Share (%), by Fuel Type 2025 & 2033
- Figure 18: Europe Fuel Tanker Services Market Revenue (Million), by Operator 2025 & 2033
- Figure 19: Europe Fuel Tanker Services Market Revenue Share (%), by Operator 2025 & 2033
- Figure 20: Europe Fuel Tanker Services Market Revenue (Million), by Country 2025 & 2033
- Figure 21: Europe Fuel Tanker Services Market Revenue Share (%), by Country 2025 & 2033
- Figure 22: Asia Pacific Fuel Tanker Services Market Revenue (Million), by Material Type 2025 & 2033
- Figure 23: Asia Pacific Fuel Tanker Services Market Revenue Share (%), by Material Type 2025 & 2033
- Figure 24: Asia Pacific Fuel Tanker Services Market Revenue (Million), by Capacity 2025 & 2033
- Figure 25: Asia Pacific Fuel Tanker Services Market Revenue Share (%), by Capacity 2025 & 2033
- Figure 26: Asia Pacific Fuel Tanker Services Market Revenue (Million), by Fuel Type 2025 & 2033
- Figure 27: Asia Pacific Fuel Tanker Services Market Revenue Share (%), by Fuel Type 2025 & 2033
- Figure 28: Asia Pacific Fuel Tanker Services Market Revenue (Million), by Operator 2025 & 2033
- Figure 29: Asia Pacific Fuel Tanker Services Market Revenue Share (%), by Operator 2025 & 2033
- Figure 30: Asia Pacific Fuel Tanker Services Market Revenue (Million), by Country 2025 & 2033
- Figure 31: Asia Pacific Fuel Tanker Services Market Revenue Share (%), by Country 2025 & 2033
- Figure 32: Middle East and Africa Fuel Tanker Services Market Revenue (Million), by Material Type 2025 & 2033
- Figure 33: Middle East and Africa Fuel Tanker Services Market Revenue Share (%), by Material Type 2025 & 2033
- Figure 34: Middle East and Africa Fuel Tanker Services Market Revenue (Million), by Capacity 2025 & 2033
- Figure 35: Middle East and Africa Fuel Tanker Services Market Revenue Share (%), by Capacity 2025 & 2033
- Figure 36: Middle East and Africa Fuel Tanker Services Market Revenue (Million), by Fuel Type 2025 & 2033
- Figure 37: Middle East and Africa Fuel Tanker Services Market Revenue Share (%), by Fuel Type 2025 & 2033
- Figure 38: Middle East and Africa Fuel Tanker Services Market Revenue (Million), by Operator 2025 & 2033
- Figure 39: Middle East and Africa Fuel Tanker Services Market Revenue Share (%), by Operator 2025 & 2033
- Figure 40: Middle East and Africa Fuel Tanker Services Market Revenue (Million), by Country 2025 & 2033
- Figure 41: Middle East and Africa Fuel Tanker Services Market Revenue Share (%), by Country 2025 & 2033
- Figure 42: South America Fuel Tanker Services Market Revenue (Million), by Material Type 2025 & 2033
- Figure 43: South America Fuel Tanker Services Market Revenue Share (%), by Material Type 2025 & 2033
- Figure 44: South America Fuel Tanker Services Market Revenue (Million), by Capacity 2025 & 2033
- Figure 45: South America Fuel Tanker Services Market Revenue Share (%), by Capacity 2025 & 2033
- Figure 46: South America Fuel Tanker Services Market Revenue (Million), by Fuel Type 2025 & 2033
- Figure 47: South America Fuel Tanker Services Market Revenue Share (%), by Fuel Type 2025 & 2033
- Figure 48: South America Fuel Tanker Services Market Revenue (Million), by Operator 2025 & 2033
- Figure 49: South America Fuel Tanker Services Market Revenue Share (%), by Operator 2025 & 2033
- Figure 50: South America Fuel Tanker Services Market Revenue (Million), by Country 2025 & 2033
- Figure 51: South America Fuel Tanker Services Market Revenue Share (%), by Country 2025 & 2033
List of Tables
- Table 1: Global Fuel Tanker Services Market Revenue Million Forecast, by Material Type 2020 & 2033
- Table 2: Global Fuel Tanker Services Market Revenue Million Forecast, by Capacity 2020 & 2033
- Table 3: Global Fuel Tanker Services Market Revenue Million Forecast, by Fuel Type 2020 & 2033
- Table 4: Global Fuel Tanker Services Market Revenue Million Forecast, by Operator 2020 & 2033
- Table 5: Global Fuel Tanker Services Market Revenue Million Forecast, by Region 2020 & 2033
- Table 6: Global Fuel Tanker Services Market Revenue Million Forecast, by Material Type 2020 & 2033
- Table 7: Global Fuel Tanker Services Market Revenue Million Forecast, by Capacity 2020 & 2033
- Table 8: Global Fuel Tanker Services Market Revenue Million Forecast, by Fuel Type 2020 & 2033
- Table 9: Global Fuel Tanker Services Market Revenue Million Forecast, by Operator 2020 & 2033
- Table 10: Global Fuel Tanker Services Market Revenue Million Forecast, by Country 2020 & 2033
- Table 11: United States Fuel Tanker Services Market Revenue (Million) Forecast, by Application 2020 & 2033
- Table 12: Canada Fuel Tanker Services Market Revenue (Million) Forecast, by Application 2020 & 2033
- Table 13: Rest of North America Fuel Tanker Services Market Revenue (Million) Forecast, by Application 2020 & 2033
- Table 14: Global Fuel Tanker Services Market Revenue Million Forecast, by Material Type 2020 & 2033
- Table 15: Global Fuel Tanker Services Market Revenue Million Forecast, by Capacity 2020 & 2033
- Table 16: Global Fuel Tanker Services Market Revenue Million Forecast, by Fuel Type 2020 & 2033
- Table 17: Global Fuel Tanker Services Market Revenue Million Forecast, by Operator 2020 & 2033
- Table 18: Global Fuel Tanker Services Market Revenue Million Forecast, by Country 2020 & 2033
- Table 19: Germany Fuel Tanker Services Market Revenue (Million) Forecast, by Application 2020 & 2033
- Table 20: France Fuel Tanker Services Market Revenue (Million) Forecast, by Application 2020 & 2033
- Table 21: United Kingdom Fuel Tanker Services Market Revenue (Million) Forecast, by Application 2020 & 2033
- Table 22: Italy Fuel Tanker Services Market Revenue (Million) Forecast, by Application 2020 & 2033
- Table 23: Spain Fuel Tanker Services Market Revenue (Million) Forecast, by Application 2020 & 2033
- Table 24: NORDIC Fuel Tanker Services Market Revenue (Million) Forecast, by Application 2020 & 2033
- Table 25: Russia Fuel Tanker Services Market Revenue (Million) Forecast, by Application 2020 & 2033
- Table 26: Rest of Europe Fuel Tanker Services Market Revenue (Million) Forecast, by Application 2020 & 2033
- Table 27: Global Fuel Tanker Services Market Revenue Million Forecast, by Material Type 2020 & 2033
- Table 28: Global Fuel Tanker Services Market Revenue Million Forecast, by Capacity 2020 & 2033
- Table 29: Global Fuel Tanker Services Market Revenue Million Forecast, by Fuel Type 2020 & 2033
- Table 30: Global Fuel Tanker Services Market Revenue Million Forecast, by Operator 2020 & 2033
- Table 31: Global Fuel Tanker Services Market Revenue Million Forecast, by Country 2020 & 2033
- Table 32: China Fuel Tanker Services Market Revenue (Million) Forecast, by Application 2020 & 2033
- Table 33: India Fuel Tanker Services Market Revenue (Million) Forecast, by Application 2020 & 2033
- Table 34: Australia Fuel Tanker Services Market Revenue (Million) Forecast, by Application 2020 & 2033
- Table 35: Malaysia Fuel Tanker Services Market Revenue (Million) Forecast, by Application 2020 & 2033
- Table 36: Indonesia Fuel Tanker Services Market Revenue (Million) Forecast, by Application 2020 & 2033
- Table 37: Thailand Fuel Tanker Services Market Revenue (Million) Forecast, by Application 2020 & 2033
- Table 38: Vietnam Fuel Tanker Services Market Revenue (Million) Forecast, by Application 2020 & 2033
- Table 39: Rest of Asia Pacific Fuel Tanker Services Market Revenue (Million) Forecast, by Application 2020 & 2033
- Table 40: Global Fuel Tanker Services Market Revenue Million Forecast, by Material Type 2020 & 2033
- Table 41: Global Fuel Tanker Services Market Revenue Million Forecast, by Capacity 2020 & 2033
- Table 42: Global Fuel Tanker Services Market Revenue Million Forecast, by Fuel Type 2020 & 2033
- Table 43: Global Fuel Tanker Services Market Revenue Million Forecast, by Operator 2020 & 2033
- Table 44: Global Fuel Tanker Services Market Revenue Million Forecast, by Country 2020 & 2033
- Table 45: Saudi Arabia Fuel Tanker Services Market Revenue (Million) Forecast, by Application 2020 & 2033
- Table 46: United Arab Emirates Fuel Tanker Services Market Revenue (Million) Forecast, by Application 2020 & 2033
- Table 47: South Africa Fuel Tanker Services Market Revenue (Million) Forecast, by Application 2020 & 2033
- Table 48: Nigeria Fuel Tanker Services Market Revenue (Million) Forecast, by Application 2020 & 2033
- Table 49: Rest of Middle East and Africa Fuel Tanker Services Market Revenue (Million) Forecast, by Application 2020 & 2033
- Table 50: Egypt Fuel Tanker Services Market Revenue (Million) Forecast, by Application 2020 & 2033
- Table 51: Global Fuel Tanker Services Market Revenue Million Forecast, by Material Type 2020 & 2033
- Table 52: Global Fuel Tanker Services Market Revenue Million Forecast, by Capacity 2020 & 2033
- Table 53: Global Fuel Tanker Services Market Revenue Million Forecast, by Fuel Type 2020 & 2033
- Table 54: Global Fuel Tanker Services Market Revenue Million Forecast, by Operator 2020 & 2033
- Table 55: Global Fuel Tanker Services Market Revenue Million Forecast, by Country 2020 & 2033
- Table 56: Brazil Fuel Tanker Services Market Revenue (Million) Forecast, by Application 2020 & 2033
- Table 57: Argentina Fuel Tanker Services Market Revenue (Million) Forecast, by Application 2020 & 2033
- Table 58: Colombia Fuel Tanker Services Market Revenue (Million) Forecast, by Application 2020 & 2033
- Table 59: Rest of South America Fuel Tanker Services Market Revenue (Million) Forecast, by Application 2020 & 2033
Frequently Asked Questions
1. What is the projected Compound Annual Growth Rate (CAGR) of the Fuel Tanker Services Market?
The projected CAGR is approximately 4.50%.
2. Which companies are prominent players in the Fuel Tanker Services Market?
Key companies in the market include Compass Fuel Oils Ltd, Rigual SA, Crown Oil Ltd, Shell International Trading and Shipping Company Limited*List Not Exhaustive, Certas Energy UK Limited.
3. What are the main segments of the Fuel Tanker Services Market?
The market segments include Material Type, Capacity, Fuel Type, Operator.
4. Can you provide details about the market size?
The market size is estimated to be USD 5.60 Million as of 2022.
5. What are some drivers contributing to market growth?
4.; Increasing Demand for Sales of Commercial Vehicles4.; Increasing Deployment of Retail Fuel Outlets Across Various Countries.
6. What are the notable trends driving market growth?
The LNG Segment is Expected to Dominate the Market.
7. Are there any restraints impacting market growth?
4.; Growing Penetration and Demand for Electric Vehicles.
8. Can you provide examples of recent developments in the market?
January 2024: Compass Fuel Oils Ltd announced the acquisition of a new Arctic fuel tanker, marking a significant addition to their expanding fleet at their headquarters in Preston, United Kingdom. This latest addition underscores the company’s commitment to enhancing its capacity.
9. What pricing options are available for accessing the report?
Pricing options include single-user, multi-user, and enterprise licenses priced at USD 4750, USD 5250, and USD 8750 respectively.
10. Is the market size provided in terms of value or volume?
The market size is provided in terms of value, measured in Million.
11. Are there any specific market keywords associated with the report?
Yes, the market keyword associated with the report is "Fuel Tanker Services Market," which aids in identifying and referencing the specific market segment covered.
12. How do I determine which pricing option suits my needs best?
The pricing options vary based on user requirements and access needs. Individual users may opt for single-user licenses, while businesses requiring broader access may choose multi-user or enterprise licenses for cost-effective access to the report.
13. Are there any additional resources or data provided in the Fuel Tanker Services Market report?
While the report offers comprehensive insights, it's advisable to review the specific contents or supplementary materials provided to ascertain if additional resources or data are available.
14. How can I stay updated on further developments or reports in the Fuel Tanker Services Market?
To stay informed about further developments, trends, and reports in the Fuel Tanker Services Market, consider subscribing to industry newsletters, following relevant companies and organizations, or regularly checking reputable industry news sources and publications.
Methodology
Step 1 - Identification of Relevant Samples Size from Population Database


Step 2 - Approaches for Defining Global Market Size (Value, Volume* & Price*)

Note*: In applicable scenarios
Step 3 - Data Sources
Primary Research
- Web Analytics
- Survey Reports
- Research Institute
- Latest Research Reports
- Opinion Leaders
Secondary Research
- Annual Reports
- White Paper
- Latest Press Release
- Industry Association
- Paid Database
- Investor Presentations

Step 4 - Data Triangulation
Involves using different sources of information in order to increase the validity of a study
These sources are likely to be stakeholders in a program - participants, other researchers, program staff, other community members, and so on.
Then we put all data in single framework & apply various statistical tools to find out the dynamic on the market.
During the analysis stage, feedback from the stakeholder groups would be compared to determine areas of agreement as well as areas of divergence