

Key Insights
The global industrial pumps market is projected for substantial growth, with an estimated market size of $48.2 billion in the base year 2025. The market is expected to expand at a Compound Annual Growth Rate (CAGR) of 4.75% from 2025 to 2033. This upward trajectory is primarily driven by increasing demand for efficient and reliable pumping solutions across key sectors including oil & gas, water & wastewater treatment, and chemical processing. Significant opportunities are also emerging from global infrastructure development initiatives, particularly in developing economies. Technological advancements, such as energy-efficient pump designs and smart monitoring systems, alongside stringent environmental regulations promoting sustainable water management and reduced energy consumption, are further bolstering market expansion. The market is segmented by pump type, with centrifugal pumps currently dominating due to their versatility and cost-effectiveness, and by end-user industry. The Asia-Pacific region is anticipated to lead growth due to rapid industrialization and infrastructure projects. However, challenges such as volatile raw material prices, supply chain disruptions, and potential economic downturns may impact investment in capital-intensive projects.
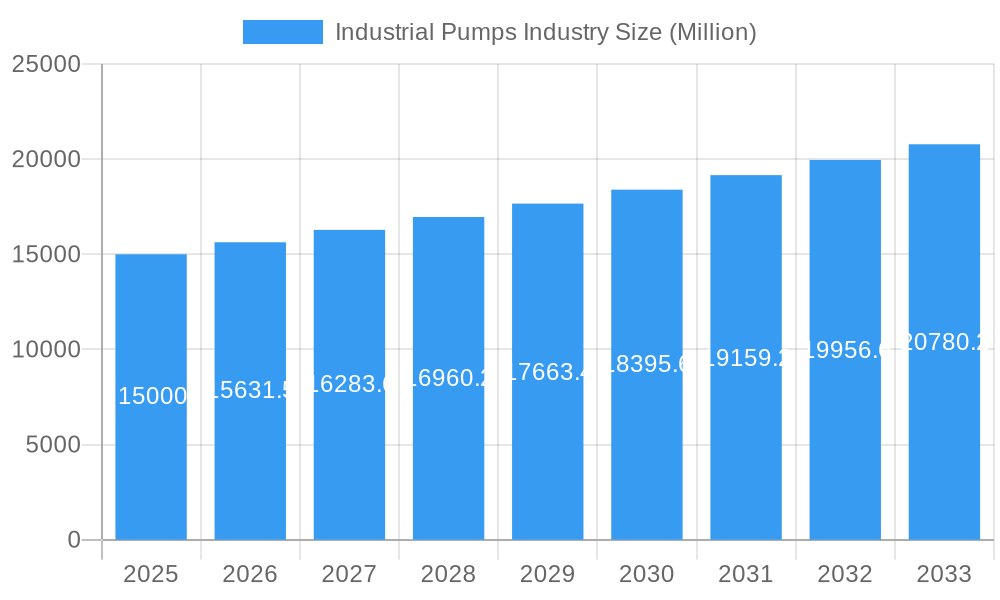
Industrial Pumps Industry Market Size (In Billion)
The competitive landscape features a mix of established global manufacturers and regional players. Key companies are actively investing in research and development to enhance product portfolios and secure market share. Strategic alliances, mergers, and acquisitions are expected to significantly influence industry dynamics. Competitive advantage will be gained through the provision of tailored industrial solutions and comprehensive after-sales support. Sustained growth hinges on effective supply chain risk management and adaptation to technological advancements, with a particular emphasis on sustainable and eco-friendly pump technologies prioritizing energy efficiency and minimal environmental impact.
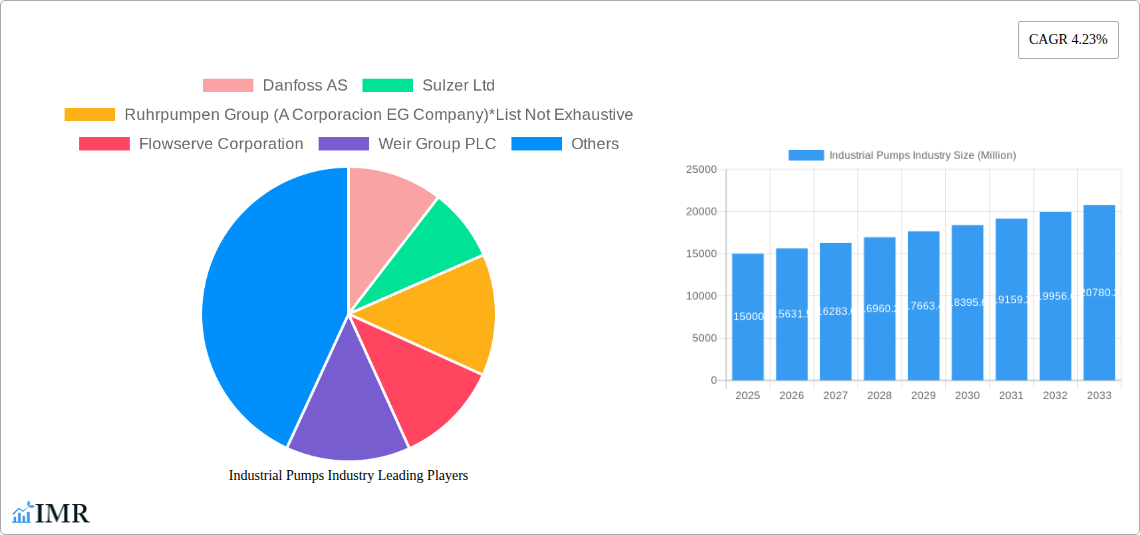
Industrial Pumps Industry Company Market Share
Industrial Pumps Industry Market Report: 2019-2033
This comprehensive report provides a detailed analysis of the global industrial pumps market, covering historical data (2019-2024), the current market (2025), and future projections (2025-2033). It delves into market dynamics, growth trends, regional performance, product landscapes, and key players, offering invaluable insights for industry professionals, investors, and strategic decision-makers. The report analyzes the parent market (Industrial Machinery) and its child market segments (various pump types and end-user industries) to provide a holistic view of this crucial sector. The market size is presented in million units.
Industrial Pumps Industry Market Dynamics & Structure
The industrial pumps market is characterized by moderate concentration, with several major players holding significant market share. Technological advancements, stringent environmental regulations, and the availability of competitive substitutes significantly influence market dynamics. Mergers and acquisitions (M&A) activity has been steady, reflecting consolidation efforts and expansion strategies within the industry. The market is segmented by end-user industry (Oil and Gas, Water and Wastewater, Chemicals and Petrochemicals, Mining, Power Generation, Other End-user Industries) and pump type (Centrifugal Pump, Reciprocating Pump, Rotary Pump, Other Pump Types).
- Market Concentration: The top 10 players hold an estimated xx% market share in 2025.
- Technological Innovation: Focus on energy efficiency, smart pumps, and digitalization is driving innovation. Barriers include high R&D costs and integration complexities.
- Regulatory Landscape: Environmental regulations (e.g., emissions standards) are driving demand for energy-efficient pumps.
- Competitive Substitutes: Alternative fluid handling technologies pose a moderate competitive threat.
- M&A Trends: An estimated xx M&A deals occurred in the industrial pumps sector between 2019 and 2024.
Industrial Pumps Industry Growth Trends & Insights
The global industrial pumps market experienced a compound annual growth rate (CAGR) of xx% during the historical period (2019-2024), reaching a market size of xx million units in 2025. This growth is attributed to increasing industrialization, infrastructure development, and rising demand across various end-user industries. Technological advancements, such as the adoption of smart pumps and digitalization, are further accelerating market expansion. Shifting consumer preferences towards energy efficiency and sustainability are also influencing market trends. The forecast period (2025-2033) projects a CAGR of xx%, reaching xx million units by 2033. Market penetration in developing economies is expected to increase significantly. Disruptive technologies, such as additive manufacturing and advanced materials, will reshape the product landscape.
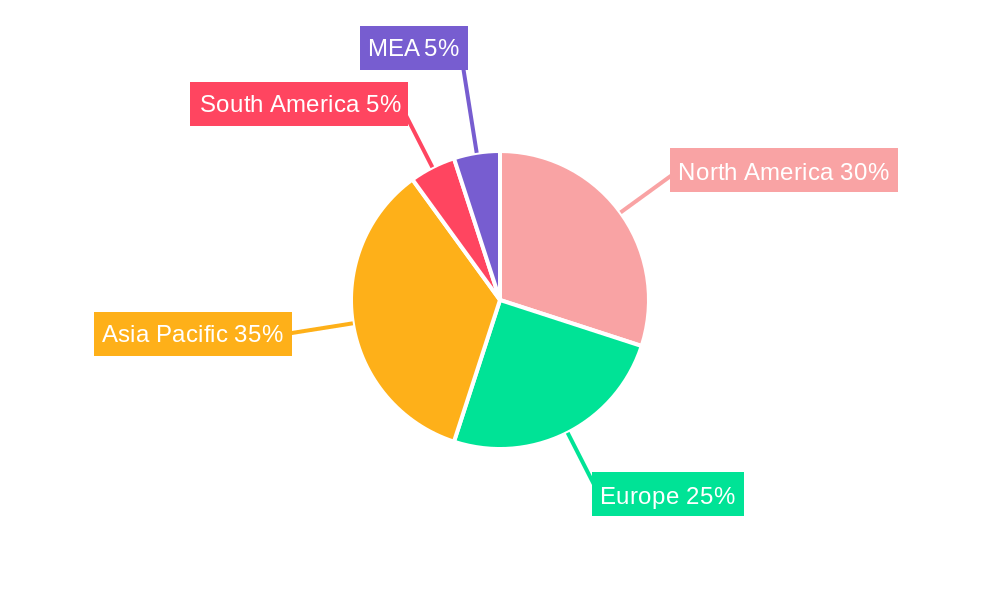
Dominant Regions, Countries, or Segments in Industrial Pumps Industry
The North American and European regions currently dominate the industrial pumps market, driven by robust industrial activity and substantial investments in infrastructure projects. However, the Asia-Pacific region is exhibiting the fastest growth rate due to rapid industrialization and urbanization.
Leading End-User Industries:
- Oil and Gas: High demand for robust pumps capable of handling harsh conditions.
- Water and Wastewater: Government initiatives promoting water infrastructure development.
- Chemicals and Petrochemicals: Need for pumps that handle corrosive and high-temperature fluids.
Leading Pump Types:
- Centrifugal Pumps: Dominate the market due to their versatility and cost-effectiveness.
- Reciprocating Pumps: High demand in specific applications requiring high pressure and precise flow control.
Industrial Pumps Industry Product Landscape
The industrial pump market offers a wide array of products tailored to specific applications, including centrifugal, reciprocating, rotary, and other specialized pump types. Recent innovations focus on enhanced energy efficiency, improved reliability, and advanced control systems. Manufacturers are emphasizing smart pumps equipped with sensors and connectivity features for predictive maintenance and optimized performance. Unique selling propositions include increased efficiency, reduced maintenance costs, and improved operational lifespan.
Key Drivers, Barriers & Challenges in Industrial Pumps Industry
Key Drivers:
- Growing industrialization and infrastructure development globally.
- Increasing demand for energy-efficient and sustainable pumps.
- Technological advancements in pump design and materials.
Key Challenges:
- Fluctuations in raw material prices and supply chain disruptions.
- Stringent environmental regulations and compliance costs.
- Intense competition from established and emerging players.
Emerging Opportunities in Industrial Pumps Industry
- Growing demand for pumps in renewable energy applications (e.g., hydrogen, solar).
- Expansion into untapped markets in developing economies.
- Development of specialized pumps for niche applications (e.g., pharmaceuticals, food processing).
Growth Accelerators in the Industrial Pumps Industry
Long-term growth in the industrial pumps industry will be propelled by continued technological innovation, strategic partnerships and collaborations, and expansion into new geographical markets. The increasing focus on sustainable solutions and the adoption of digital technologies will further accelerate market expansion.
Key Players Shaping the Industrial Pumps Industry Market
- Danfoss AS
- Sulzer Ltd
- Ruhrpumpen Group (A Corporacion EG Company)
- Flowserve Corporation
- Weir Group PLC
- Xylem Inc
- SPP Pumps Inc
- Clyde Union Inc
- Schlumberger Ltd
- Ebara Corp
- ITT Inc
- Grundfos Holding AS
- Dover Corporation
- SPX Flow Inc
- Baker Hughes Company
- Wilo Mather & Platt Pumps Pvt Ltd
- KSB AG
- General Electric Company
Notable Milestones in Industrial Pumps Industry Sector
- June 2022: Flowserve Corporation secured a contract to provide pumps for immersion cooling technology.
- January 2023: Sulzer launched an updated submersible recirculation pump with a 20% efficiency improvement.
- February 2023: EBARA Corporation developed one of the world's first liquid hydrogen booster pumps.
In-Depth Industrial Pumps Industry Market Outlook
The future of the industrial pumps market looks promising, driven by sustained growth in end-user industries, ongoing technological advancements, and increasing adoption of sustainable solutions. Strategic investments in research and development, coupled with strategic partnerships and acquisitions, will further shape market dynamics. The market is poised for significant expansion, presenting lucrative opportunities for both established players and emerging market entrants.
Industrial Pumps Industry Segmentation
-
1. Type
- 1.1. Centrifugal Pump
- 1.2. Reciprocating Pump
- 1.3. Rotary Pump
- 1.4. Other Pump Types
-
2. End-user Industry
- 2.1. Oil and Gas
- 2.2. Water and Wastewater
- 2.3. Chemicals and Petrochemicals
- 2.4. Mining
- 2.5. Power Generation
- 2.6. Other End-user Industries
Industrial Pumps Industry Segmentation By Geography
-
1. North America
- 1.1. United States of America
- 1.2. Canada
- 1.3. Rest of the North America
-
2. Asia Pacific
- 2.1. India
- 2.2. China
- 2.3. South Korea
- 2.4. Rest of the Asia Pacific
-
3. Europe
- 3.1. Germany
- 3.2. United Kingdom
- 3.3. France
- 3.4. Italy
- 3.5. Rest of the Europe
-
4. South America
- 4.1. Brazil
- 4.2. Argentina
- 4.3. Rest of the South America
-
5. Middle East and Africa
- 5.1. United Arab Emirates
- 5.2. Saudi Arabia
- 5.3. Iraq
- 5.4. Rest of the Middle East and Africa
Industrial Pumps Industry Regional Market Share
Geographic Coverage of Industrial Pumps Industry
Industrial Pumps Industry REPORT HIGHLIGHTS
| Aspects | Details |
|---|---|
| Study Period | 2020-2034 |
| Base Year | 2025 |
| Estimated Year | 2026 |
| Forecast Period | 2026-2034 |
| Historical Period | 2020-2025 |
| Growth Rate | CAGR of 4.75% from 2020-2034 |
| Segmentation |
|
Table of Contents
- 1. Introduction
- 1.1. Research Scope
- 1.2. Market Segmentation
- 1.3. Research Objective
- 1.4. Definitions and Assumptions
- 2. Executive Summary
- 2.1. Market Snapshot
- 3. Market Dynamics
- 3.1. Market Drivers
- 3.2. Market Restrains
- 3.3. Market Trends
- 3.4. Market Opportunities
- 4. Market Factor Analysis
- 4.1. Porters Five Forces
- 4.1.1. Bargaining Power of Suppliers
- 4.1.2. Bargaining Power of Buyers
- 4.1.3. Threat of New Entrants
- 4.1.4. Threat of Substitutes
- 4.1.5. Competitive Rivalry
- 4.2. PESTEL analysis
- 4.3. BCG Analysis
- 4.3.1. Stars (High Growth, High Market Share)
- 4.3.2. Cash Cows (Low Growth, High Market Share)
- 4.3.3. Question Mark (High Growth, Low Market Share)
- 4.3.4. Dogs (Low Growth, Low Market Share)
- 4.4. Ansoff Matrix Analysis
- 4.5. Supply Chain Analysis
- 4.6. Regulatory Landscape
- 4.7. Current Market Potential and Opportunity Assessment (TAM–SAM–SOM Framework)
- 4.8. IMR Analyst Note
- 4.1. Porters Five Forces
- 5. Market Analysis, Insights and Forecast 2021-2033
- 5.1. Market Analysis, Insights and Forecast - by Type
- 5.1.1. Centrifugal Pump
- 5.1.2. Reciprocating Pump
- 5.1.3. Rotary Pump
- 5.1.4. Other Pump Types
- 5.2. Market Analysis, Insights and Forecast - by End-user Industry
- 5.2.1. Oil and Gas
- 5.2.2. Water and Wastewater
- 5.2.3. Chemicals and Petrochemicals
- 5.2.4. Mining
- 5.2.5. Power Generation
- 5.2.6. Other End-user Industries
- 5.3. Market Analysis, Insights and Forecast - by Region
- 5.3.1. North America
- 5.3.2. Asia Pacific
- 5.3.3. Europe
- 5.3.4. South America
- 5.3.5. Middle East and Africa
- 5.1. Market Analysis, Insights and Forecast - by Type
- 6. Global Industrial Pumps Industry Analysis, Insights and Forecast, 2021-2033
- 6.1. Market Analysis, Insights and Forecast - by Type
- 6.1.1. Centrifugal Pump
- 6.1.2. Reciprocating Pump
- 6.1.3. Rotary Pump
- 6.1.4. Other Pump Types
- 6.2. Market Analysis, Insights and Forecast - by End-user Industry
- 6.2.1. Oil and Gas
- 6.2.2. Water and Wastewater
- 6.2.3. Chemicals and Petrochemicals
- 6.2.4. Mining
- 6.2.5. Power Generation
- 6.2.6. Other End-user Industries
- 6.1. Market Analysis, Insights and Forecast - by Type
- 7. North America Industrial Pumps Industry Analysis, Insights and Forecast, 2020-2032
- 7.1. Market Analysis, Insights and Forecast - by Type
- 7.1.1. Centrifugal Pump
- 7.1.2. Reciprocating Pump
- 7.1.3. Rotary Pump
- 7.1.4. Other Pump Types
- 7.2. Market Analysis, Insights and Forecast - by End-user Industry
- 7.2.1. Oil and Gas
- 7.2.2. Water and Wastewater
- 7.2.3. Chemicals and Petrochemicals
- 7.2.4. Mining
- 7.2.5. Power Generation
- 7.2.6. Other End-user Industries
- 7.1. Market Analysis, Insights and Forecast - by Type
- 8. Asia Pacific Industrial Pumps Industry Analysis, Insights and Forecast, 2020-2032
- 8.1. Market Analysis, Insights and Forecast - by Type
- 8.1.1. Centrifugal Pump
- 8.1.2. Reciprocating Pump
- 8.1.3. Rotary Pump
- 8.1.4. Other Pump Types
- 8.2. Market Analysis, Insights and Forecast - by End-user Industry
- 8.2.1. Oil and Gas
- 8.2.2. Water and Wastewater
- 8.2.3. Chemicals and Petrochemicals
- 8.2.4. Mining
- 8.2.5. Power Generation
- 8.2.6. Other End-user Industries
- 8.1. Market Analysis, Insights and Forecast - by Type
- 9. Europe Industrial Pumps Industry Analysis, Insights and Forecast, 2020-2032
- 9.1. Market Analysis, Insights and Forecast - by Type
- 9.1.1. Centrifugal Pump
- 9.1.2. Reciprocating Pump
- 9.1.3. Rotary Pump
- 9.1.4. Other Pump Types
- 9.2. Market Analysis, Insights and Forecast - by End-user Industry
- 9.2.1. Oil and Gas
- 9.2.2. Water and Wastewater
- 9.2.3. Chemicals and Petrochemicals
- 9.2.4. Mining
- 9.2.5. Power Generation
- 9.2.6. Other End-user Industries
- 9.1. Market Analysis, Insights and Forecast - by Type
- 10. South America Industrial Pumps Industry Analysis, Insights and Forecast, 2020-2032
- 10.1. Market Analysis, Insights and Forecast - by Type
- 10.1.1. Centrifugal Pump
- 10.1.2. Reciprocating Pump
- 10.1.3. Rotary Pump
- 10.1.4. Other Pump Types
- 10.2. Market Analysis, Insights and Forecast - by End-user Industry
- 10.2.1. Oil and Gas
- 10.2.2. Water and Wastewater
- 10.2.3. Chemicals and Petrochemicals
- 10.2.4. Mining
- 10.2.5. Power Generation
- 10.2.6. Other End-user Industries
- 10.1. Market Analysis, Insights and Forecast - by Type
- 11. Middle East and Africa Industrial Pumps Industry Analysis, Insights and Forecast, 2020-2032
- 11.1. Market Analysis, Insights and Forecast - by Type
- 11.1.1. Centrifugal Pump
- 11.1.2. Reciprocating Pump
- 11.1.3. Rotary Pump
- 11.1.4. Other Pump Types
- 11.2. Market Analysis, Insights and Forecast - by End-user Industry
- 11.2.1. Oil and Gas
- 11.2.2. Water and Wastewater
- 11.2.3. Chemicals and Petrochemicals
- 11.2.4. Mining
- 11.2.5. Power Generation
- 11.2.6. Other End-user Industries
- 11.1. Market Analysis, Insights and Forecast - by Type
- 12. Competitive Analysis
- 12.1. Company Profiles
- 12.1.1 Danfoss AS
- 12.1.1.1. Company Overview
- 12.1.1.2. Products
- 12.1.1.3. Company Financials
- 12.1.1.4. SWOT Analysis
- 12.1.2 Sulzer Ltd
- 12.1.2.1. Company Overview
- 12.1.2.2. Products
- 12.1.2.3. Company Financials
- 12.1.2.4. SWOT Analysis
- 12.1.3 Ruhrpumpen Group (A Corporacion EG Company)*List Not Exhaustive
- 12.1.3.1. Company Overview
- 12.1.3.2. Products
- 12.1.3.3. Company Financials
- 12.1.3.4. SWOT Analysis
- 12.1.4 Flowserve Corporation
- 12.1.4.1. Company Overview
- 12.1.4.2. Products
- 12.1.4.3. Company Financials
- 12.1.4.4. SWOT Analysis
- 12.1.5 Weir Group PLC
- 12.1.5.1. Company Overview
- 12.1.5.2. Products
- 12.1.5.3. Company Financials
- 12.1.5.4. SWOT Analysis
- 12.1.6 Xylem Inc
- 12.1.6.1. Company Overview
- 12.1.6.2. Products
- 12.1.6.3. Company Financials
- 12.1.6.4. SWOT Analysis
- 12.1.7 SPP Pumps Inc
- 12.1.7.1. Company Overview
- 12.1.7.2. Products
- 12.1.7.3. Company Financials
- 12.1.7.4. SWOT Analysis
- 12.1.8 Clyde Union Inc
- 12.1.8.1. Company Overview
- 12.1.8.2. Products
- 12.1.8.3. Company Financials
- 12.1.8.4. SWOT Analysis
- 12.1.9 Schlumberger Ltd
- 12.1.9.1. Company Overview
- 12.1.9.2. Products
- 12.1.9.3. Company Financials
- 12.1.9.4. SWOT Analysis
- 12.1.10 Ebara Corp
- 12.1.10.1. Company Overview
- 12.1.10.2. Products
- 12.1.10.3. Company Financials
- 12.1.10.4. SWOT Analysis
- 12.1.11 ITT Inc
- 12.1.11.1. Company Overview
- 12.1.11.2. Products
- 12.1.11.3. Company Financials
- 12.1.11.4. SWOT Analysis
- 12.1.12 Grundfos Holding AS
- 12.1.12.1. Company Overview
- 12.1.12.2. Products
- 12.1.12.3. Company Financials
- 12.1.12.4. SWOT Analysis
- 12.1.13 Dover Corporation
- 12.1.13.1. Company Overview
- 12.1.13.2. Products
- 12.1.13.3. Company Financials
- 12.1.13.4. SWOT Analysis
- 12.1.14 SPX Flow Inc
- 12.1.14.1. Company Overview
- 12.1.14.2. Products
- 12.1.14.3. Company Financials
- 12.1.14.4. SWOT Analysis
- 12.1.15 Baker Hughes Company
- 12.1.15.1. Company Overview
- 12.1.15.2. Products
- 12.1.15.3. Company Financials
- 12.1.15.4. SWOT Analysis
- 12.1.16 Wilo Mather & Platt Pumps Pvt Ltd
- 12.1.16.1. Company Overview
- 12.1.16.2. Products
- 12.1.16.3. Company Financials
- 12.1.16.4. SWOT Analysis
- 12.1.17 KSB AG
- 12.1.17.1. Company Overview
- 12.1.17.2. Products
- 12.1.17.3. Company Financials
- 12.1.17.4. SWOT Analysis
- 12.1.18 General Electric Company
- 12.1.18.1. Company Overview
- 12.1.18.2. Products
- 12.1.18.3. Company Financials
- 12.1.18.4. SWOT Analysis
- 12.1.1 Danfoss AS
- 12.2. Market Entropy
- 12.2.1 Company's Key Areas Served
- 12.2.2 Recent Developments
- 12.3. Company Market Share Analysis 2025
- 12.3.1 Top 5 Companies Market Share Analysis
- 12.3.2 Top 3 Companies Market Share Analysis
- 12.4. List of Potential Customers
- 13. Research Methodology
List of Figures
- Figure 1: Global Industrial Pumps Industry Revenue Breakdown (billion, %) by Region 2025 & 2033
- Figure 2: Global Industrial Pumps Industry Volume Breakdown (K Unit, %) by Region 2025 & 2033
- Figure 3: North America Industrial Pumps Industry Revenue (billion), by Type 2025 & 2033
- Figure 4: North America Industrial Pumps Industry Volume (K Unit), by Type 2025 & 2033
- Figure 5: North America Industrial Pumps Industry Revenue Share (%), by Type 2025 & 2033
- Figure 6: North America Industrial Pumps Industry Volume Share (%), by Type 2025 & 2033
- Figure 7: North America Industrial Pumps Industry Revenue (billion), by End-user Industry 2025 & 2033
- Figure 8: North America Industrial Pumps Industry Volume (K Unit), by End-user Industry 2025 & 2033
- Figure 9: North America Industrial Pumps Industry Revenue Share (%), by End-user Industry 2025 & 2033
- Figure 10: North America Industrial Pumps Industry Volume Share (%), by End-user Industry 2025 & 2033
- Figure 11: North America Industrial Pumps Industry Revenue (billion), by Country 2025 & 2033
- Figure 12: North America Industrial Pumps Industry Volume (K Unit), by Country 2025 & 2033
- Figure 13: North America Industrial Pumps Industry Revenue Share (%), by Country 2025 & 2033
- Figure 14: North America Industrial Pumps Industry Volume Share (%), by Country 2025 & 2033
- Figure 15: Asia Pacific Industrial Pumps Industry Revenue (billion), by Type 2025 & 2033
- Figure 16: Asia Pacific Industrial Pumps Industry Volume (K Unit), by Type 2025 & 2033
- Figure 17: Asia Pacific Industrial Pumps Industry Revenue Share (%), by Type 2025 & 2033
- Figure 18: Asia Pacific Industrial Pumps Industry Volume Share (%), by Type 2025 & 2033
- Figure 19: Asia Pacific Industrial Pumps Industry Revenue (billion), by End-user Industry 2025 & 2033
- Figure 20: Asia Pacific Industrial Pumps Industry Volume (K Unit), by End-user Industry 2025 & 2033
- Figure 21: Asia Pacific Industrial Pumps Industry Revenue Share (%), by End-user Industry 2025 & 2033
- Figure 22: Asia Pacific Industrial Pumps Industry Volume Share (%), by End-user Industry 2025 & 2033
- Figure 23: Asia Pacific Industrial Pumps Industry Revenue (billion), by Country 2025 & 2033
- Figure 24: Asia Pacific Industrial Pumps Industry Volume (K Unit), by Country 2025 & 2033
- Figure 25: Asia Pacific Industrial Pumps Industry Revenue Share (%), by Country 2025 & 2033
- Figure 26: Asia Pacific Industrial Pumps Industry Volume Share (%), by Country 2025 & 2033
- Figure 27: Europe Industrial Pumps Industry Revenue (billion), by Type 2025 & 2033
- Figure 28: Europe Industrial Pumps Industry Volume (K Unit), by Type 2025 & 2033
- Figure 29: Europe Industrial Pumps Industry Revenue Share (%), by Type 2025 & 2033
- Figure 30: Europe Industrial Pumps Industry Volume Share (%), by Type 2025 & 2033
- Figure 31: Europe Industrial Pumps Industry Revenue (billion), by End-user Industry 2025 & 2033
- Figure 32: Europe Industrial Pumps Industry Volume (K Unit), by End-user Industry 2025 & 2033
- Figure 33: Europe Industrial Pumps Industry Revenue Share (%), by End-user Industry 2025 & 2033
- Figure 34: Europe Industrial Pumps Industry Volume Share (%), by End-user Industry 2025 & 2033
- Figure 35: Europe Industrial Pumps Industry Revenue (billion), by Country 2025 & 2033
- Figure 36: Europe Industrial Pumps Industry Volume (K Unit), by Country 2025 & 2033
- Figure 37: Europe Industrial Pumps Industry Revenue Share (%), by Country 2025 & 2033
- Figure 38: Europe Industrial Pumps Industry Volume Share (%), by Country 2025 & 2033
- Figure 39: South America Industrial Pumps Industry Revenue (billion), by Type 2025 & 2033
- Figure 40: South America Industrial Pumps Industry Volume (K Unit), by Type 2025 & 2033
- Figure 41: South America Industrial Pumps Industry Revenue Share (%), by Type 2025 & 2033
- Figure 42: South America Industrial Pumps Industry Volume Share (%), by Type 2025 & 2033
- Figure 43: South America Industrial Pumps Industry Revenue (billion), by End-user Industry 2025 & 2033
- Figure 44: South America Industrial Pumps Industry Volume (K Unit), by End-user Industry 2025 & 2033
- Figure 45: South America Industrial Pumps Industry Revenue Share (%), by End-user Industry 2025 & 2033
- Figure 46: South America Industrial Pumps Industry Volume Share (%), by End-user Industry 2025 & 2033
- Figure 47: South America Industrial Pumps Industry Revenue (billion), by Country 2025 & 2033
- Figure 48: South America Industrial Pumps Industry Volume (K Unit), by Country 2025 & 2033
- Figure 49: South America Industrial Pumps Industry Revenue Share (%), by Country 2025 & 2033
- Figure 50: South America Industrial Pumps Industry Volume Share (%), by Country 2025 & 2033
- Figure 51: Middle East and Africa Industrial Pumps Industry Revenue (billion), by Type 2025 & 2033
- Figure 52: Middle East and Africa Industrial Pumps Industry Volume (K Unit), by Type 2025 & 2033
- Figure 53: Middle East and Africa Industrial Pumps Industry Revenue Share (%), by Type 2025 & 2033
- Figure 54: Middle East and Africa Industrial Pumps Industry Volume Share (%), by Type 2025 & 2033
- Figure 55: Middle East and Africa Industrial Pumps Industry Revenue (billion), by End-user Industry 2025 & 2033
- Figure 56: Middle East and Africa Industrial Pumps Industry Volume (K Unit), by End-user Industry 2025 & 2033
- Figure 57: Middle East and Africa Industrial Pumps Industry Revenue Share (%), by End-user Industry 2025 & 2033
- Figure 58: Middle East and Africa Industrial Pumps Industry Volume Share (%), by End-user Industry 2025 & 2033
- Figure 59: Middle East and Africa Industrial Pumps Industry Revenue (billion), by Country 2025 & 2033
- Figure 60: Middle East and Africa Industrial Pumps Industry Volume (K Unit), by Country 2025 & 2033
- Figure 61: Middle East and Africa Industrial Pumps Industry Revenue Share (%), by Country 2025 & 2033
- Figure 62: Middle East and Africa Industrial Pumps Industry Volume Share (%), by Country 2025 & 2033
List of Tables
- Table 1: Global Industrial Pumps Industry Revenue billion Forecast, by Type 2020 & 2033
- Table 2: Global Industrial Pumps Industry Volume K Unit Forecast, by Type 2020 & 2033
- Table 3: Global Industrial Pumps Industry Revenue billion Forecast, by End-user Industry 2020 & 2033
- Table 4: Global Industrial Pumps Industry Volume K Unit Forecast, by End-user Industry 2020 & 2033
- Table 5: Global Industrial Pumps Industry Revenue billion Forecast, by Region 2020 & 2033
- Table 6: Global Industrial Pumps Industry Volume K Unit Forecast, by Region 2020 & 2033
- Table 7: Global Industrial Pumps Industry Revenue billion Forecast, by Type 2020 & 2033
- Table 8: Global Industrial Pumps Industry Volume K Unit Forecast, by Type 2020 & 2033
- Table 9: Global Industrial Pumps Industry Revenue billion Forecast, by End-user Industry 2020 & 2033
- Table 10: Global Industrial Pumps Industry Volume K Unit Forecast, by End-user Industry 2020 & 2033
- Table 11: Global Industrial Pumps Industry Revenue billion Forecast, by Country 2020 & 2033
- Table 12: Global Industrial Pumps Industry Volume K Unit Forecast, by Country 2020 & 2033
- Table 13: United States of America Industrial Pumps Industry Revenue (billion) Forecast, by Application 2020 & 2033
- Table 14: United States of America Industrial Pumps Industry Volume (K Unit) Forecast, by Application 2020 & 2033
- Table 15: Canada Industrial Pumps Industry Revenue (billion) Forecast, by Application 2020 & 2033
- Table 16: Canada Industrial Pumps Industry Volume (K Unit) Forecast, by Application 2020 & 2033
- Table 17: Rest of the North America Industrial Pumps Industry Revenue (billion) Forecast, by Application 2020 & 2033
- Table 18: Rest of the North America Industrial Pumps Industry Volume (K Unit) Forecast, by Application 2020 & 2033
- Table 19: Global Industrial Pumps Industry Revenue billion Forecast, by Type 2020 & 2033
- Table 20: Global Industrial Pumps Industry Volume K Unit Forecast, by Type 2020 & 2033
- Table 21: Global Industrial Pumps Industry Revenue billion Forecast, by End-user Industry 2020 & 2033
- Table 22: Global Industrial Pumps Industry Volume K Unit Forecast, by End-user Industry 2020 & 2033
- Table 23: Global Industrial Pumps Industry Revenue billion Forecast, by Country 2020 & 2033
- Table 24: Global Industrial Pumps Industry Volume K Unit Forecast, by Country 2020 & 2033
- Table 25: India Industrial Pumps Industry Revenue (billion) Forecast, by Application 2020 & 2033
- Table 26: India Industrial Pumps Industry Volume (K Unit) Forecast, by Application 2020 & 2033
- Table 27: China Industrial Pumps Industry Revenue (billion) Forecast, by Application 2020 & 2033
- Table 28: China Industrial Pumps Industry Volume (K Unit) Forecast, by Application 2020 & 2033
- Table 29: South Korea Industrial Pumps Industry Revenue (billion) Forecast, by Application 2020 & 2033
- Table 30: South Korea Industrial Pumps Industry Volume (K Unit) Forecast, by Application 2020 & 2033
- Table 31: Rest of the Asia Pacific Industrial Pumps Industry Revenue (billion) Forecast, by Application 2020 & 2033
- Table 32: Rest of the Asia Pacific Industrial Pumps Industry Volume (K Unit) Forecast, by Application 2020 & 2033
- Table 33: Global Industrial Pumps Industry Revenue billion Forecast, by Type 2020 & 2033
- Table 34: Global Industrial Pumps Industry Volume K Unit Forecast, by Type 2020 & 2033
- Table 35: Global Industrial Pumps Industry Revenue billion Forecast, by End-user Industry 2020 & 2033
- Table 36: Global Industrial Pumps Industry Volume K Unit Forecast, by End-user Industry 2020 & 2033
- Table 37: Global Industrial Pumps Industry Revenue billion Forecast, by Country 2020 & 2033
- Table 38: Global Industrial Pumps Industry Volume K Unit Forecast, by Country 2020 & 2033
- Table 39: Germany Industrial Pumps Industry Revenue (billion) Forecast, by Application 2020 & 2033
- Table 40: Germany Industrial Pumps Industry Volume (K Unit) Forecast, by Application 2020 & 2033
- Table 41: United Kingdom Industrial Pumps Industry Revenue (billion) Forecast, by Application 2020 & 2033
- Table 42: United Kingdom Industrial Pumps Industry Volume (K Unit) Forecast, by Application 2020 & 2033
- Table 43: France Industrial Pumps Industry Revenue (billion) Forecast, by Application 2020 & 2033
- Table 44: France Industrial Pumps Industry Volume (K Unit) Forecast, by Application 2020 & 2033
- Table 45: Italy Industrial Pumps Industry Revenue (billion) Forecast, by Application 2020 & 2033
- Table 46: Italy Industrial Pumps Industry Volume (K Unit) Forecast, by Application 2020 & 2033
- Table 47: Rest of the Europe Industrial Pumps Industry Revenue (billion) Forecast, by Application 2020 & 2033
- Table 48: Rest of the Europe Industrial Pumps Industry Volume (K Unit) Forecast, by Application 2020 & 2033
- Table 49: Global Industrial Pumps Industry Revenue billion Forecast, by Type 2020 & 2033
- Table 50: Global Industrial Pumps Industry Volume K Unit Forecast, by Type 2020 & 2033
- Table 51: Global Industrial Pumps Industry Revenue billion Forecast, by End-user Industry 2020 & 2033
- Table 52: Global Industrial Pumps Industry Volume K Unit Forecast, by End-user Industry 2020 & 2033
- Table 53: Global Industrial Pumps Industry Revenue billion Forecast, by Country 2020 & 2033
- Table 54: Global Industrial Pumps Industry Volume K Unit Forecast, by Country 2020 & 2033
- Table 55: Brazil Industrial Pumps Industry Revenue (billion) Forecast, by Application 2020 & 2033
- Table 56: Brazil Industrial Pumps Industry Volume (K Unit) Forecast, by Application 2020 & 2033
- Table 57: Argentina Industrial Pumps Industry Revenue (billion) Forecast, by Application 2020 & 2033
- Table 58: Argentina Industrial Pumps Industry Volume (K Unit) Forecast, by Application 2020 & 2033
- Table 59: Rest of the South America Industrial Pumps Industry Revenue (billion) Forecast, by Application 2020 & 2033
- Table 60: Rest of the South America Industrial Pumps Industry Volume (K Unit) Forecast, by Application 2020 & 2033
- Table 61: Global Industrial Pumps Industry Revenue billion Forecast, by Type 2020 & 2033
- Table 62: Global Industrial Pumps Industry Volume K Unit Forecast, by Type 2020 & 2033
- Table 63: Global Industrial Pumps Industry Revenue billion Forecast, by End-user Industry 2020 & 2033
- Table 64: Global Industrial Pumps Industry Volume K Unit Forecast, by End-user Industry 2020 & 2033
- Table 65: Global Industrial Pumps Industry Revenue billion Forecast, by Country 2020 & 2033
- Table 66: Global Industrial Pumps Industry Volume K Unit Forecast, by Country 2020 & 2033
- Table 67: United Arab Emirates Industrial Pumps Industry Revenue (billion) Forecast, by Application 2020 & 2033
- Table 68: United Arab Emirates Industrial Pumps Industry Volume (K Unit) Forecast, by Application 2020 & 2033
- Table 69: Saudi Arabia Industrial Pumps Industry Revenue (billion) Forecast, by Application 2020 & 2033
- Table 70: Saudi Arabia Industrial Pumps Industry Volume (K Unit) Forecast, by Application 2020 & 2033
- Table 71: Iraq Industrial Pumps Industry Revenue (billion) Forecast, by Application 2020 & 2033
- Table 72: Iraq Industrial Pumps Industry Volume (K Unit) Forecast, by Application 2020 & 2033
- Table 73: Rest of the Middle East and Africa Industrial Pumps Industry Revenue (billion) Forecast, by Application 2020 & 2033
- Table 74: Rest of the Middle East and Africa Industrial Pumps Industry Volume (K Unit) Forecast, by Application 2020 & 2033
Frequently Asked Questions
1. What is the projected Compound Annual Growth Rate (CAGR) of the Industrial Pumps Industry?
The projected CAGR is approximately 4.75%.
2. Which companies are prominent players in the Industrial Pumps Industry?
Key companies in the market include Danfoss AS, Sulzer Ltd, Ruhrpumpen Group (A Corporacion EG Company)*List Not Exhaustive, Flowserve Corporation, Weir Group PLC, Xylem Inc, SPP Pumps Inc, Clyde Union Inc, Schlumberger Ltd, Ebara Corp, ITT Inc, Grundfos Holding AS, Dover Corporation, SPX Flow Inc, Baker Hughes Company, Wilo Mather & Platt Pumps Pvt Ltd, KSB AG, General Electric Company.
3. What are the main segments of the Industrial Pumps Industry?
The market segments include Type, End-user Industry.
4. Can you provide details about the market size?
The market size is estimated to be USD 48.2 billion as of 2022.
5. What are some drivers contributing to market growth?
Increasing Petrochemical Industries In Middle East & African Region4.; Increasing Industrialization Across the World.
6. What are the notable trends driving market growth?
Centrifugal Pumps to Have a Significant Demand.
7. Are there any restraints impacting market growth?
Stringent Government Regulations and Policies to Reduce Carbon Emissions.
8. Can you provide examples of recent developments in the market?
February 2023: EBARA Corporation successfully developed one of the world's first liquid hydrogen booster pumps for hydrogen power generation, consistent with the global expansion of the hydrogen market.
9. What pricing options are available for accessing the report?
Pricing options include single-user, multi-user, and enterprise licenses priced at USD 4750, USD 5250, and USD 8750 respectively.
10. Is the market size provided in terms of value or volume?
The market size is provided in terms of value, measured in billion and volume, measured in K Unit.
11. Are there any specific market keywords associated with the report?
Yes, the market keyword associated with the report is "Industrial Pumps Industry," which aids in identifying and referencing the specific market segment covered.
12. How do I determine which pricing option suits my needs best?
The pricing options vary based on user requirements and access needs. Individual users may opt for single-user licenses, while businesses requiring broader access may choose multi-user or enterprise licenses for cost-effective access to the report.
13. Are there any additional resources or data provided in the Industrial Pumps Industry report?
While the report offers comprehensive insights, it's advisable to review the specific contents or supplementary materials provided to ascertain if additional resources or data are available.
14. How can I stay updated on further developments or reports in the Industrial Pumps Industry?
To stay informed about further developments, trends, and reports in the Industrial Pumps Industry, consider subscribing to industry newsletters, following relevant companies and organizations, or regularly checking reputable industry news sources and publications.
Methodology
Step 1 - Identification of Relevant Samples Size from Population Database


Step 2 - Approaches for Defining Global Market Size (Value, Volume* & Price*)

Note*: In applicable scenarios
Step 3 - Data Sources
Primary Research
- Web Analytics
- Survey Reports
- Research Institute
- Latest Research Reports
- Opinion Leaders
Secondary Research
- Annual Reports
- White Paper
- Latest Press Release
- Industry Association
- Paid Database
- Investor Presentations

Step 4 - Data Triangulation
Involves using different sources of information in order to increase the validity of a study
These sources are likely to be stakeholders in a program - participants, other researchers, program staff, other community members, and so on.
Then we put all data in single framework & apply various statistical tools to find out the dynamic on the market.
During the analysis stage, feedback from the stakeholder groups would be compared to determine areas of agreement as well as areas of divergence