

Key Insights
The Lighting as a Service (LaaS) market is poised for significant expansion, projected to reach a market size of 3.5 billion by the base year 2025. This growth is underpinned by a robust Compound Annual Growth Rate (CAGR) of 34.8%. Key drivers include the widespread adoption of energy-efficient LED lighting and the escalating demand for smart lighting solutions across commercial, industrial, and outdoor sectors. Businesses are increasingly favoring LaaS models for their predictable operational expenditure (OPEX) over substantial upfront capital expenditure (CAPEX) for lighting infrastructure. LaaS providers offer comprehensive services including installation, maintenance, and energy monitoring, optimizing client operational burdens and maximizing return on investment. The market's segmentation across commercial, industrial, and outdoor applications highlights its broad applicability. Leading players are actively driving innovation and expanding service portfolios to meet diverse customer needs, further propelling market growth. Despite potential challenges related to infrastructure and connectivity in certain regions, the overall outlook for LaaS adoption remains exceptionally strong. North America and Europe are expected to lead market share, while the Asia-Pacific region is anticipated to experience the highest growth rate due to rapid urbanization and infrastructure development.
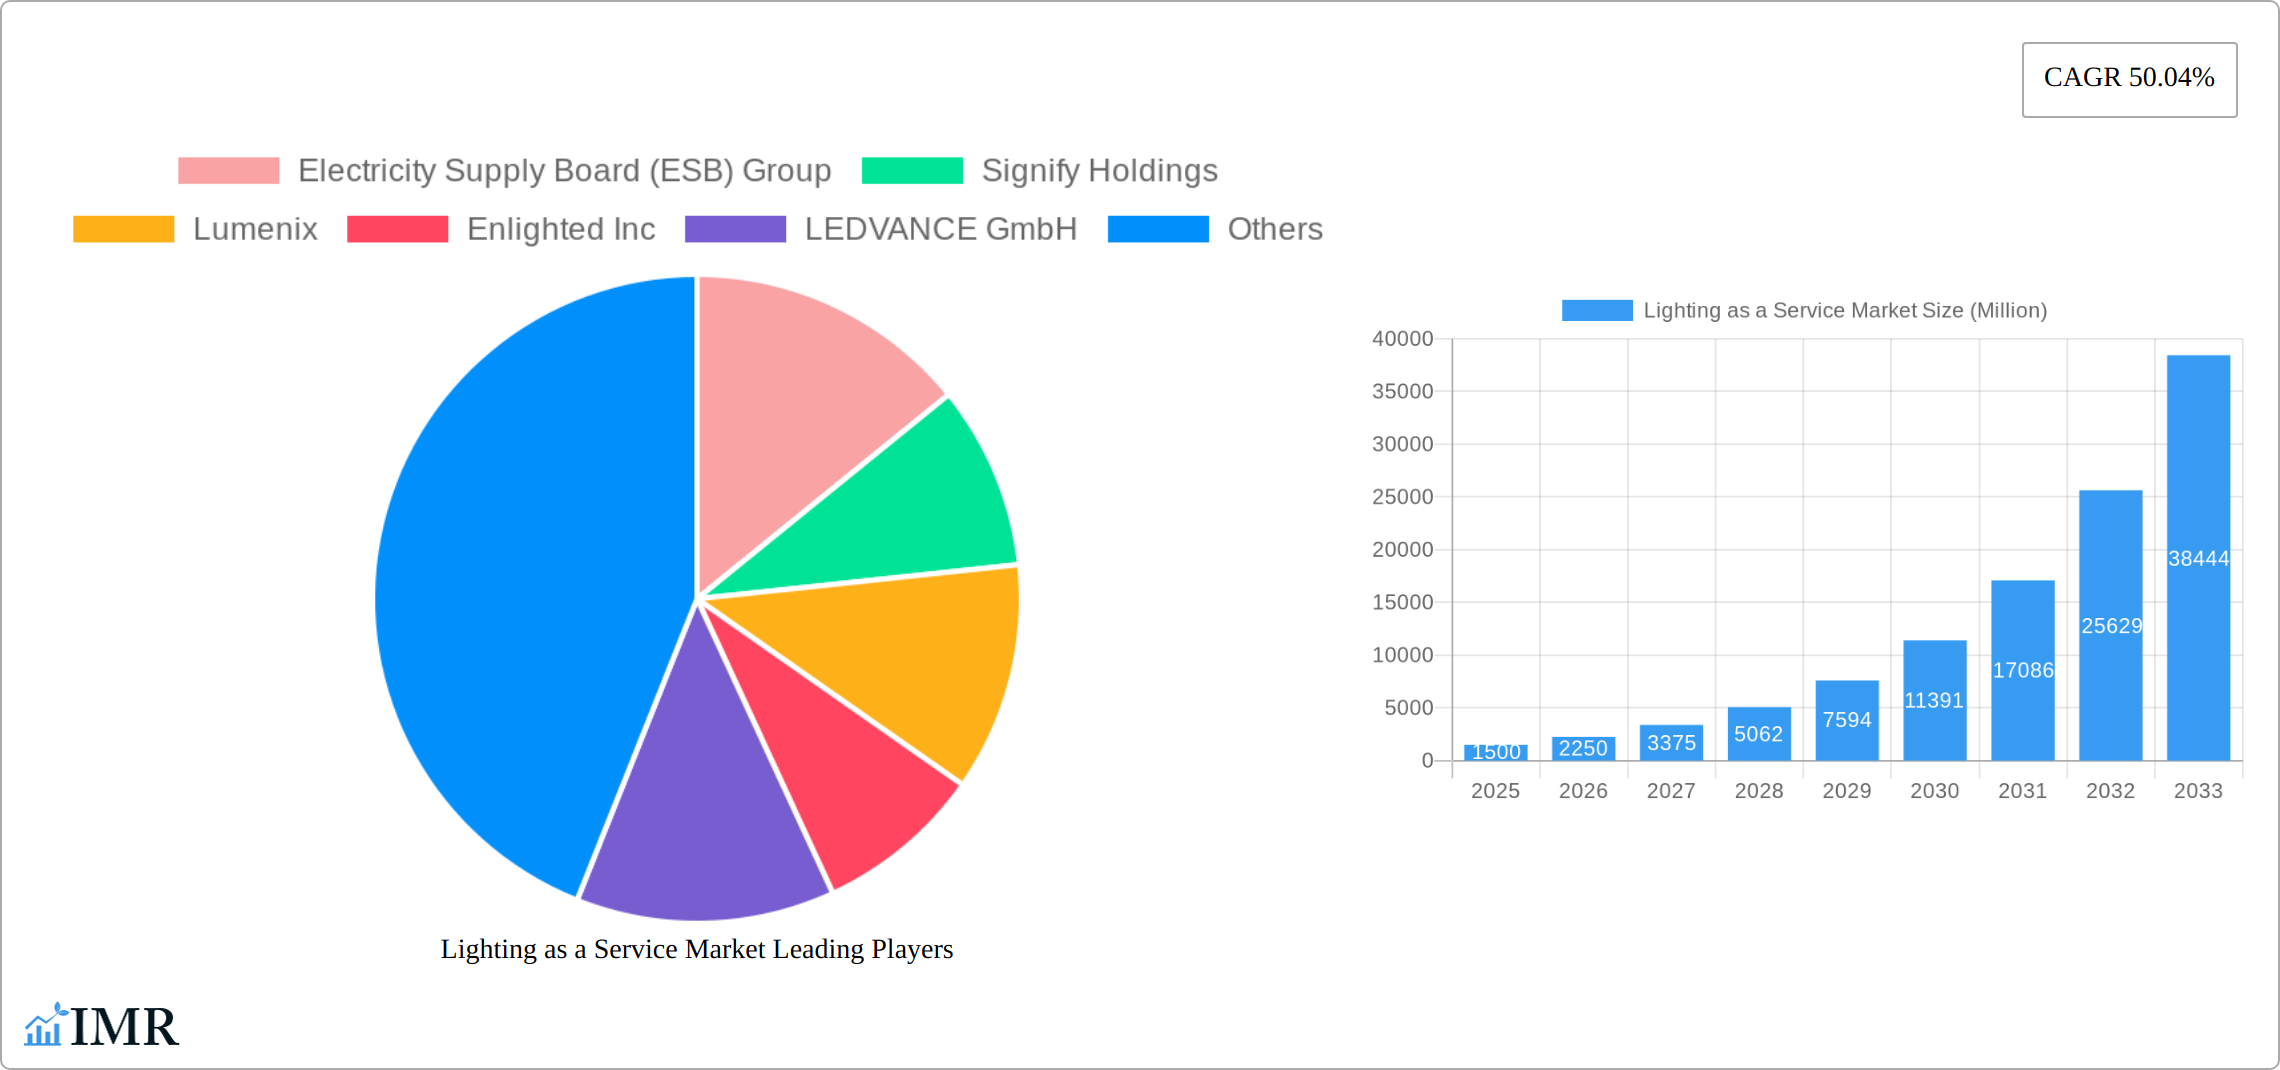
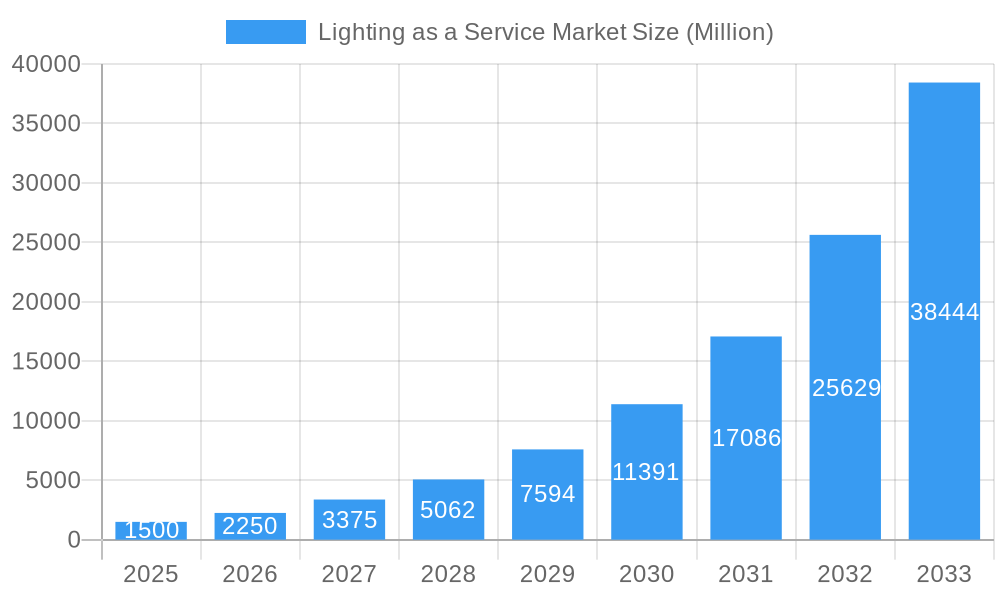
Lighting as a Service Market Market Size (In Billion)
Technological advancements in smart lighting controls and Internet of Things (IoT) integration, alongside government mandates promoting energy efficiency and sustainability, will continue to shape the LaaS market. Potential restraints, such as the requirement for long-term contracts and reliable internet connectivity for remote management, will need to be addressed for sustained growth, particularly in emerging economies. The competitive environment features established lighting manufacturers and specialized LaaS providers competing through innovative solutions and strategic alliances. Market maturation is expected to lead to consolidation and an emphasis on integrated smart lighting solutions. Effective asset lifecycle management, including proactive maintenance and timely replacements, will be crucial for LaaS providers to deliver consistent performance and maximum client value.
Lighting as a Service Market Company Market Share
Lighting as a Service (LaaS) Market Report: 2019-2033
This comprehensive report provides an in-depth analysis of the Lighting as a Service (LaaS) market, encompassing market dynamics, growth trends, regional segmentation, product landscape, key players, and future outlook. The study period covers 2019-2033, with 2025 as the base and estimated year. The forecast period extends from 2025-2033, and the historical period analyzed is 2019-2024. The report offers valuable insights for industry professionals, investors, and strategic decision-makers seeking to understand and capitalize on the opportunities within this rapidly evolving market. The LaaS market is a sub-segment of the broader Lighting market, itself a significant industry.
Lighting as a Service Market Market Dynamics & Structure
The Lighting as a Service (LaaS) market is characterized by a moderately concentrated landscape, with key players such as Electricity Supply Board (ESB) Group, Signify Holdings, Lumenix, Enlighted Inc, LEDVANCE GmbH, Lighthouse, Stouch Lighting, Every Watt Matters, General Electric Company, and LumenServe Inc. competing for market share. Market concentration is estimated at xx% in 2025, with the top 5 players holding approximately xx% of the market.
Technological innovation, particularly in LED technology and IoT integration, is a significant driver. Regulatory frameworks focused on energy efficiency and sustainability further propel LaaS adoption. Competitive substitutes include traditional lighting solutions and other energy-saving technologies. End-user demographics, with a focus on commercial and industrial sectors, significantly influence market demand. The market has witnessed a moderate level of M&A activity in recent years, with approximately xx deals completed between 2019 and 2024.
- Market Concentration: xx% in 2025 (Top 5 players: xx%)
- M&A Activity (2019-2024): xx deals
- Key Innovation Drivers: LED advancements, IoT integration, smart lighting solutions.
- Regulatory Influence: Energy efficiency standards, sustainability initiatives.
- Competitive Substitutes: Traditional lighting, alternative energy-saving technologies.
Lighting as a Service Market Growth Trends & Insights
The Lighting as a Service (LaaS) market has witnessed remarkable growth, fueled by the escalating demand for energy-efficient lighting solutions and their associated cost savings. Market estimates projected a valuation of $xx million in 2025, with forecasts indicating a substantial expansion to $xx million by 2033, representing a Compound Annual Growth Rate (CAGR) of xx% during this period. This impressive growth trajectory is attributed to the rising adoption across diverse sectors, notably commercial and industrial applications. The integration of smart lighting systems and Internet of Things (IoT) capabilities has significantly accelerated market expansion. Furthermore, a growing consumer preference for sustainable and cost-effective solutions is a key contributing factor. Market penetration is projected to reach xx% by 2033, highlighting significant untapped potential. Increased awareness of energy efficiency and sustainability, coupled with supportive government policies promoting green technologies, are pivotal drivers of LaaS adoption.
Dominant Regions, Countries, or Segments in Lighting as a Service Market
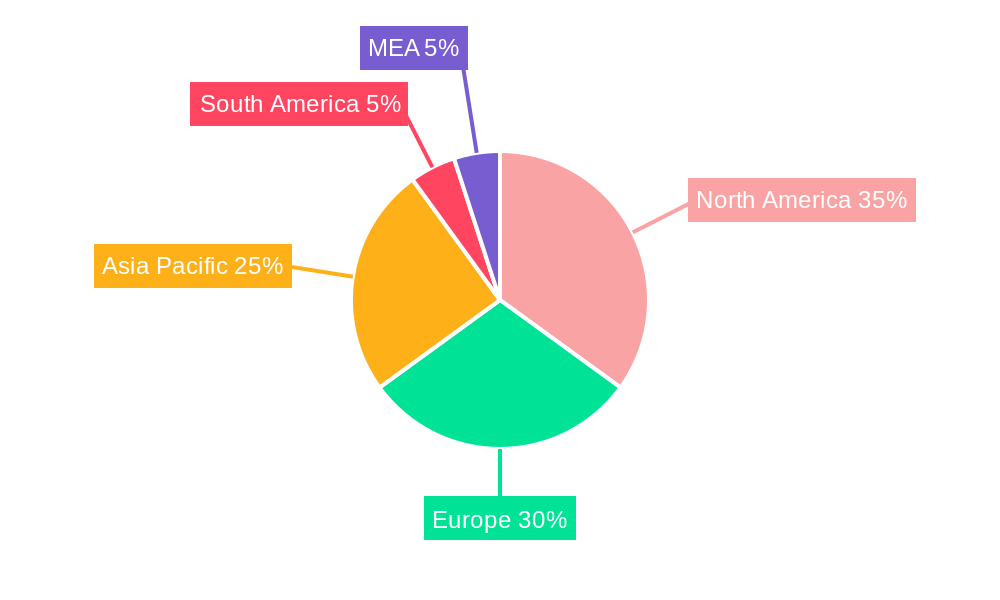
The Commercial sector currently holds a dominant position in the LaaS market, accounting for approximately xx% of the total market share in 2025. This dominance stems from the high concentration of commercial buildings in major urban areas and the considerable cost savings associated with LaaS solutions. North America and Europe lead in LaaS adoption, driven by robust infrastructure, supportive government policies promoting energy efficiency, and a high level of sustainability awareness. However, significant growth potential exists in the Asia-Pacific and Middle East & Africa regions.
- Key Drivers (Commercial Segment): Cost savings, energy efficiency improvements, enhanced building management systems, reduced maintenance overhead, and improved operational efficiency.
- Dominant Region/Country: North America and Western Europe, exhibiting mature markets and high adoption rates.
- Growth Potential: Asia-Pacific and Middle East & Africa, presenting significant opportunities for market expansion due to infrastructure development and increasing demand for efficient lighting solutions.
Lighting as a Service Market Product Landscape
The LaaS market offers a range of products, encompassing smart lighting systems, energy management platforms, and remote monitoring tools. These products incorporate advanced technologies such as LED lighting, sensors, and IoT connectivity, providing enhanced energy efficiency, improved lighting quality, and data-driven insights into energy consumption patterns. Unique selling propositions include reduced upfront costs, predictable operational expenses, and access to advanced lighting management features. Continuous technological advancements are shaping the product landscape, with a focus on improved energy efficiency, enhanced connectivity, and greater integration with other building systems.
Key Drivers, Barriers & Challenges in Lighting as a Service Market
Key Drivers:
- Growing demand for energy-efficient and sustainable lighting solutions to reduce operational costs and environmental impact.
- Rising awareness among consumers and businesses about the environmental and economic benefits of sustainable practices.
- Government incentives, regulations, and policies promoting energy efficiency and the adoption of green technologies.
- Technological advancements in LED lighting, IoT integration, and smart lighting systems, enabling greater control, automation, and data-driven insights.
- Reduced upfront capital expenditure for businesses, allowing them to access advanced lighting solutions without significant initial investment.
Key Barriers and Challenges:
- High initial investment costs for infrastructure upgrades in some cases, potentially hindering adoption in certain sectors.
- Concerns regarding data security and privacy related to the collection and use of energy consumption data from connected lighting systems.
- Complexity in contract negotiations and service agreements, requiring careful consideration of terms, conditions, and service level agreements.
- Competition from traditional lighting solutions and established players in the market, posing a challenge for LaaS providers.
- The presence of legacy infrastructure in some markets, limiting the rate of LaaS adoption and requiring strategic approaches to overcome compatibility issues.
Emerging Opportunities in Lighting as a Service Market
Significant opportunities exist in untapped markets, especially in developing economies undergoing rapid infrastructure development and experiencing a surge in demand for efficient lighting solutions. Innovative applications, such as integrating LaaS with smart city initiatives, deploying it in smart agriculture, and enhancing outdoor public spaces, offer exciting avenues for growth. The evolving consumer preference for personalized and customizable lighting solutions presents further opportunities for LaaS providers to cater to specific needs and preferences.
Growth Accelerators in the Lighting as a Service Market Industry
Technological breakthroughs in areas such as AI-powered lighting control and advanced sensor technology are driving long-term growth. Strategic partnerships between LaaS providers and building management companies are accelerating market penetration. Market expansion strategies, focusing on emerging markets and new application areas, are creating significant growth potential.
Key Players Shaping the Lighting as a Service Market Market
- Electricity Supply Board (ESB) Group
- Signify Holdings
- Lumenix
- Enlighted Inc
- LEDVANCE GmbH
- Lighthouse
- Stouch Lighting
- Every Watt Matters
- General Electric Company
- LumenServe Inc
Notable Milestones in Lighting as a Service Market Sector
- 2020: Signify launched a new LaaS platform.
- 2021: Several major M&A deals reshaped the market landscape.
- 2022: New energy efficiency standards boosted LaaS adoption.
- 2023: Several key players announced significant investments in R&D. (Further milestones require specific data to be filled in)
In-Depth Lighting as a Service Market Market Outlook
The LaaS market is poised for sustained robust growth, driven by technological advancements, increasing sustainability concerns, and supportive government policies. The expanding adoption across various sectors and geographic regions presents substantial strategic opportunities for both established players and new entrants. Strategic partnerships, investments in research and development (R&D), and a focus on innovation will be crucial for success in this dynamic and competitive market. The future will likely see more sophisticated LaaS solutions with enhanced features, improved energy efficiency, greater integration into smart building ecosystems, and advanced data analytics capabilities to optimize lighting performance and reduce energy consumption.
Lighting as a Service Market Segmentation
-
1. End User
- 1.1. Commercial
- 1.2. Outdoor
- 1.3. Industrial
Lighting as a Service Market Segmentation By Geography
- 1. North America
- 2. Europe
- 3. Asia Pacific
- 4. Latin America
- 5. Middle East
Lighting as a Service Market Regional Market Share
Geographic Coverage of Lighting as a Service Market
Lighting as a Service Market REPORT HIGHLIGHTS
| Aspects | Details |
|---|---|
| Study Period | 2020-2034 |
| Base Year | 2025 |
| Estimated Year | 2026 |
| Forecast Period | 2026-2034 |
| Historical Period | 2020-2025 |
| Growth Rate | CAGR of 34.8% from 2020-2034 |
| Segmentation |
|
Table of Contents
- 1. Introduction
- 1.1. Research Scope
- 1.2. Market Segmentation
- 1.3. Research Objective
- 1.4. Definitions and Assumptions
- 2. Executive Summary
- 2.1. Market Snapshot
- 3. Market Dynamics
- 3.1. Market Drivers
- 3.2. Market Restrains
- 3.3. Market Trends
- 3.4. Market Opportunities
- 4. Market Factor Analysis
- 4.1. Porters Five Forces
- 4.1.1. Bargaining Power of Suppliers
- 4.1.2. Bargaining Power of Buyers
- 4.1.3. Threat of New Entrants
- 4.1.4. Threat of Substitutes
- 4.1.5. Competitive Rivalry
- 4.2. PESTEL analysis
- 4.3. BCG Analysis
- 4.3.1. Stars (High Growth, High Market Share)
- 4.3.2. Cash Cows (Low Growth, High Market Share)
- 4.3.3. Question Mark (High Growth, Low Market Share)
- 4.3.4. Dogs (Low Growth, Low Market Share)
- 4.4. Ansoff Matrix Analysis
- 4.5. Supply Chain Analysis
- 4.6. Regulatory Landscape
- 4.7. Current Market Potential and Opportunity Assessment (TAM–SAM–SOM Framework)
- 4.8. IMR Analyst Note
- 4.1. Porters Five Forces
- 5. Market Analysis, Insights and Forecast 2021-2033
- 5.1. Market Analysis, Insights and Forecast - by End User
- 5.1.1. Commercial
- 5.1.2. Outdoor
- 5.1.3. Industrial
- 5.2. Market Analysis, Insights and Forecast - by Region
- 5.2.1. North America
- 5.2.2. Europe
- 5.2.3. Asia Pacific
- 5.2.4. Latin America
- 5.2.5. Middle East
- 5.1. Market Analysis, Insights and Forecast - by End User
- 6. Global Lighting as a Service Market Analysis, Insights and Forecast, 2021-2033
- 6.1. Market Analysis, Insights and Forecast - by End User
- 6.1.1. Commercial
- 6.1.2. Outdoor
- 6.1.3. Industrial
- 6.1. Market Analysis, Insights and Forecast - by End User
- 7. North America Lighting as a Service Market Analysis, Insights and Forecast, 2020-2032
- 7.1. Market Analysis, Insights and Forecast - by End User
- 7.1.1. Commercial
- 7.1.2. Outdoor
- 7.1.3. Industrial
- 7.1. Market Analysis, Insights and Forecast - by End User
- 8. Europe Lighting as a Service Market Analysis, Insights and Forecast, 2020-2032
- 8.1. Market Analysis, Insights and Forecast - by End User
- 8.1.1. Commercial
- 8.1.2. Outdoor
- 8.1.3. Industrial
- 8.1. Market Analysis, Insights and Forecast - by End User
- 9. Asia Pacific Lighting as a Service Market Analysis, Insights and Forecast, 2020-2032
- 9.1. Market Analysis, Insights and Forecast - by End User
- 9.1.1. Commercial
- 9.1.2. Outdoor
- 9.1.3. Industrial
- 9.1. Market Analysis, Insights and Forecast - by End User
- 10. Latin America Lighting as a Service Market Analysis, Insights and Forecast, 2020-2032
- 10.1. Market Analysis, Insights and Forecast - by End User
- 10.1.1. Commercial
- 10.1.2. Outdoor
- 10.1.3. Industrial
- 10.1. Market Analysis, Insights and Forecast - by End User
- 11. Middle East Lighting as a Service Market Analysis, Insights and Forecast, 2020-2032
- 11.1. Market Analysis, Insights and Forecast - by End User
- 11.1.1. Commercial
- 11.1.2. Outdoor
- 11.1.3. Industrial
- 11.1. Market Analysis, Insights and Forecast - by End User
- 12. Competitive Analysis
- 12.1. Company Profiles
- 12.1.1 Electricity Supply Board (ESB) Group
- 12.1.1.1. Company Overview
- 12.1.1.2. Products
- 12.1.1.3. Company Financials
- 12.1.1.4. SWOT Analysis
- 12.1.2 Signify Holdings
- 12.1.2.1. Company Overview
- 12.1.2.2. Products
- 12.1.2.3. Company Financials
- 12.1.2.4. SWOT Analysis
- 12.1.3 Lumenix
- 12.1.3.1. Company Overview
- 12.1.3.2. Products
- 12.1.3.3. Company Financials
- 12.1.3.4. SWOT Analysis
- 12.1.4 Enlighted Inc
- 12.1.4.1. Company Overview
- 12.1.4.2. Products
- 12.1.4.3. Company Financials
- 12.1.4.4. SWOT Analysis
- 12.1.5 LEDVANCE GmbH
- 12.1.5.1. Company Overview
- 12.1.5.2. Products
- 12.1.5.3. Company Financials
- 12.1.5.4. SWOT Analysis
- 12.1.6 Lighthouse*List Not Exhaustive
- 12.1.6.1. Company Overview
- 12.1.6.2. Products
- 12.1.6.3. Company Financials
- 12.1.6.4. SWOT Analysis
- 12.1.7 Stouch Lighting
- 12.1.7.1. Company Overview
- 12.1.7.2. Products
- 12.1.7.3. Company Financials
- 12.1.7.4. SWOT Analysis
- 12.1.8 Every Watt Matters
- 12.1.8.1. Company Overview
- 12.1.8.2. Products
- 12.1.8.3. Company Financials
- 12.1.8.4. SWOT Analysis
- 12.1.9 General Electric Company
- 12.1.9.1. Company Overview
- 12.1.9.2. Products
- 12.1.9.3. Company Financials
- 12.1.9.4. SWOT Analysis
- 12.1.10 LumenServe Inc
- 12.1.10.1. Company Overview
- 12.1.10.2. Products
- 12.1.10.3. Company Financials
- 12.1.10.4. SWOT Analysis
- 12.1.1 Electricity Supply Board (ESB) Group
- 12.2. Market Entropy
- 12.2.1 Company's Key Areas Served
- 12.2.2 Recent Developments
- 12.3. Company Market Share Analysis 2025
- 12.3.1 Top 5 Companies Market Share Analysis
- 12.3.2 Top 3 Companies Market Share Analysis
- 12.4. List of Potential Customers
- 13. Research Methodology
List of Figures
- Figure 1: Global Lighting as a Service Market Revenue Breakdown (billion, %) by Region 2025 & 2033
- Figure 2: North America Lighting as a Service Market Revenue (billion), by End User 2025 & 2033
- Figure 3: North America Lighting as a Service Market Revenue Share (%), by End User 2025 & 2033
- Figure 4: North America Lighting as a Service Market Revenue (billion), by Country 2025 & 2033
- Figure 5: North America Lighting as a Service Market Revenue Share (%), by Country 2025 & 2033
- Figure 6: Europe Lighting as a Service Market Revenue (billion), by End User 2025 & 2033
- Figure 7: Europe Lighting as a Service Market Revenue Share (%), by End User 2025 & 2033
- Figure 8: Europe Lighting as a Service Market Revenue (billion), by Country 2025 & 2033
- Figure 9: Europe Lighting as a Service Market Revenue Share (%), by Country 2025 & 2033
- Figure 10: Asia Pacific Lighting as a Service Market Revenue (billion), by End User 2025 & 2033
- Figure 11: Asia Pacific Lighting as a Service Market Revenue Share (%), by End User 2025 & 2033
- Figure 12: Asia Pacific Lighting as a Service Market Revenue (billion), by Country 2025 & 2033
- Figure 13: Asia Pacific Lighting as a Service Market Revenue Share (%), by Country 2025 & 2033
- Figure 14: Latin America Lighting as a Service Market Revenue (billion), by End User 2025 & 2033
- Figure 15: Latin America Lighting as a Service Market Revenue Share (%), by End User 2025 & 2033
- Figure 16: Latin America Lighting as a Service Market Revenue (billion), by Country 2025 & 2033
- Figure 17: Latin America Lighting as a Service Market Revenue Share (%), by Country 2025 & 2033
- Figure 18: Middle East Lighting as a Service Market Revenue (billion), by End User 2025 & 2033
- Figure 19: Middle East Lighting as a Service Market Revenue Share (%), by End User 2025 & 2033
- Figure 20: Middle East Lighting as a Service Market Revenue (billion), by Country 2025 & 2033
- Figure 21: Middle East Lighting as a Service Market Revenue Share (%), by Country 2025 & 2033
List of Tables
- Table 1: Global Lighting as a Service Market Revenue billion Forecast, by End User 2020 & 2033
- Table 2: Global Lighting as a Service Market Revenue billion Forecast, by Region 2020 & 2033
- Table 3: Global Lighting as a Service Market Revenue billion Forecast, by End User 2020 & 2033
- Table 4: Global Lighting as a Service Market Revenue billion Forecast, by Country 2020 & 2033
- Table 5: Global Lighting as a Service Market Revenue billion Forecast, by End User 2020 & 2033
- Table 6: Global Lighting as a Service Market Revenue billion Forecast, by Country 2020 & 2033
- Table 7: Global Lighting as a Service Market Revenue billion Forecast, by End User 2020 & 2033
- Table 8: Global Lighting as a Service Market Revenue billion Forecast, by Country 2020 & 2033
- Table 9: Global Lighting as a Service Market Revenue billion Forecast, by End User 2020 & 2033
- Table 10: Global Lighting as a Service Market Revenue billion Forecast, by Country 2020 & 2033
- Table 11: Global Lighting as a Service Market Revenue billion Forecast, by End User 2020 & 2033
- Table 12: Global Lighting as a Service Market Revenue billion Forecast, by Country 2020 & 2033
Frequently Asked Questions
1. What is the projected Compound Annual Growth Rate (CAGR) of the Lighting as a Service Market?
The projected CAGR is approximately 34.8%.
2. Which companies are prominent players in the Lighting as a Service Market?
Key companies in the market include Electricity Supply Board (ESB) Group, Signify Holdings, Lumenix, Enlighted Inc, LEDVANCE GmbH, Lighthouse*List Not Exhaustive, Stouch Lighting, Every Watt Matters, General Electric Company, LumenServe Inc.
3. What are the main segments of the Lighting as a Service Market?
The market segments include End User.
4. Can you provide details about the market size?
The market size is estimated to be USD 3.5 billion as of 2022.
5. What are some drivers contributing to market growth?
; Government Policies for the Adoption of Energy-efficient Lighting Systems; Adoption of IoT with Lighting Systems.
6. What are the notable trends driving market growth?
Commercial Segment to Dominate the Market.
7. Are there any restraints impacting market growth?
4.; The global shift toward renewable sources for electricity generation.
8. Can you provide examples of recent developments in the market?
N/A
9. What pricing options are available for accessing the report?
Pricing options include single-user, multi-user, and enterprise licenses priced at USD 4750, USD 5250, and USD 8750 respectively.
10. Is the market size provided in terms of value or volume?
The market size is provided in terms of value, measured in billion.
11. Are there any specific market keywords associated with the report?
Yes, the market keyword associated with the report is "Lighting as a Service Market," which aids in identifying and referencing the specific market segment covered.
12. How do I determine which pricing option suits my needs best?
The pricing options vary based on user requirements and access needs. Individual users may opt for single-user licenses, while businesses requiring broader access may choose multi-user or enterprise licenses for cost-effective access to the report.
13. Are there any additional resources or data provided in the Lighting as a Service Market report?
While the report offers comprehensive insights, it's advisable to review the specific contents or supplementary materials provided to ascertain if additional resources or data are available.
14. How can I stay updated on further developments or reports in the Lighting as a Service Market?
To stay informed about further developments, trends, and reports in the Lighting as a Service Market, consider subscribing to industry newsletters, following relevant companies and organizations, or regularly checking reputable industry news sources and publications.
Methodology
Step 1 - Identification of Relevant Samples Size from Population Database


Step 2 - Approaches for Defining Global Market Size (Value, Volume* & Price*)

Note*: In applicable scenarios
Step 3 - Data Sources
Primary Research
- Web Analytics
- Survey Reports
- Research Institute
- Latest Research Reports
- Opinion Leaders
Secondary Research
- Annual Reports
- White Paper
- Latest Press Release
- Industry Association
- Paid Database
- Investor Presentations

Step 4 - Data Triangulation
Involves using different sources of information in order to increase the validity of a study
These sources are likely to be stakeholders in a program - participants, other researchers, program staff, other community members, and so on.
Then we put all data in single framework & apply various statistical tools to find out the dynamic on the market.
During the analysis stage, feedback from the stakeholder groups would be compared to determine areas of agreement as well as areas of divergence