

Key Insights
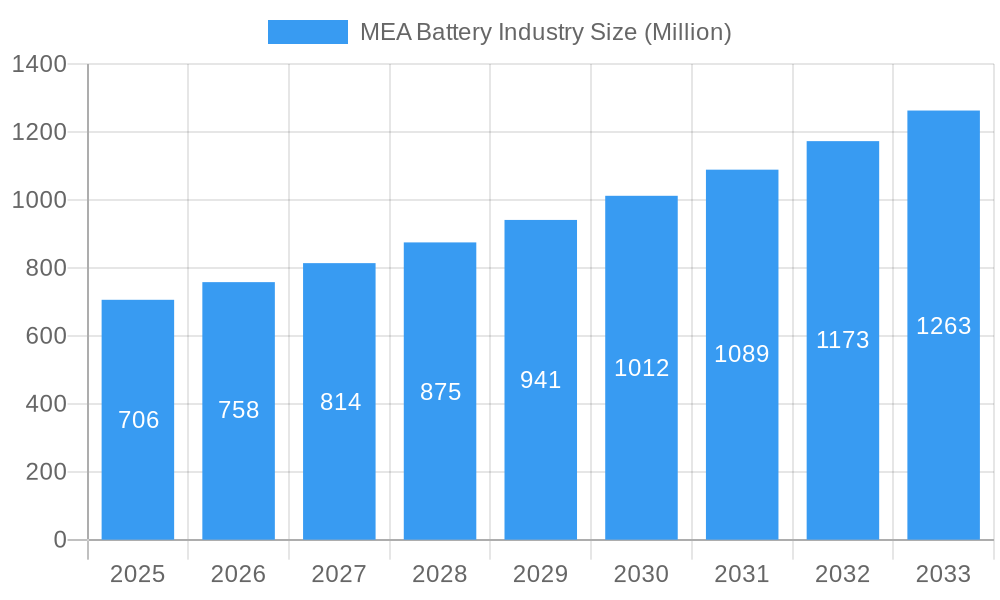
The Middle East and Africa (MEA) battery market, valued at approximately $706 million in 2025, is projected to experience robust growth, exceeding a 7% Compound Annual Growth Rate (CAGR) through 2033. This expansion is fueled by several key drivers. The burgeoning automotive sector, particularly the increasing adoption of electric vehicles (EVs) and hybrid electric vehicles (HEVs) across the region, is significantly boosting demand for automotive batteries. Furthermore, the growth of renewable energy sources, such as solar and wind power, is driving the need for efficient energy storage solutions, including stationary batteries for telecom and UPS systems. The expanding telecommunications infrastructure and rising energy demands from various industrial sectors also contribute to market growth. While the high initial investment costs associated with battery technology and potential environmental concerns related to battery disposal could act as restraints, the overall market outlook remains positive due to supportive government policies promoting renewable energy and sustainable transportation, coupled with continuous technological advancements resulting in higher efficiency and longer battery lifespans.
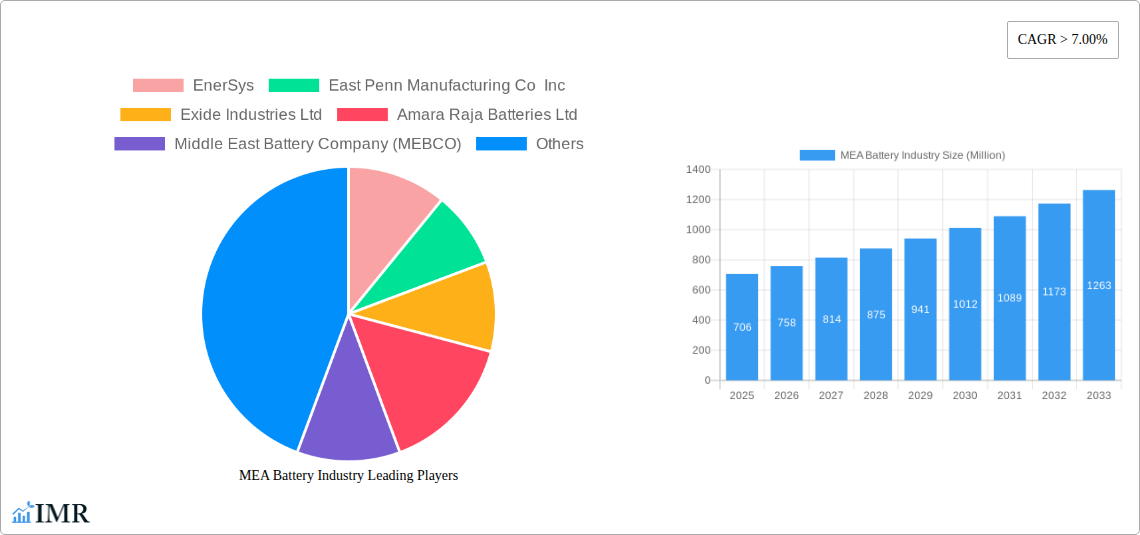
MEA Battery Industry Market Size (In Million)
However, the MEA market presents unique challenges. Infrastructure development for EV charging stations and battery recycling facilities needs significant investment. Additionally, variations in regulatory frameworks and economic conditions across different MEA countries impact market penetration. The segment breakdown reveals that lithium-ion batteries are likely to dominate due to their high energy density and performance. The dominance of automotive and industrial applications underscores the importance of addressing the needs of these sectors. Major players are focusing on localization strategies to leverage regional demand and mitigate logistical challenges, leading to increased competition and potential price adjustments in the market. The future success of MEA battery companies will depend on their ability to navigate these challenges effectively, capitalize on the region’s growth potential, and adapt to the evolving technological landscape.
MEA Battery Industry Company Market Share
MEA Battery Industry Market Report: 2019-2033
This comprehensive report provides an in-depth analysis of the Middle East and Africa (MEA) battery industry, covering market dynamics, growth trends, key players, and future outlook. The study period spans 2019-2033, with 2025 as the base and estimated year. The report segments the market by battery type (primary and secondary), technology (lead-acid, lithium-ion, NiMH, and others), and application (automotive, industrial, portable, and others). It offers invaluable insights for industry professionals, investors, and strategic decision-makers seeking to navigate this rapidly evolving landscape.
MEA Battery Industry Market Dynamics & Structure
The MEA battery market exhibits a moderately concentrated structure, with key players like EnerSys, East Penn Manufacturing Co Inc, Exide Industries Ltd, and Amara Raja Batteries Ltd holding significant market share. Technological innovation, particularly in lithium-ion battery technology, is a primary growth driver. Stringent environmental regulations and a push towards renewable energy are shaping the industry landscape. Lead-acid batteries still dominate the market, but lithium-ion batteries are rapidly gaining traction, driven by the burgeoning electric vehicle (EV) and energy storage system (ESS) sectors. Competition from substitute technologies and the increasing adoption of EVs are key factors influencing market dynamics. M&A activity remains moderate, with xx deals recorded in the historical period (2019-2024), primarily focused on expanding geographic reach and technological capabilities.
- Market Concentration: Moderately concentrated, with top 5 players holding xx% market share in 2024.
- Technological Innovation: Lithium-ion battery technology is the key innovation driver.
- Regulatory Framework: Stringent environmental regulations are pushing the adoption of eco-friendly batteries.
- Competitive Substitutes: Fuel cells and other energy storage technologies pose a competitive threat.
- End-User Demographics: The automotive and industrial sectors are the primary end-users.
- M&A Trends: Moderate M&A activity, xx deals recorded between 2019-2024, focused on expansion and technology acquisition.
MEA Battery Industry Growth Trends & Insights
The MEA battery market witnessed robust growth during the historical period (2019-2024), expanding at a CAGR of xx%. This growth is primarily attributed to the increasing demand for automotive batteries, driven by the rising sales of vehicles and the growing adoption of EVs. Furthermore, the expanding industrial sector, particularly in the telecom and energy storage segments, is fueling demand for industrial batteries. Technological advancements, particularly in lithium-ion battery technology, are enhancing performance, lifespan, and reducing costs, further driving market growth. Shifting consumer preferences towards portable electronic devices are contributing to the growth of the portable battery segment. The forecast period (2025-2033) projects continued expansion at a CAGR of xx%, driven by sustained growth in the automotive and renewable energy sectors. Market penetration of lithium-ion batteries is expected to increase from xx% in 2024 to xx% by 2033.
Dominant Regions, Countries, or Segments in MEA Battery Industry
South Africa and Saudi Arabia currently dominate the MEA battery market, driven by robust automotive and industrial sectors. The secondary battery segment, particularly lithium-ion batteries, is experiencing the highest growth, fuelled by the rising demand for EVs and ESS. The automotive battery application segment accounts for the largest market share, followed by the industrial battery segment.
- Leading Region: South Africa
- Leading Country: South Africa
- Leading Segment (Type): Secondary Battery
- Leading Segment (Technology): Lead-acid Battery (currently), with Lithium-ion rapidly gaining share.
- Leading Segment (Application): Automotive Batteries
Key Drivers:
- Growing automotive sector, especially EV adoption.
- Expanding industrial sector (telecom, UPS, ESS).
- Government initiatives promoting renewable energy.
- Increasing investment in infrastructure development.
MEA Battery Industry Product Landscape
The MEA battery market offers a diverse range of products, including lead-acid, lithium-ion, and NiMH batteries, catering to various applications. Lead-acid batteries continue to dominate the market due to their lower cost, but lithium-ion batteries are gaining traction due to their higher energy density and longer lifespan. Recent innovations focus on improving energy density, safety features, and reducing production costs. Unique selling propositions include improved cycle life, enhanced safety mechanisms, and specialized designs for specific applications. Technological advancements involve the development of solid-state batteries and improved battery management systems.
Key Drivers, Barriers & Challenges in MEA Battery Industry
Key Drivers:
- Rising demand for EVs and hybrid vehicles.
- Growth of renewable energy sources and energy storage systems.
- Government support and incentives for battery technology development.
Key Challenges:
- High initial investment costs for lithium-ion battery manufacturing.
- Supply chain disruptions impacting raw material availability.
- Lack of skilled workforce in advanced battery technologies.
- Concerns about battery safety and environmental impact.
Emerging Opportunities in MEA Battery Industry
- Growing demand for energy storage solutions in the renewable energy sector.
- Expansion of the electric two-wheeler and three-wheeler market.
- Increasing adoption of battery-powered tools and equipment in various industries.
- Development of smart grid technologies integrating battery storage.
Growth Accelerators in the MEA Battery Industry
Technological advancements, particularly in solid-state battery technology, hold immense potential for accelerating market growth. Strategic partnerships between battery manufacturers and automotive companies are facilitating the adoption of advanced battery technologies. Furthermore, government initiatives promoting the adoption of EVs and renewable energy are creating favorable conditions for market expansion.
Key Players Shaping the MEA Battery Industry Market
- EnerSys
- East Penn Manufacturing Co Inc
- Exide Industries Ltd
- Amara Raja Batteries Ltd
- Middle East Battery Company (MEBCO)
- C&D Technologies Inc
- First National Battery Pty Ltd
- SAFT GROUPE SA
- Panasonic Corporation
Notable Milestones in MEA Battery Industry Sector
- Aug 2023: Mahindra & Mahindra unveils electric Thar SUV and seven new electric tractor models in South Africa, signaling increased demand for electric vehicles and agricultural machinery in the region.
- Jun 2023: Saudi Arabia's USD 5.6 billion investment deal with Human Horizons to boost EV manufacturing and sales within the country, indicating a significant push towards electric mobility in the MEA region.
In-Depth MEA Battery Industry Market Outlook
The MEA battery industry is poised for significant growth in the coming years, driven by the increasing adoption of EVs, the expansion of renewable energy, and the growing demand for energy storage solutions. Strategic investments in battery manufacturing, technological advancements, and supportive government policies will further accelerate market expansion. Companies focusing on innovation, sustainable practices, and strategic partnerships will be well-positioned to capitalize on the significant growth opportunities in this dynamic market.
MEA Battery Industry Segmentation
-
1. Type
- 1.1. Primary Battery
- 1.2. Secondary Battery
-
2. Technology
- 2.1. Lead-acid Battery
- 2.2. Lithium-ion Battery
- 2.3. Nickel-metal Hydride (NiMH) Battery
- 2.4. Other Te
-
3. Application
- 3.1. Automotive Batteries
- 3.2. Industri
- 3.3. Portable Batteries (Consumer Electronics, etc.)
- 3.4. Other Applications
-
4. Geography
- 4.1. Saudi Arabia
- 4.2. United Arab Emirates
- 4.3. South Africa
- 4.4. Rest of Middle-East and Africa
MEA Battery Industry Segmentation By Geography
- 1. Saudi Arabia
- 2. United Arab Emirates
- 3. South Africa
- 4. Rest of Middle East and Africa
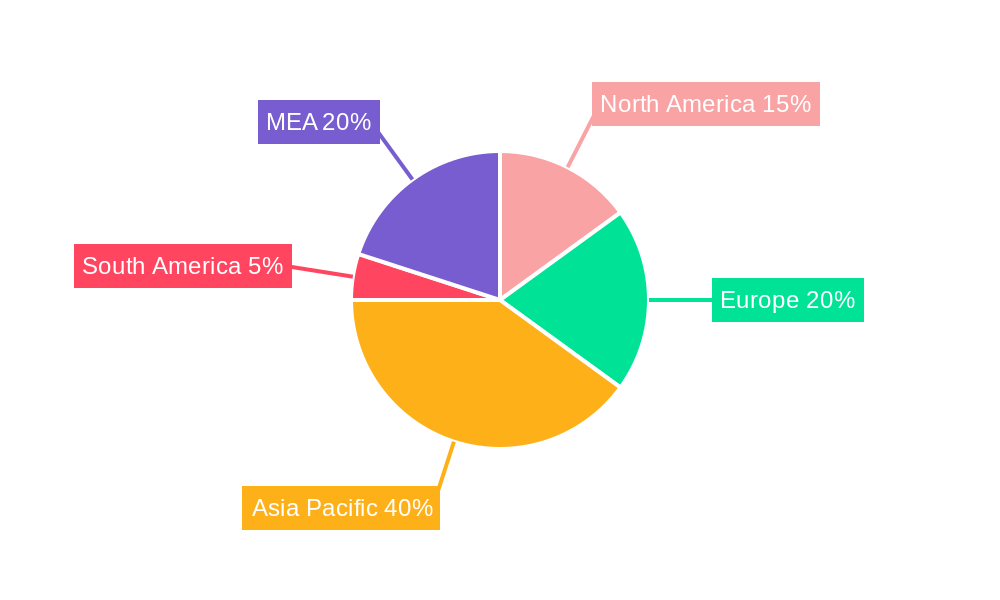
MEA Battery Industry Regional Market Share
Geographic Coverage of MEA Battery Industry
MEA Battery Industry REPORT HIGHLIGHTS
| Aspects | Details |
|---|---|
| Study Period | 2020-2034 |
| Base Year | 2025 |
| Estimated Year | 2026 |
| Forecast Period | 2026-2034 |
| Historical Period | 2020-2025 |
| Growth Rate | CAGR of > 7.00% from 2020-2034 |
| Segmentation |
|
Table of Contents
- 1. Introduction
- 1.1. Research Scope
- 1.2. Market Segmentation
- 1.3. Research Objective
- 1.4. Definitions and Assumptions
- 2. Executive Summary
- 2.1. Market Snapshot
- 3. Market Dynamics
- 3.1. Market Drivers
- 3.2. Market Restrains
- 3.3. Market Trends
- 3.4. Market Opportunities
- 4. Market Factor Analysis
- 4.1. Porters Five Forces
- 4.1.1. Bargaining Power of Suppliers
- 4.1.2. Bargaining Power of Buyers
- 4.1.3. Threat of New Entrants
- 4.1.4. Threat of Substitutes
- 4.1.5. Competitive Rivalry
- 4.2. PESTEL analysis
- 4.3. BCG Analysis
- 4.3.1. Stars (High Growth, High Market Share)
- 4.3.2. Cash Cows (Low Growth, High Market Share)
- 4.3.3. Question Mark (High Growth, Low Market Share)
- 4.3.4. Dogs (Low Growth, Low Market Share)
- 4.4. Ansoff Matrix Analysis
- 4.5. Supply Chain Analysis
- 4.6. Regulatory Landscape
- 4.7. Current Market Potential and Opportunity Assessment (TAM–SAM–SOM Framework)
- 4.8. IMR Analyst Note
- 4.1. Porters Five Forces
- 5. Market Analysis, Insights and Forecast 2021-2033
- 5.1. Market Analysis, Insights and Forecast - by Type
- 5.1.1. Primary Battery
- 5.1.2. Secondary Battery
- 5.2. Market Analysis, Insights and Forecast - by Technology
- 5.2.1. Lead-acid Battery
- 5.2.2. Lithium-ion Battery
- 5.2.3. Nickel-metal Hydride (NiMH) Battery
- 5.2.4. Other Te
- 5.3. Market Analysis, Insights and Forecast - by Application
- 5.3.1. Automotive Batteries
- 5.3.2. Industri
- 5.3.3. Portable Batteries (Consumer Electronics, etc.)
- 5.3.4. Other Applications
- 5.4. Market Analysis, Insights and Forecast - by Geography
- 5.4.1. Saudi Arabia
- 5.4.2. United Arab Emirates
- 5.4.3. South Africa
- 5.4.4. Rest of Middle-East and Africa
- 5.5. Market Analysis, Insights and Forecast - by Region
- 5.5.1. Saudi Arabia
- 5.5.2. United Arab Emirates
- 5.5.3. South Africa
- 5.5.4. Rest of Middle East and Africa
- 5.1. Market Analysis, Insights and Forecast - by Type
- 6. Global MEA Battery Industry Analysis, Insights and Forecast, 2021-2033
- 6.1. Market Analysis, Insights and Forecast - by Type
- 6.1.1. Primary Battery
- 6.1.2. Secondary Battery
- 6.2. Market Analysis, Insights and Forecast - by Technology
- 6.2.1. Lead-acid Battery
- 6.2.2. Lithium-ion Battery
- 6.2.3. Nickel-metal Hydride (NiMH) Battery
- 6.2.4. Other Te
- 6.3. Market Analysis, Insights and Forecast - by Application
- 6.3.1. Automotive Batteries
- 6.3.2. Industri
- 6.3.3. Portable Batteries (Consumer Electronics, etc.)
- 6.3.4. Other Applications
- 6.4. Market Analysis, Insights and Forecast - by Geography
- 6.4.1. Saudi Arabia
- 6.4.2. United Arab Emirates
- 6.4.3. South Africa
- 6.4.4. Rest of Middle-East and Africa
- 6.1. Market Analysis, Insights and Forecast - by Type
- 7. Saudi Arabia MEA Battery Industry Analysis, Insights and Forecast, 2020-2032
- 7.1. Market Analysis, Insights and Forecast - by Type
- 7.1.1. Primary Battery
- 7.1.2. Secondary Battery
- 7.2. Market Analysis, Insights and Forecast - by Technology
- 7.2.1. Lead-acid Battery
- 7.2.2. Lithium-ion Battery
- 7.2.3. Nickel-metal Hydride (NiMH) Battery
- 7.2.4. Other Te
- 7.3. Market Analysis, Insights and Forecast - by Application
- 7.3.1. Automotive Batteries
- 7.3.2. Industri
- 7.3.3. Portable Batteries (Consumer Electronics, etc.)
- 7.3.4. Other Applications
- 7.4. Market Analysis, Insights and Forecast - by Geography
- 7.4.1. Saudi Arabia
- 7.4.2. United Arab Emirates
- 7.4.3. South Africa
- 7.4.4. Rest of Middle-East and Africa
- 7.1. Market Analysis, Insights and Forecast - by Type
- 8. United Arab Emirates MEA Battery Industry Analysis, Insights and Forecast, 2020-2032
- 8.1. Market Analysis, Insights and Forecast - by Type
- 8.1.1. Primary Battery
- 8.1.2. Secondary Battery
- 8.2. Market Analysis, Insights and Forecast - by Technology
- 8.2.1. Lead-acid Battery
- 8.2.2. Lithium-ion Battery
- 8.2.3. Nickel-metal Hydride (NiMH) Battery
- 8.2.4. Other Te
- 8.3. Market Analysis, Insights and Forecast - by Application
- 8.3.1. Automotive Batteries
- 8.3.2. Industri
- 8.3.3. Portable Batteries (Consumer Electronics, etc.)
- 8.3.4. Other Applications
- 8.4. Market Analysis, Insights and Forecast - by Geography
- 8.4.1. Saudi Arabia
- 8.4.2. United Arab Emirates
- 8.4.3. South Africa
- 8.4.4. Rest of Middle-East and Africa
- 8.1. Market Analysis, Insights and Forecast - by Type
- 9. South Africa MEA Battery Industry Analysis, Insights and Forecast, 2020-2032
- 9.1. Market Analysis, Insights and Forecast - by Type
- 9.1.1. Primary Battery
- 9.1.2. Secondary Battery
- 9.2. Market Analysis, Insights and Forecast - by Technology
- 9.2.1. Lead-acid Battery
- 9.2.2. Lithium-ion Battery
- 9.2.3. Nickel-metal Hydride (NiMH) Battery
- 9.2.4. Other Te
- 9.3. Market Analysis, Insights and Forecast - by Application
- 9.3.1. Automotive Batteries
- 9.3.2. Industri
- 9.3.3. Portable Batteries (Consumer Electronics, etc.)
- 9.3.4. Other Applications
- 9.4. Market Analysis, Insights and Forecast - by Geography
- 9.4.1. Saudi Arabia
- 9.4.2. United Arab Emirates
- 9.4.3. South Africa
- 9.4.4. Rest of Middle-East and Africa
- 9.1. Market Analysis, Insights and Forecast - by Type
- 10. Rest of Middle East and Africa MEA Battery Industry Analysis, Insights and Forecast, 2020-2032
- 10.1. Market Analysis, Insights and Forecast - by Type
- 10.1.1. Primary Battery
- 10.1.2. Secondary Battery
- 10.2. Market Analysis, Insights and Forecast - by Technology
- 10.2.1. Lead-acid Battery
- 10.2.2. Lithium-ion Battery
- 10.2.3. Nickel-metal Hydride (NiMH) Battery
- 10.2.4. Other Te
- 10.3. Market Analysis, Insights and Forecast - by Application
- 10.3.1. Automotive Batteries
- 10.3.2. Industri
- 10.3.3. Portable Batteries (Consumer Electronics, etc.)
- 10.3.4. Other Applications
- 10.4. Market Analysis, Insights and Forecast - by Geography
- 10.4.1. Saudi Arabia
- 10.4.2. United Arab Emirates
- 10.4.3. South Africa
- 10.4.4. Rest of Middle-East and Africa
- 10.1. Market Analysis, Insights and Forecast - by Type
- 11. Competitive Analysis
- 11.1. Company Profiles
- 11.1.1 EnerSys
- 11.1.1.1. Company Overview
- 11.1.1.2. Products
- 11.1.1.3. Company Financials
- 11.1.1.4. SWOT Analysis
- 11.1.2 East Penn Manufacturing Co Inc
- 11.1.2.1. Company Overview
- 11.1.2.2. Products
- 11.1.2.3. Company Financials
- 11.1.2.4. SWOT Analysis
- 11.1.3 Exide Industries Ltd
- 11.1.3.1. Company Overview
- 11.1.3.2. Products
- 11.1.3.3. Company Financials
- 11.1.3.4. SWOT Analysis
- 11.1.4 Amara Raja Batteries Ltd
- 11.1.4.1. Company Overview
- 11.1.4.2. Products
- 11.1.4.3. Company Financials
- 11.1.4.4. SWOT Analysis
- 11.1.5 Middle East Battery Company (MEBCO)
- 11.1.5.1. Company Overview
- 11.1.5.2. Products
- 11.1.5.3. Company Financials
- 11.1.5.4. SWOT Analysis
- 11.1.6 C&D Technologies Inc
- 11.1.6.1. Company Overview
- 11.1.6.2. Products
- 11.1.6.3. Company Financials
- 11.1.6.4. SWOT Analysis
- 11.1.7 First National Battery Pty Ltd
- 11.1.7.1. Company Overview
- 11.1.7.2. Products
- 11.1.7.3. Company Financials
- 11.1.7.4. SWOT Analysis
- 11.1.8 SAFT GROUPE SA
- 11.1.8.1. Company Overview
- 11.1.8.2. Products
- 11.1.8.3. Company Financials
- 11.1.8.4. SWOT Analysis
- 11.1.9 Panasonic Corporation
- 11.1.9.1. Company Overview
- 11.1.9.2. Products
- 11.1.9.3. Company Financials
- 11.1.9.4. SWOT Analysis
- 11.1.1 EnerSys
- 11.2. Market Entropy
- 11.2.1 Company's Key Areas Served
- 11.2.2 Recent Developments
- 11.3. Company Market Share Analysis 2025
- 11.3.1 Top 5 Companies Market Share Analysis
- 11.3.2 Top 3 Companies Market Share Analysis
- 11.4. List of Potential Customers
- 12. Research Methodology
List of Figures
- Figure 1: Global MEA Battery Industry Revenue Breakdown (Million, %) by Region 2025 & 2033
- Figure 2: Global MEA Battery Industry Volume Breakdown (K Unit, %) by Region 2025 & 2033
- Figure 3: Saudi Arabia MEA Battery Industry Revenue (Million), by Type 2025 & 2033
- Figure 4: Saudi Arabia MEA Battery Industry Volume (K Unit), by Type 2025 & 2033
- Figure 5: Saudi Arabia MEA Battery Industry Revenue Share (%), by Type 2025 & 2033
- Figure 6: Saudi Arabia MEA Battery Industry Volume Share (%), by Type 2025 & 2033
- Figure 7: Saudi Arabia MEA Battery Industry Revenue (Million), by Technology 2025 & 2033
- Figure 8: Saudi Arabia MEA Battery Industry Volume (K Unit), by Technology 2025 & 2033
- Figure 9: Saudi Arabia MEA Battery Industry Revenue Share (%), by Technology 2025 & 2033
- Figure 10: Saudi Arabia MEA Battery Industry Volume Share (%), by Technology 2025 & 2033
- Figure 11: Saudi Arabia MEA Battery Industry Revenue (Million), by Application 2025 & 2033
- Figure 12: Saudi Arabia MEA Battery Industry Volume (K Unit), by Application 2025 & 2033
- Figure 13: Saudi Arabia MEA Battery Industry Revenue Share (%), by Application 2025 & 2033
- Figure 14: Saudi Arabia MEA Battery Industry Volume Share (%), by Application 2025 & 2033
- Figure 15: Saudi Arabia MEA Battery Industry Revenue (Million), by Geography 2025 & 2033
- Figure 16: Saudi Arabia MEA Battery Industry Volume (K Unit), by Geography 2025 & 2033
- Figure 17: Saudi Arabia MEA Battery Industry Revenue Share (%), by Geography 2025 & 2033
- Figure 18: Saudi Arabia MEA Battery Industry Volume Share (%), by Geography 2025 & 2033
- Figure 19: Saudi Arabia MEA Battery Industry Revenue (Million), by Country 2025 & 2033
- Figure 20: Saudi Arabia MEA Battery Industry Volume (K Unit), by Country 2025 & 2033
- Figure 21: Saudi Arabia MEA Battery Industry Revenue Share (%), by Country 2025 & 2033
- Figure 22: Saudi Arabia MEA Battery Industry Volume Share (%), by Country 2025 & 2033
- Figure 23: United Arab Emirates MEA Battery Industry Revenue (Million), by Type 2025 & 2033
- Figure 24: United Arab Emirates MEA Battery Industry Volume (K Unit), by Type 2025 & 2033
- Figure 25: United Arab Emirates MEA Battery Industry Revenue Share (%), by Type 2025 & 2033
- Figure 26: United Arab Emirates MEA Battery Industry Volume Share (%), by Type 2025 & 2033
- Figure 27: United Arab Emirates MEA Battery Industry Revenue (Million), by Technology 2025 & 2033
- Figure 28: United Arab Emirates MEA Battery Industry Volume (K Unit), by Technology 2025 & 2033
- Figure 29: United Arab Emirates MEA Battery Industry Revenue Share (%), by Technology 2025 & 2033
- Figure 30: United Arab Emirates MEA Battery Industry Volume Share (%), by Technology 2025 & 2033
- Figure 31: United Arab Emirates MEA Battery Industry Revenue (Million), by Application 2025 & 2033
- Figure 32: United Arab Emirates MEA Battery Industry Volume (K Unit), by Application 2025 & 2033
- Figure 33: United Arab Emirates MEA Battery Industry Revenue Share (%), by Application 2025 & 2033
- Figure 34: United Arab Emirates MEA Battery Industry Volume Share (%), by Application 2025 & 2033
- Figure 35: United Arab Emirates MEA Battery Industry Revenue (Million), by Geography 2025 & 2033
- Figure 36: United Arab Emirates MEA Battery Industry Volume (K Unit), by Geography 2025 & 2033
- Figure 37: United Arab Emirates MEA Battery Industry Revenue Share (%), by Geography 2025 & 2033
- Figure 38: United Arab Emirates MEA Battery Industry Volume Share (%), by Geography 2025 & 2033
- Figure 39: United Arab Emirates MEA Battery Industry Revenue (Million), by Country 2025 & 2033
- Figure 40: United Arab Emirates MEA Battery Industry Volume (K Unit), by Country 2025 & 2033
- Figure 41: United Arab Emirates MEA Battery Industry Revenue Share (%), by Country 2025 & 2033
- Figure 42: United Arab Emirates MEA Battery Industry Volume Share (%), by Country 2025 & 2033
- Figure 43: South Africa MEA Battery Industry Revenue (Million), by Type 2025 & 2033
- Figure 44: South Africa MEA Battery Industry Volume (K Unit), by Type 2025 & 2033
- Figure 45: South Africa MEA Battery Industry Revenue Share (%), by Type 2025 & 2033
- Figure 46: South Africa MEA Battery Industry Volume Share (%), by Type 2025 & 2033
- Figure 47: South Africa MEA Battery Industry Revenue (Million), by Technology 2025 & 2033
- Figure 48: South Africa MEA Battery Industry Volume (K Unit), by Technology 2025 & 2033
- Figure 49: South Africa MEA Battery Industry Revenue Share (%), by Technology 2025 & 2033
- Figure 50: South Africa MEA Battery Industry Volume Share (%), by Technology 2025 & 2033
- Figure 51: South Africa MEA Battery Industry Revenue (Million), by Application 2025 & 2033
- Figure 52: South Africa MEA Battery Industry Volume (K Unit), by Application 2025 & 2033
- Figure 53: South Africa MEA Battery Industry Revenue Share (%), by Application 2025 & 2033
- Figure 54: South Africa MEA Battery Industry Volume Share (%), by Application 2025 & 2033
- Figure 55: South Africa MEA Battery Industry Revenue (Million), by Geography 2025 & 2033
- Figure 56: South Africa MEA Battery Industry Volume (K Unit), by Geography 2025 & 2033
- Figure 57: South Africa MEA Battery Industry Revenue Share (%), by Geography 2025 & 2033
- Figure 58: South Africa MEA Battery Industry Volume Share (%), by Geography 2025 & 2033
- Figure 59: South Africa MEA Battery Industry Revenue (Million), by Country 2025 & 2033
- Figure 60: South Africa MEA Battery Industry Volume (K Unit), by Country 2025 & 2033
- Figure 61: South Africa MEA Battery Industry Revenue Share (%), by Country 2025 & 2033
- Figure 62: South Africa MEA Battery Industry Volume Share (%), by Country 2025 & 2033
- Figure 63: Rest of Middle East and Africa MEA Battery Industry Revenue (Million), by Type 2025 & 2033
- Figure 64: Rest of Middle East and Africa MEA Battery Industry Volume (K Unit), by Type 2025 & 2033
- Figure 65: Rest of Middle East and Africa MEA Battery Industry Revenue Share (%), by Type 2025 & 2033
- Figure 66: Rest of Middle East and Africa MEA Battery Industry Volume Share (%), by Type 2025 & 2033
- Figure 67: Rest of Middle East and Africa MEA Battery Industry Revenue (Million), by Technology 2025 & 2033
- Figure 68: Rest of Middle East and Africa MEA Battery Industry Volume (K Unit), by Technology 2025 & 2033
- Figure 69: Rest of Middle East and Africa MEA Battery Industry Revenue Share (%), by Technology 2025 & 2033
- Figure 70: Rest of Middle East and Africa MEA Battery Industry Volume Share (%), by Technology 2025 & 2033
- Figure 71: Rest of Middle East and Africa MEA Battery Industry Revenue (Million), by Application 2025 & 2033
- Figure 72: Rest of Middle East and Africa MEA Battery Industry Volume (K Unit), by Application 2025 & 2033
- Figure 73: Rest of Middle East and Africa MEA Battery Industry Revenue Share (%), by Application 2025 & 2033
- Figure 74: Rest of Middle East and Africa MEA Battery Industry Volume Share (%), by Application 2025 & 2033
- Figure 75: Rest of Middle East and Africa MEA Battery Industry Revenue (Million), by Geography 2025 & 2033
- Figure 76: Rest of Middle East and Africa MEA Battery Industry Volume (K Unit), by Geography 2025 & 2033
- Figure 77: Rest of Middle East and Africa MEA Battery Industry Revenue Share (%), by Geography 2025 & 2033
- Figure 78: Rest of Middle East and Africa MEA Battery Industry Volume Share (%), by Geography 2025 & 2033
- Figure 79: Rest of Middle East and Africa MEA Battery Industry Revenue (Million), by Country 2025 & 2033
- Figure 80: Rest of Middle East and Africa MEA Battery Industry Volume (K Unit), by Country 2025 & 2033
- Figure 81: Rest of Middle East and Africa MEA Battery Industry Revenue Share (%), by Country 2025 & 2033
- Figure 82: Rest of Middle East and Africa MEA Battery Industry Volume Share (%), by Country 2025 & 2033
List of Tables
- Table 1: Global MEA Battery Industry Revenue Million Forecast, by Type 2020 & 2033
- Table 2: Global MEA Battery Industry Volume K Unit Forecast, by Type 2020 & 2033
- Table 3: Global MEA Battery Industry Revenue Million Forecast, by Technology 2020 & 2033
- Table 4: Global MEA Battery Industry Volume K Unit Forecast, by Technology 2020 & 2033
- Table 5: Global MEA Battery Industry Revenue Million Forecast, by Application 2020 & 2033
- Table 6: Global MEA Battery Industry Volume K Unit Forecast, by Application 2020 & 2033
- Table 7: Global MEA Battery Industry Revenue Million Forecast, by Geography 2020 & 2033
- Table 8: Global MEA Battery Industry Volume K Unit Forecast, by Geography 2020 & 2033
- Table 9: Global MEA Battery Industry Revenue Million Forecast, by Region 2020 & 2033
- Table 10: Global MEA Battery Industry Volume K Unit Forecast, by Region 2020 & 2033
- Table 11: Global MEA Battery Industry Revenue Million Forecast, by Type 2020 & 2033
- Table 12: Global MEA Battery Industry Volume K Unit Forecast, by Type 2020 & 2033
- Table 13: Global MEA Battery Industry Revenue Million Forecast, by Technology 2020 & 2033
- Table 14: Global MEA Battery Industry Volume K Unit Forecast, by Technology 2020 & 2033
- Table 15: Global MEA Battery Industry Revenue Million Forecast, by Application 2020 & 2033
- Table 16: Global MEA Battery Industry Volume K Unit Forecast, by Application 2020 & 2033
- Table 17: Global MEA Battery Industry Revenue Million Forecast, by Geography 2020 & 2033
- Table 18: Global MEA Battery Industry Volume K Unit Forecast, by Geography 2020 & 2033
- Table 19: Global MEA Battery Industry Revenue Million Forecast, by Country 2020 & 2033
- Table 20: Global MEA Battery Industry Volume K Unit Forecast, by Country 2020 & 2033
- Table 21: Global MEA Battery Industry Revenue Million Forecast, by Type 2020 & 2033
- Table 22: Global MEA Battery Industry Volume K Unit Forecast, by Type 2020 & 2033
- Table 23: Global MEA Battery Industry Revenue Million Forecast, by Technology 2020 & 2033
- Table 24: Global MEA Battery Industry Volume K Unit Forecast, by Technology 2020 & 2033
- Table 25: Global MEA Battery Industry Revenue Million Forecast, by Application 2020 & 2033
- Table 26: Global MEA Battery Industry Volume K Unit Forecast, by Application 2020 & 2033
- Table 27: Global MEA Battery Industry Revenue Million Forecast, by Geography 2020 & 2033
- Table 28: Global MEA Battery Industry Volume K Unit Forecast, by Geography 2020 & 2033
- Table 29: Global MEA Battery Industry Revenue Million Forecast, by Country 2020 & 2033
- Table 30: Global MEA Battery Industry Volume K Unit Forecast, by Country 2020 & 2033
- Table 31: Global MEA Battery Industry Revenue Million Forecast, by Type 2020 & 2033
- Table 32: Global MEA Battery Industry Volume K Unit Forecast, by Type 2020 & 2033
- Table 33: Global MEA Battery Industry Revenue Million Forecast, by Technology 2020 & 2033
- Table 34: Global MEA Battery Industry Volume K Unit Forecast, by Technology 2020 & 2033
- Table 35: Global MEA Battery Industry Revenue Million Forecast, by Application 2020 & 2033
- Table 36: Global MEA Battery Industry Volume K Unit Forecast, by Application 2020 & 2033
- Table 37: Global MEA Battery Industry Revenue Million Forecast, by Geography 2020 & 2033
- Table 38: Global MEA Battery Industry Volume K Unit Forecast, by Geography 2020 & 2033
- Table 39: Global MEA Battery Industry Revenue Million Forecast, by Country 2020 & 2033
- Table 40: Global MEA Battery Industry Volume K Unit Forecast, by Country 2020 & 2033
- Table 41: Global MEA Battery Industry Revenue Million Forecast, by Type 2020 & 2033
- Table 42: Global MEA Battery Industry Volume K Unit Forecast, by Type 2020 & 2033
- Table 43: Global MEA Battery Industry Revenue Million Forecast, by Technology 2020 & 2033
- Table 44: Global MEA Battery Industry Volume K Unit Forecast, by Technology 2020 & 2033
- Table 45: Global MEA Battery Industry Revenue Million Forecast, by Application 2020 & 2033
- Table 46: Global MEA Battery Industry Volume K Unit Forecast, by Application 2020 & 2033
- Table 47: Global MEA Battery Industry Revenue Million Forecast, by Geography 2020 & 2033
- Table 48: Global MEA Battery Industry Volume K Unit Forecast, by Geography 2020 & 2033
- Table 49: Global MEA Battery Industry Revenue Million Forecast, by Country 2020 & 2033
- Table 50: Global MEA Battery Industry Volume K Unit Forecast, by Country 2020 & 2033
Frequently Asked Questions
1. What is the projected Compound Annual Growth Rate (CAGR) of the MEA Battery Industry?
The projected CAGR is approximately > 7.00%.
2. Which companies are prominent players in the MEA Battery Industry?
Key companies in the market include EnerSys, East Penn Manufacturing Co Inc, Exide Industries Ltd, Amara Raja Batteries Ltd, Middle East Battery Company (MEBCO), C&D Technologies Inc, First National Battery Pty Ltd, SAFT GROUPE SA, Panasonic Corporation.
3. What are the main segments of the MEA Battery Industry?
The market segments include Type, Technology, Application, Geography.
4. Can you provide details about the market size?
The market size is estimated to be USD 7.06 Million as of 2022.
5. What are some drivers contributing to market growth?
4.; Declining lithium-ion battery prices4.; Increasing adoption of electric vehicles.
6. What are the notable trends driving market growth?
Automotive Batteries Segment to Witness Significant Growth.
7. Are there any restraints impacting market growth?
4.; Demand-supply mismatch of raw materials.
8. Can you provide examples of recent developments in the market?
Aug 2023: Mahindra & Mahindra, India's fourth largest car manufacturer, unveiled the electric version of the Thar SUV at an event in South Africa. Apart from the Thar.e, Mahindra also unveiled seven new tractor models at the event in Cape Town, South Africa.
9. What pricing options are available for accessing the report?
Pricing options include single-user, multi-user, and enterprise licenses priced at USD 4750, USD 5250, and USD 8750 respectively.
10. Is the market size provided in terms of value or volume?
The market size is provided in terms of value, measured in Million and volume, measured in K Unit.
11. Are there any specific market keywords associated with the report?
Yes, the market keyword associated with the report is "MEA Battery Industry," which aids in identifying and referencing the specific market segment covered.
12. How do I determine which pricing option suits my needs best?
The pricing options vary based on user requirements and access needs. Individual users may opt for single-user licenses, while businesses requiring broader access may choose multi-user or enterprise licenses for cost-effective access to the report.
13. Are there any additional resources or data provided in the MEA Battery Industry report?
While the report offers comprehensive insights, it's advisable to review the specific contents or supplementary materials provided to ascertain if additional resources or data are available.
14. How can I stay updated on further developments or reports in the MEA Battery Industry?
To stay informed about further developments, trends, and reports in the MEA Battery Industry, consider subscribing to industry newsletters, following relevant companies and organizations, or regularly checking reputable industry news sources and publications.
Methodology
Step 1 - Identification of Relevant Samples Size from Population Database


Step 2 - Approaches for Defining Global Market Size (Value, Volume* & Price*)

Note*: In applicable scenarios
Step 3 - Data Sources
Primary Research
- Web Analytics
- Survey Reports
- Research Institute
- Latest Research Reports
- Opinion Leaders
Secondary Research
- Annual Reports
- White Paper
- Latest Press Release
- Industry Association
- Paid Database
- Investor Presentations

Step 4 - Data Triangulation
Involves using different sources of information in order to increase the validity of a study
These sources are likely to be stakeholders in a program - participants, other researchers, program staff, other community members, and so on.
Then we put all data in single framework & apply various statistical tools to find out the dynamic on the market.
During the analysis stage, feedback from the stakeholder groups would be compared to determine areas of agreement as well as areas of divergence