

Key Insights
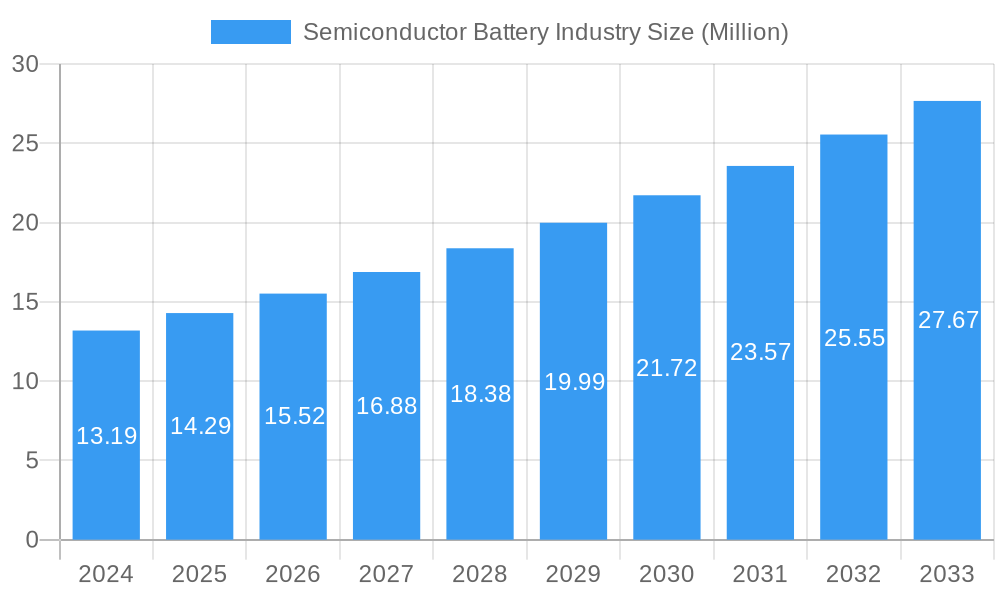
The global Semiconductor Battery market is projected for robust expansion, driven by the relentless demand for advanced power solutions across diverse sectors. Currently valued at an estimated $13.19 billion, the market is anticipated to grow at a Compound Annual Growth Rate (CAGR) of 8.67% through 2033. This significant upward trajectory is fueled by the increasing adoption of energy-dense and efficient battery technologies, particularly Lithium-Ion variants, which continue to dominate due to their superior performance in consumer electronics and the burgeoning electric vehicle (EV) segment. The expansion of energy storage systems, essential for grid stability and renewable energy integration, further bolsters market growth. Emerging battery chemistries like Sodium-Ion are also gaining traction, promising cost-effectiveness and sustainability, which will play a crucial role in expanding market reach.
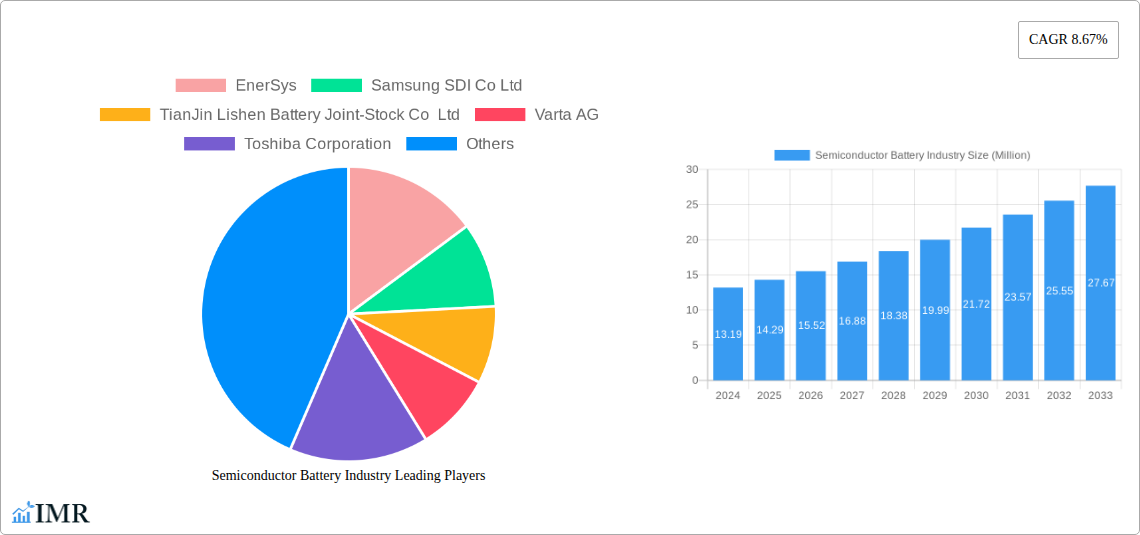
Semiconductor Battery Industry Market Size (In Million)
Key growth drivers include the escalating demand for portable consumer electronics, the global push towards decarbonization and the subsequent surge in electric vehicle production, and the critical need for reliable energy storage solutions to support smart grids and renewable energy infrastructure. While the market demonstrates strong growth potential, certain restraints such as raw material price volatility, the need for advanced recycling infrastructure, and stringent regulatory frameworks in some regions may pose challenges. Geographically, the Asia Pacific region, led by China and South Korea, is expected to remain a dominant force due to its manufacturing prowess and high adoption rates in EVs and consumer electronics. North America and Europe are also witnessing substantial growth, driven by supportive government policies and increasing investments in battery technology and infrastructure.
Semiconductor Battery Industry Company Market Share
This in-depth report provides a thorough analysis of the global Semiconductor Battery Industry, offering critical insights into market dynamics, growth trends, regional dominance, product landscape, key drivers, barriers, opportunities, and the competitive environment. Covering the historical period from 2019 to 2024, with a base and estimated year of 2025, and a comprehensive forecast period from 2025 to 2033, this report is an indispensable resource for stakeholders seeking to understand and capitalize on the evolving semiconductor battery market. We integrate high-traffic keywords and analyze parent and child markets to maximize search engine visibility and provide targeted intelligence for industry professionals.
Semiconductor Battery Industry Market Dynamics & Structure
The semiconductor battery industry is characterized by a dynamic interplay of technological innovation, evolving regulatory landscapes, and shifting end-user demands. Market concentration varies across different battery chemistries, with Lithium-Ion batteries currently dominating due to their established performance and widespread adoption in key applications like Electric Vehicles and Consumer Electronics. However, emerging technologies like Sodium-Ion batteries are gaining traction, driven by cost-effectiveness and sustainability concerns. Key drivers of innovation include the relentless pursuit of higher energy density, faster charging capabilities, improved safety, and extended cycle life, fueled by advancements in semiconductor materials science and battery management systems.
- Technological Innovation Drivers: Miniaturization of components, enhanced power management ICs, and novel material research for electrodes and electrolytes are central to advancements.
- Regulatory Frameworks: Government incentives for electric vehicle adoption and renewable energy storage, alongside environmental regulations, significantly shape market growth.
- Competitive Product Substitutes: While semiconductor batteries offer unique advantages, traditional batteries and alternative energy storage solutions present ongoing competition.
- End-User Demographics: The increasing demand for portable electronics, the rapid expansion of the EV market, and the growing need for grid-scale energy storage are major demographic influences.
- M&A Trends: Consolidation and strategic partnerships are prevalent as companies seek to secure supply chains, acquire critical technologies, and expand market reach. For instance, the sector has witnessed significant M&A activity focused on securing advanced material suppliers and manufacturing capabilities.
Semiconductor Battery Industry Growth Trends & Insights
The global Semiconductor Battery Industry is poised for substantial expansion, projected to witness a Compound Annual Growth Rate (CAGR) of XX% from 2025 to 2033. This robust growth is underpinned by a confluence of factors, including the escalating demand for portable and high-performance electronic devices, the accelerated transition towards electric mobility, and the imperative for efficient and scalable energy storage solutions to support renewable energy integration. The market size evolution is intrinsically linked to advancements in semiconductor technology that enable smaller, lighter, and more powerful battery systems. For example, the development of advanced semiconductor materials allows for the creation of batteries with significantly higher energy densities, a critical factor for extending the range of electric vehicles and improving the battery life of consumer electronics.
The adoption rates for semiconductor batteries are steadily increasing across various end-user applications. In the Consumer Electronics segment, the demand for thinner, lighter, and more powerful devices like smartphones, laptops, and wearables continues to drive innovation and adoption. Market penetration in this sector is already high, with continuous growth expected as new form factors and functionalities emerge. The Electric Vehicles (EVs) segment represents a major growth engine, with semiconductor battery technology playing a pivotal role in enhancing battery performance, safety, and charging speeds, thereby addressing consumer range anxiety and accelerating EV adoption. Forecasts indicate a significant surge in EV battery installations, directly impacting semiconductor battery demand.
Energy Storage Systems (ESS) are another critical area of growth. As grids worldwide integrate more renewable energy sources like solar and wind, the need for reliable and efficient energy storage solutions becomes paramount. Semiconductor batteries, with their potential for modularity, scalability, and advanced control, are well-positioned to meet these demands for grid stabilization, peak shaving, and off-grid applications. The underlying technological disruptions, such as breakthroughs in solid-state battery technology and advanced semiconductor materials for battery management, are creating new market opportunities and pushing the boundaries of what is currently possible. Consumer behavior shifts, including a growing preference for sustainable products and a willingness to embrace new technologies that offer enhanced convenience and performance, are also contributing to the upward trajectory of the semiconductor battery market. For instance, the increasing environmental consciousness among consumers is driving demand for EVs and renewable energy solutions, which in turn boosts the semiconductor battery market. The integration of smart features and AI-powered battery management systems within these devices further enhances their appeal and market penetration.
Dominant Regions, Countries, or Segments in Semiconductor Battery Industry
The Lithium-Ion Battery segment, within the broader semiconductor battery industry, is currently the most dominant and is expected to remain so throughout the forecast period. This dominance is driven by its established maturity, superior energy density, and widespread adoption across critical end-user applications. Lithium-ion technology has benefited from decades of research and development, leading to significant performance improvements and cost reductions, making it the go-to choice for a vast array of applications. Its versatility allows for customization to meet specific performance requirements, from high-power discharge for electric vehicles to sustained energy delivery for consumer electronics.
Within the end-user application landscape, Electric Vehicles (EVs) are emerging as the paramount growth driver and a key determinant of dominance for the semiconductor battery market. The global automotive industry's accelerated shift towards electrification, propelled by stringent emission regulations, government incentives, and growing consumer demand for sustainable transportation, is creating an insatiable appetite for advanced battery solutions. Countries with strong automotive manufacturing bases and proactive government policies supporting EV adoption, such as China, the United States, and key European nations, are leading this charge. The sheer volume of EVs projected to be produced in the coming years will necessitate massive scaling of semiconductor battery production, solidifying EVs' position as the most impactful end-user application.
- Dominant Region: Asia Pacific, particularly China, is projected to be the dominant region due to its extensive manufacturing capabilities, significant government support for battery research and development, and its position as the largest EV market globally.
- Key Country: China's unparalleled production capacity for batteries and its massive domestic EV market make it the single most influential country in the semiconductor battery landscape.
- Dominant Segment (Type): Lithium-Ion batteries are expected to hold the largest market share, driven by their established performance and ongoing technological advancements.
- Dominant Segment (End-User Application): Electric Vehicles are anticipated to be the largest and fastest-growing end-user application, significantly influencing the demand for semiconductor batteries.
- Growth Potential of Other Segments: While Lithium-Ion leads, Sodium-Ion batteries are showing promising growth potential, driven by their lower cost and abundant material availability, particularly for large-scale energy storage applications. Consumer Electronics will continue to be a significant market, albeit with slower growth compared to EVs.
Semiconductor Battery Industry Product Landscape
The product landscape of the semiconductor battery industry is characterized by continuous innovation aimed at enhancing energy density, improving charge/discharge rates, extending cycle life, and ensuring enhanced safety. Key advancements include the development of novel electrode materials, electrolyte formulations, and sophisticated battery management systems (BMS) that leverage semiconductor technology for intelligent power control and optimization. These innovations are driving the creation of batteries that are not only more powerful and efficient but also smaller and lighter, crucial for the development of next-generation portable electronics and electric vehicles. Unique selling propositions revolve around faster charging capabilities, longer operational lifespans, and enhanced thermal management, offering a competitive edge in demanding applications.
Key Drivers, Barriers & Challenges in Semiconductor Battery Industry
Key Drivers: The semiconductor battery industry is propelled by several powerful forces. The accelerating global shift towards electric vehicles, driven by environmental concerns and government mandates, is a primary catalyst. The burgeoning demand for sophisticated consumer electronics requiring higher energy density and longer battery life further fuels growth. Moreover, the increasing integration of renewable energy sources necessitates advanced energy storage solutions, creating a significant market for semiconductor batteries in grid-scale applications. Technological breakthroughs in material science and semiconductor manufacturing are continuously enabling higher performance and lower costs.
Key Barriers & Challenges: Despite its promising outlook, the industry faces significant barriers and challenges. High manufacturing costs associated with advanced semiconductor components and specialized battery chemistries remain a hurdle. Supply chain vulnerabilities, particularly for critical raw materials like lithium, cobalt, and nickel, can lead to price volatility and production disruptions. Stringent regulatory requirements and evolving safety standards necessitate substantial investment in R&D and testing. Intense competition from established battery technologies and the ongoing need for further innovation to overcome limitations like thermal runaway and degradation also present challenges. Supply chain disruptions, exacerbated by geopolitical factors, can impact the availability and cost of essential materials, with an estimated XX% potential increase in component costs during periods of scarcity.
Emerging Opportunities in Semiconductor Battery Industry
Emerging opportunities in the semiconductor battery industry lie in several key areas. The development of solid-state batteries represents a significant frontier, promising enhanced safety, higher energy density, and faster charging compared to current lithium-ion technologies. Untapped markets in developing economies with increasing electrification initiatives and a growing middle class present substantial growth potential. Innovative applications in areas like advanced robotics, medical devices, and aerospace demand highly specialized and high-performance semiconductor battery solutions. Furthermore, the circular economy trend is driving opportunities for battery recycling and second-life applications, creating sustainable revenue streams and reducing environmental impact.
Growth Accelerators in the Semiconductor Battery Industry Industry
Several growth accelerators are poised to significantly propel the semiconductor battery industry forward. Continued advancements in semiconductor fabrication processes and material science are expected to drive down production costs and enhance battery performance, making them more accessible and competitive. Strategic partnerships and collaborations between semiconductor manufacturers, battery producers, and end-user application developers are crucial for accelerating the commercialization of new technologies and fostering innovation. Market expansion strategies, including the development of modular battery systems for diverse applications and the establishment of robust global supply chains, will further enhance market penetration and adoption rates.
Key Players Shaping the Semiconductor Battery Industry Market
- EnerSys
- Samsung SDI Co Ltd
- TianJin Lishen Battery Joint-Stock Co Ltd
- Varta AG
- Toshiba Corporation
- Faradion Limited
- GS Yuasa Corporation
- Routejade
- Panasonic Corporation
- Sony Corporation
Notable Milestones in Semiconductor Battery Industry Sector
- February 2022: ROHM Semiconductor announced the development of a new evaluation board, REFLVBMS001-EVK-001, for ultra-efficient semiconductor battery operations, specifically targeting newly developed Internet of Things devices. This development signifies a focus on optimizing power management for low-power applications.
- February 2022: Solus Advanced Material announced its strategic decision to diversify its business operations by establishing overseas production facilities for developing semiconductor batteries and battery foils. The company projected a significant increase in sales by the end of 2026, indicating strong confidence in the market's future growth and their ability to capture market share through expanded manufacturing capacity.
In-Depth Semiconductor Battery Industry Market Outlook
The future outlook for the semiconductor battery industry is exceptionally bright, driven by ongoing technological innovation and expanding market applications. Growth accelerators such as breakthroughs in solid-state battery technology and advancements in semiconductor materials will continue to push performance boundaries, while strategic partnerships will streamline development and commercialization. The increasing global focus on decarbonization and the electrification of transportation and energy systems will create sustained demand for high-performance and sustainable battery solutions. Companies that can navigate supply chain complexities and effectively capitalize on the demand for energy-efficient, long-lasting, and rapidly charging battery systems are well-positioned for significant growth in the coming years. The market is expected to see continued investment in R&D and manufacturing capacity to meet the escalating needs of the Electric Vehicle and Energy Storage System sectors.
Semiconductor Battery Industry Segmentation
-
1. Type
- 1.1. Lithium-Ion
- 1.2. Nickel-Metal Hydride
- 1.3. Lithium-Ion Polymer
- 1.4. Sodium-Ion Battery
-
2. End-User Application
- 2.1. Consumer Electronics
- 2.2. Electric Vehicles
- 2.3. Energy Storage System
- 2.4. Other End-User Applications
Semiconductor Battery Industry Segmentation By Geography
-
1. North America
- 1.1. United States
- 1.2. Canada
- 1.3. Rest of North America
-
2. Asia Pacific
- 2.1. China
- 2.2. India
- 2.3. Japan
- 2.4. South Korea
- 2.5. Rest of Asia Pacific
-
3. Europe
- 3.1. Germany
- 3.2. United Kingdom
- 3.3. France
- 3.4. Italy
- 3.5. Rest of Europe
-
4. South America
- 4.1. Chile
- 4.2. Brazil
- 4.3. Argentina
- 4.4. Rest of South America
-
5. Middle East and Africa
- 5.1. Saudi Arabia
- 5.2. United Arab Emirates
- 5.3. South Africa
- 5.4. Egypt
- 5.5. Rest of Middle East and Africa
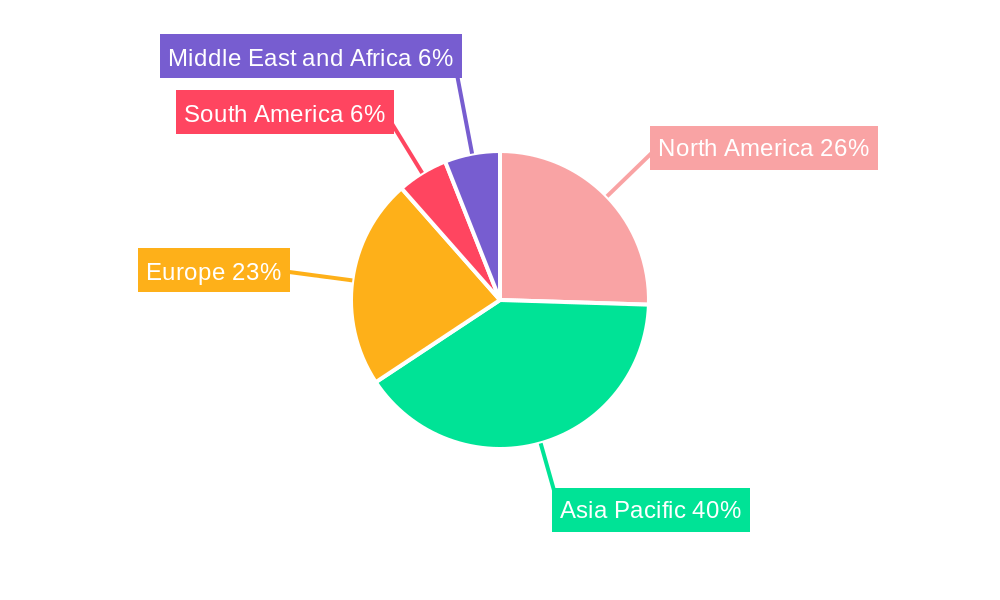
Semiconductor Battery Industry Regional Market Share
Geographic Coverage of Semiconductor Battery Industry
Semiconductor Battery Industry REPORT HIGHLIGHTS
| Aspects | Details |
|---|---|
| Study Period | 2020-2034 |
| Base Year | 2025 |
| Estimated Year | 2026 |
| Forecast Period | 2026-2034 |
| Historical Period | 2020-2025 |
| Growth Rate | CAGR of 8.67% from 2020-2034 |
| Segmentation |
|
Table of Contents
- 1. Introduction
- 1.1. Research Scope
- 1.2. Market Segmentation
- 1.3. Research Objective
- 1.4. Definitions and Assumptions
- 2. Executive Summary
- 2.1. Market Snapshot
- 3. Market Dynamics
- 3.1. Market Drivers
- 3.2. Market Restrains
- 3.3. Market Trends
- 3.4. Market Opportunities
- 4. Market Factor Analysis
- 4.1. Porters Five Forces
- 4.1.1. Bargaining Power of Suppliers
- 4.1.2. Bargaining Power of Buyers
- 4.1.3. Threat of New Entrants
- 4.1.4. Threat of Substitutes
- 4.1.5. Competitive Rivalry
- 4.2. PESTEL analysis
- 4.3. BCG Analysis
- 4.3.1. Stars (High Growth, High Market Share)
- 4.3.2. Cash Cows (Low Growth, High Market Share)
- 4.3.3. Question Mark (High Growth, Low Market Share)
- 4.3.4. Dogs (Low Growth, Low Market Share)
- 4.4. Ansoff Matrix Analysis
- 4.5. Supply Chain Analysis
- 4.6. Regulatory Landscape
- 4.7. Current Market Potential and Opportunity Assessment (TAM–SAM–SOM Framework)
- 4.8. IMR Analyst Note
- 4.1. Porters Five Forces
- 5. Market Analysis, Insights and Forecast 2021-2033
- 5.1. Market Analysis, Insights and Forecast - by Type
- 5.1.1. Lithium-Ion
- 5.1.2. Nickel-Metal Hydride
- 5.1.3. Lithium-Ion Polymer
- 5.1.4. Sodium-Ion Battery
- 5.2. Market Analysis, Insights and Forecast - by End-User Application
- 5.2.1. Consumer Electronics
- 5.2.2. Electric Vehicles
- 5.2.3. Energy Storage System
- 5.2.4. Other End-User Applications
- 5.3. Market Analysis, Insights and Forecast - by Region
- 5.3.1. North America
- 5.3.2. Asia Pacific
- 5.3.3. Europe
- 5.3.4. South America
- 5.3.5. Middle East and Africa
- 5.1. Market Analysis, Insights and Forecast - by Type
- 6. Global Semiconductor Battery Industry Analysis, Insights and Forecast, 2021-2033
- 6.1. Market Analysis, Insights and Forecast - by Type
- 6.1.1. Lithium-Ion
- 6.1.2. Nickel-Metal Hydride
- 6.1.3. Lithium-Ion Polymer
- 6.1.4. Sodium-Ion Battery
- 6.2. Market Analysis, Insights and Forecast - by End-User Application
- 6.2.1. Consumer Electronics
- 6.2.2. Electric Vehicles
- 6.2.3. Energy Storage System
- 6.2.4. Other End-User Applications
- 6.1. Market Analysis, Insights and Forecast - by Type
- 7. North America Semiconductor Battery Industry Analysis, Insights and Forecast, 2020-2032
- 7.1. Market Analysis, Insights and Forecast - by Type
- 7.1.1. Lithium-Ion
- 7.1.2. Nickel-Metal Hydride
- 7.1.3. Lithium-Ion Polymer
- 7.1.4. Sodium-Ion Battery
- 7.2. Market Analysis, Insights and Forecast - by End-User Application
- 7.2.1. Consumer Electronics
- 7.2.2. Electric Vehicles
- 7.2.3. Energy Storage System
- 7.2.4. Other End-User Applications
- 7.1. Market Analysis, Insights and Forecast - by Type
- 8. Asia Pacific Semiconductor Battery Industry Analysis, Insights and Forecast, 2020-2032
- 8.1. Market Analysis, Insights and Forecast - by Type
- 8.1.1. Lithium-Ion
- 8.1.2. Nickel-Metal Hydride
- 8.1.3. Lithium-Ion Polymer
- 8.1.4. Sodium-Ion Battery
- 8.2. Market Analysis, Insights and Forecast - by End-User Application
- 8.2.1. Consumer Electronics
- 8.2.2. Electric Vehicles
- 8.2.3. Energy Storage System
- 8.2.4. Other End-User Applications
- 8.1. Market Analysis, Insights and Forecast - by Type
- 9. Europe Semiconductor Battery Industry Analysis, Insights and Forecast, 2020-2032
- 9.1. Market Analysis, Insights and Forecast - by Type
- 9.1.1. Lithium-Ion
- 9.1.2. Nickel-Metal Hydride
- 9.1.3. Lithium-Ion Polymer
- 9.1.4. Sodium-Ion Battery
- 9.2. Market Analysis, Insights and Forecast - by End-User Application
- 9.2.1. Consumer Electronics
- 9.2.2. Electric Vehicles
- 9.2.3. Energy Storage System
- 9.2.4. Other End-User Applications
- 9.1. Market Analysis, Insights and Forecast - by Type
- 10. South America Semiconductor Battery Industry Analysis, Insights and Forecast, 2020-2032
- 10.1. Market Analysis, Insights and Forecast - by Type
- 10.1.1. Lithium-Ion
- 10.1.2. Nickel-Metal Hydride
- 10.1.3. Lithium-Ion Polymer
- 10.1.4. Sodium-Ion Battery
- 10.2. Market Analysis, Insights and Forecast - by End-User Application
- 10.2.1. Consumer Electronics
- 10.2.2. Electric Vehicles
- 10.2.3. Energy Storage System
- 10.2.4. Other End-User Applications
- 10.1. Market Analysis, Insights and Forecast - by Type
- 11. Middle East and Africa Semiconductor Battery Industry Analysis, Insights and Forecast, 2020-2032
- 11.1. Market Analysis, Insights and Forecast - by Type
- 11.1.1. Lithium-Ion
- 11.1.2. Nickel-Metal Hydride
- 11.1.3. Lithium-Ion Polymer
- 11.1.4. Sodium-Ion Battery
- 11.2. Market Analysis, Insights and Forecast - by End-User Application
- 11.2.1. Consumer Electronics
- 11.2.2. Electric Vehicles
- 11.2.3. Energy Storage System
- 11.2.4. Other End-User Applications
- 11.1. Market Analysis, Insights and Forecast - by Type
- 12. Competitive Analysis
- 12.1. Company Profiles
- 12.1.1 EnerSys
- 12.1.1.1. Company Overview
- 12.1.1.2. Products
- 12.1.1.3. Company Financials
- 12.1.1.4. SWOT Analysis
- 12.1.2 Samsung SDI Co Ltd
- 12.1.2.1. Company Overview
- 12.1.2.2. Products
- 12.1.2.3. Company Financials
- 12.1.2.4. SWOT Analysis
- 12.1.3 TianJin Lishen Battery Joint-Stock Co Ltd
- 12.1.3.1. Company Overview
- 12.1.3.2. Products
- 12.1.3.3. Company Financials
- 12.1.3.4. SWOT Analysis
- 12.1.4 Varta AG
- 12.1.4.1. Company Overview
- 12.1.4.2. Products
- 12.1.4.3. Company Financials
- 12.1.4.4. SWOT Analysis
- 12.1.5 Toshiba Corporation
- 12.1.5.1. Company Overview
- 12.1.5.2. Products
- 12.1.5.3. Company Financials
- 12.1.5.4. SWOT Analysis
- 12.1.6 Faradion Limited
- 12.1.6.1. Company Overview
- 12.1.6.2. Products
- 12.1.6.3. Company Financials
- 12.1.6.4. SWOT Analysis
- 12.1.7 GS Yuasa Corporation
- 12.1.7.1. Company Overview
- 12.1.7.2. Products
- 12.1.7.3. Company Financials
- 12.1.7.4. SWOT Analysis
- 12.1.8 Routejade
- 12.1.8.1. Company Overview
- 12.1.8.2. Products
- 12.1.8.3. Company Financials
- 12.1.8.4. SWOT Analysis
- 12.1.9 Panasonic Corporation
- 12.1.9.1. Company Overview
- 12.1.9.2. Products
- 12.1.9.3. Company Financials
- 12.1.9.4. SWOT Analysis
- 12.1.10 Sony Corporation
- 12.1.10.1. Company Overview
- 12.1.10.2. Products
- 12.1.10.3. Company Financials
- 12.1.10.4. SWOT Analysis
- 12.1.1 EnerSys
- 12.2. Market Entropy
- 12.2.1 Company's Key Areas Served
- 12.2.2 Recent Developments
- 12.3. Company Market Share Analysis 2025
- 12.3.1 Top 5 Companies Market Share Analysis
- 12.3.2 Top 3 Companies Market Share Analysis
- 12.4. List of Potential Customers
- 13. Research Methodology
List of Figures
- Figure 1: Global Semiconductor Battery Industry Revenue Breakdown (Million, %) by Region 2025 & 2033
- Figure 2: Global Semiconductor Battery Industry Volume Breakdown (K Unit, %) by Region 2025 & 2033
- Figure 3: North America Semiconductor Battery Industry Revenue (Million), by Type 2025 & 2033
- Figure 4: North America Semiconductor Battery Industry Volume (K Unit), by Type 2025 & 2033
- Figure 5: North America Semiconductor Battery Industry Revenue Share (%), by Type 2025 & 2033
- Figure 6: North America Semiconductor Battery Industry Volume Share (%), by Type 2025 & 2033
- Figure 7: North America Semiconductor Battery Industry Revenue (Million), by End-User Application 2025 & 2033
- Figure 8: North America Semiconductor Battery Industry Volume (K Unit), by End-User Application 2025 & 2033
- Figure 9: North America Semiconductor Battery Industry Revenue Share (%), by End-User Application 2025 & 2033
- Figure 10: North America Semiconductor Battery Industry Volume Share (%), by End-User Application 2025 & 2033
- Figure 11: North America Semiconductor Battery Industry Revenue (Million), by Country 2025 & 2033
- Figure 12: North America Semiconductor Battery Industry Volume (K Unit), by Country 2025 & 2033
- Figure 13: North America Semiconductor Battery Industry Revenue Share (%), by Country 2025 & 2033
- Figure 14: North America Semiconductor Battery Industry Volume Share (%), by Country 2025 & 2033
- Figure 15: Asia Pacific Semiconductor Battery Industry Revenue (Million), by Type 2025 & 2033
- Figure 16: Asia Pacific Semiconductor Battery Industry Volume (K Unit), by Type 2025 & 2033
- Figure 17: Asia Pacific Semiconductor Battery Industry Revenue Share (%), by Type 2025 & 2033
- Figure 18: Asia Pacific Semiconductor Battery Industry Volume Share (%), by Type 2025 & 2033
- Figure 19: Asia Pacific Semiconductor Battery Industry Revenue (Million), by End-User Application 2025 & 2033
- Figure 20: Asia Pacific Semiconductor Battery Industry Volume (K Unit), by End-User Application 2025 & 2033
- Figure 21: Asia Pacific Semiconductor Battery Industry Revenue Share (%), by End-User Application 2025 & 2033
- Figure 22: Asia Pacific Semiconductor Battery Industry Volume Share (%), by End-User Application 2025 & 2033
- Figure 23: Asia Pacific Semiconductor Battery Industry Revenue (Million), by Country 2025 & 2033
- Figure 24: Asia Pacific Semiconductor Battery Industry Volume (K Unit), by Country 2025 & 2033
- Figure 25: Asia Pacific Semiconductor Battery Industry Revenue Share (%), by Country 2025 & 2033
- Figure 26: Asia Pacific Semiconductor Battery Industry Volume Share (%), by Country 2025 & 2033
- Figure 27: Europe Semiconductor Battery Industry Revenue (Million), by Type 2025 & 2033
- Figure 28: Europe Semiconductor Battery Industry Volume (K Unit), by Type 2025 & 2033
- Figure 29: Europe Semiconductor Battery Industry Revenue Share (%), by Type 2025 & 2033
- Figure 30: Europe Semiconductor Battery Industry Volume Share (%), by Type 2025 & 2033
- Figure 31: Europe Semiconductor Battery Industry Revenue (Million), by End-User Application 2025 & 2033
- Figure 32: Europe Semiconductor Battery Industry Volume (K Unit), by End-User Application 2025 & 2033
- Figure 33: Europe Semiconductor Battery Industry Revenue Share (%), by End-User Application 2025 & 2033
- Figure 34: Europe Semiconductor Battery Industry Volume Share (%), by End-User Application 2025 & 2033
- Figure 35: Europe Semiconductor Battery Industry Revenue (Million), by Country 2025 & 2033
- Figure 36: Europe Semiconductor Battery Industry Volume (K Unit), by Country 2025 & 2033
- Figure 37: Europe Semiconductor Battery Industry Revenue Share (%), by Country 2025 & 2033
- Figure 38: Europe Semiconductor Battery Industry Volume Share (%), by Country 2025 & 2033
- Figure 39: South America Semiconductor Battery Industry Revenue (Million), by Type 2025 & 2033
- Figure 40: South America Semiconductor Battery Industry Volume (K Unit), by Type 2025 & 2033
- Figure 41: South America Semiconductor Battery Industry Revenue Share (%), by Type 2025 & 2033
- Figure 42: South America Semiconductor Battery Industry Volume Share (%), by Type 2025 & 2033
- Figure 43: South America Semiconductor Battery Industry Revenue (Million), by End-User Application 2025 & 2033
- Figure 44: South America Semiconductor Battery Industry Volume (K Unit), by End-User Application 2025 & 2033
- Figure 45: South America Semiconductor Battery Industry Revenue Share (%), by End-User Application 2025 & 2033
- Figure 46: South America Semiconductor Battery Industry Volume Share (%), by End-User Application 2025 & 2033
- Figure 47: South America Semiconductor Battery Industry Revenue (Million), by Country 2025 & 2033
- Figure 48: South America Semiconductor Battery Industry Volume (K Unit), by Country 2025 & 2033
- Figure 49: South America Semiconductor Battery Industry Revenue Share (%), by Country 2025 & 2033
- Figure 50: South America Semiconductor Battery Industry Volume Share (%), by Country 2025 & 2033
- Figure 51: Middle East and Africa Semiconductor Battery Industry Revenue (Million), by Type 2025 & 2033
- Figure 52: Middle East and Africa Semiconductor Battery Industry Volume (K Unit), by Type 2025 & 2033
- Figure 53: Middle East and Africa Semiconductor Battery Industry Revenue Share (%), by Type 2025 & 2033
- Figure 54: Middle East and Africa Semiconductor Battery Industry Volume Share (%), by Type 2025 & 2033
- Figure 55: Middle East and Africa Semiconductor Battery Industry Revenue (Million), by End-User Application 2025 & 2033
- Figure 56: Middle East and Africa Semiconductor Battery Industry Volume (K Unit), by End-User Application 2025 & 2033
- Figure 57: Middle East and Africa Semiconductor Battery Industry Revenue Share (%), by End-User Application 2025 & 2033
- Figure 58: Middle East and Africa Semiconductor Battery Industry Volume Share (%), by End-User Application 2025 & 2033
- Figure 59: Middle East and Africa Semiconductor Battery Industry Revenue (Million), by Country 2025 & 2033
- Figure 60: Middle East and Africa Semiconductor Battery Industry Volume (K Unit), by Country 2025 & 2033
- Figure 61: Middle East and Africa Semiconductor Battery Industry Revenue Share (%), by Country 2025 & 2033
- Figure 62: Middle East and Africa Semiconductor Battery Industry Volume Share (%), by Country 2025 & 2033
List of Tables
- Table 1: Global Semiconductor Battery Industry Revenue Million Forecast, by Type 2020 & 2033
- Table 2: Global Semiconductor Battery Industry Volume K Unit Forecast, by Type 2020 & 2033
- Table 3: Global Semiconductor Battery Industry Revenue Million Forecast, by End-User Application 2020 & 2033
- Table 4: Global Semiconductor Battery Industry Volume K Unit Forecast, by End-User Application 2020 & 2033
- Table 5: Global Semiconductor Battery Industry Revenue Million Forecast, by Region 2020 & 2033
- Table 6: Global Semiconductor Battery Industry Volume K Unit Forecast, by Region 2020 & 2033
- Table 7: Global Semiconductor Battery Industry Revenue Million Forecast, by Type 2020 & 2033
- Table 8: Global Semiconductor Battery Industry Volume K Unit Forecast, by Type 2020 & 2033
- Table 9: Global Semiconductor Battery Industry Revenue Million Forecast, by End-User Application 2020 & 2033
- Table 10: Global Semiconductor Battery Industry Volume K Unit Forecast, by End-User Application 2020 & 2033
- Table 11: Global Semiconductor Battery Industry Revenue Million Forecast, by Country 2020 & 2033
- Table 12: Global Semiconductor Battery Industry Volume K Unit Forecast, by Country 2020 & 2033
- Table 13: United States Semiconductor Battery Industry Revenue (Million) Forecast, by Application 2020 & 2033
- Table 14: United States Semiconductor Battery Industry Volume (K Unit) Forecast, by Application 2020 & 2033
- Table 15: Canada Semiconductor Battery Industry Revenue (Million) Forecast, by Application 2020 & 2033
- Table 16: Canada Semiconductor Battery Industry Volume (K Unit) Forecast, by Application 2020 & 2033
- Table 17: Rest of North America Semiconductor Battery Industry Revenue (Million) Forecast, by Application 2020 & 2033
- Table 18: Rest of North America Semiconductor Battery Industry Volume (K Unit) Forecast, by Application 2020 & 2033
- Table 19: Global Semiconductor Battery Industry Revenue Million Forecast, by Type 2020 & 2033
- Table 20: Global Semiconductor Battery Industry Volume K Unit Forecast, by Type 2020 & 2033
- Table 21: Global Semiconductor Battery Industry Revenue Million Forecast, by End-User Application 2020 & 2033
- Table 22: Global Semiconductor Battery Industry Volume K Unit Forecast, by End-User Application 2020 & 2033
- Table 23: Global Semiconductor Battery Industry Revenue Million Forecast, by Country 2020 & 2033
- Table 24: Global Semiconductor Battery Industry Volume K Unit Forecast, by Country 2020 & 2033
- Table 25: China Semiconductor Battery Industry Revenue (Million) Forecast, by Application 2020 & 2033
- Table 26: China Semiconductor Battery Industry Volume (K Unit) Forecast, by Application 2020 & 2033
- Table 27: India Semiconductor Battery Industry Revenue (Million) Forecast, by Application 2020 & 2033
- Table 28: India Semiconductor Battery Industry Volume (K Unit) Forecast, by Application 2020 & 2033
- Table 29: Japan Semiconductor Battery Industry Revenue (Million) Forecast, by Application 2020 & 2033
- Table 30: Japan Semiconductor Battery Industry Volume (K Unit) Forecast, by Application 2020 & 2033
- Table 31: South Korea Semiconductor Battery Industry Revenue (Million) Forecast, by Application 2020 & 2033
- Table 32: South Korea Semiconductor Battery Industry Volume (K Unit) Forecast, by Application 2020 & 2033
- Table 33: Rest of Asia Pacific Semiconductor Battery Industry Revenue (Million) Forecast, by Application 2020 & 2033
- Table 34: Rest of Asia Pacific Semiconductor Battery Industry Volume (K Unit) Forecast, by Application 2020 & 2033
- Table 35: Global Semiconductor Battery Industry Revenue Million Forecast, by Type 2020 & 2033
- Table 36: Global Semiconductor Battery Industry Volume K Unit Forecast, by Type 2020 & 2033
- Table 37: Global Semiconductor Battery Industry Revenue Million Forecast, by End-User Application 2020 & 2033
- Table 38: Global Semiconductor Battery Industry Volume K Unit Forecast, by End-User Application 2020 & 2033
- Table 39: Global Semiconductor Battery Industry Revenue Million Forecast, by Country 2020 & 2033
- Table 40: Global Semiconductor Battery Industry Volume K Unit Forecast, by Country 2020 & 2033
- Table 41: Germany Semiconductor Battery Industry Revenue (Million) Forecast, by Application 2020 & 2033
- Table 42: Germany Semiconductor Battery Industry Volume (K Unit) Forecast, by Application 2020 & 2033
- Table 43: United Kingdom Semiconductor Battery Industry Revenue (Million) Forecast, by Application 2020 & 2033
- Table 44: United Kingdom Semiconductor Battery Industry Volume (K Unit) Forecast, by Application 2020 & 2033
- Table 45: France Semiconductor Battery Industry Revenue (Million) Forecast, by Application 2020 & 2033
- Table 46: France Semiconductor Battery Industry Volume (K Unit) Forecast, by Application 2020 & 2033
- Table 47: Italy Semiconductor Battery Industry Revenue (Million) Forecast, by Application 2020 & 2033
- Table 48: Italy Semiconductor Battery Industry Volume (K Unit) Forecast, by Application 2020 & 2033
- Table 49: Rest of Europe Semiconductor Battery Industry Revenue (Million) Forecast, by Application 2020 & 2033
- Table 50: Rest of Europe Semiconductor Battery Industry Volume (K Unit) Forecast, by Application 2020 & 2033
- Table 51: Global Semiconductor Battery Industry Revenue Million Forecast, by Type 2020 & 2033
- Table 52: Global Semiconductor Battery Industry Volume K Unit Forecast, by Type 2020 & 2033
- Table 53: Global Semiconductor Battery Industry Revenue Million Forecast, by End-User Application 2020 & 2033
- Table 54: Global Semiconductor Battery Industry Volume K Unit Forecast, by End-User Application 2020 & 2033
- Table 55: Global Semiconductor Battery Industry Revenue Million Forecast, by Country 2020 & 2033
- Table 56: Global Semiconductor Battery Industry Volume K Unit Forecast, by Country 2020 & 2033
- Table 57: Chile Semiconductor Battery Industry Revenue (Million) Forecast, by Application 2020 & 2033
- Table 58: Chile Semiconductor Battery Industry Volume (K Unit) Forecast, by Application 2020 & 2033
- Table 59: Brazil Semiconductor Battery Industry Revenue (Million) Forecast, by Application 2020 & 2033
- Table 60: Brazil Semiconductor Battery Industry Volume (K Unit) Forecast, by Application 2020 & 2033
- Table 61: Argentina Semiconductor Battery Industry Revenue (Million) Forecast, by Application 2020 & 2033
- Table 62: Argentina Semiconductor Battery Industry Volume (K Unit) Forecast, by Application 2020 & 2033
- Table 63: Rest of South America Semiconductor Battery Industry Revenue (Million) Forecast, by Application 2020 & 2033
- Table 64: Rest of South America Semiconductor Battery Industry Volume (K Unit) Forecast, by Application 2020 & 2033
- Table 65: Global Semiconductor Battery Industry Revenue Million Forecast, by Type 2020 & 2033
- Table 66: Global Semiconductor Battery Industry Volume K Unit Forecast, by Type 2020 & 2033
- Table 67: Global Semiconductor Battery Industry Revenue Million Forecast, by End-User Application 2020 & 2033
- Table 68: Global Semiconductor Battery Industry Volume K Unit Forecast, by End-User Application 2020 & 2033
- Table 69: Global Semiconductor Battery Industry Revenue Million Forecast, by Country 2020 & 2033
- Table 70: Global Semiconductor Battery Industry Volume K Unit Forecast, by Country 2020 & 2033
- Table 71: Saudi Arabia Semiconductor Battery Industry Revenue (Million) Forecast, by Application 2020 & 2033
- Table 72: Saudi Arabia Semiconductor Battery Industry Volume (K Unit) Forecast, by Application 2020 & 2033
- Table 73: United Arab Emirates Semiconductor Battery Industry Revenue (Million) Forecast, by Application 2020 & 2033
- Table 74: United Arab Emirates Semiconductor Battery Industry Volume (K Unit) Forecast, by Application 2020 & 2033
- Table 75: South Africa Semiconductor Battery Industry Revenue (Million) Forecast, by Application 2020 & 2033
- Table 76: South Africa Semiconductor Battery Industry Volume (K Unit) Forecast, by Application 2020 & 2033
- Table 77: Egypt Semiconductor Battery Industry Revenue (Million) Forecast, by Application 2020 & 2033
- Table 78: Egypt Semiconductor Battery Industry Volume (K Unit) Forecast, by Application 2020 & 2033
- Table 79: Rest of Middle East and Africa Semiconductor Battery Industry Revenue (Million) Forecast, by Application 2020 & 2033
- Table 80: Rest of Middle East and Africa Semiconductor Battery Industry Volume (K Unit) Forecast, by Application 2020 & 2033
Frequently Asked Questions
1. What is the projected Compound Annual Growth Rate (CAGR) of the Semiconductor Battery Industry?
The projected CAGR is approximately 8.67%.
2. Which companies are prominent players in the Semiconductor Battery Industry?
Key companies in the market include EnerSys, Samsung SDI Co Ltd, TianJin Lishen Battery Joint-Stock Co Ltd, Varta AG, Toshiba Corporation, Faradion Limited, GS Yuasa Corporation, Routejade, Panasonic Corporation, Sony Corporation.
3. What are the main segments of the Semiconductor Battery Industry?
The market segments include Type, End-User Application.
4. Can you provide details about the market size?
The market size is estimated to be USD 13.19 Million as of 2022.
5. What are some drivers contributing to market growth?
4.; Increasing Demand for Mobile Devices4.; Rising Adaption of Electric Vehicles.
6. What are the notable trends driving market growth?
The Electric Vehicle Segment is Expected to Witness Significant Demand.
7. Are there any restraints impacting market growth?
4.; Availability of Technical Challenges.
8. Can you provide examples of recent developments in the market?
February 2022: ROHM Semiconductor announced that the company developed a new evaluation board for ultra-efficient semiconductor battery operations for the newly developed Internet of Things devices called REFLVBMS001-EVK-001.
9. What pricing options are available for accessing the report?
Pricing options include single-user, multi-user, and enterprise licenses priced at USD 4750, USD 5250, and USD 8750 respectively.
10. Is the market size provided in terms of value or volume?
The market size is provided in terms of value, measured in Million and volume, measured in K Unit.
11. Are there any specific market keywords associated with the report?
Yes, the market keyword associated with the report is "Semiconductor Battery Industry," which aids in identifying and referencing the specific market segment covered.
12. How do I determine which pricing option suits my needs best?
The pricing options vary based on user requirements and access needs. Individual users may opt for single-user licenses, while businesses requiring broader access may choose multi-user or enterprise licenses for cost-effective access to the report.
13. Are there any additional resources or data provided in the Semiconductor Battery Industry report?
While the report offers comprehensive insights, it's advisable to review the specific contents or supplementary materials provided to ascertain if additional resources or data are available.
14. How can I stay updated on further developments or reports in the Semiconductor Battery Industry?
To stay informed about further developments, trends, and reports in the Semiconductor Battery Industry, consider subscribing to industry newsletters, following relevant companies and organizations, or regularly checking reputable industry news sources and publications.
Methodology
Step 1 - Identification of Relevant Samples Size from Population Database


Step 2 - Approaches for Defining Global Market Size (Value, Volume* & Price*)

Note*: In applicable scenarios
Step 3 - Data Sources
Primary Research
- Web Analytics
- Survey Reports
- Research Institute
- Latest Research Reports
- Opinion Leaders
Secondary Research
- Annual Reports
- White Paper
- Latest Press Release
- Industry Association
- Paid Database
- Investor Presentations

Step 4 - Data Triangulation
Involves using different sources of information in order to increase the validity of a study
These sources are likely to be stakeholders in a program - participants, other researchers, program staff, other community members, and so on.
Then we put all data in single framework & apply various statistical tools to find out the dynamic on the market.
During the analysis stage, feedback from the stakeholder groups would be compared to determine areas of agreement as well as areas of divergence