

Key Insights
The global Submarine Power Cable market is projected for substantial growth, with an estimated market size of 33761.6 million and a Compound Annual Growth Rate (CAGR) of 5% from the base year 2025. This expansion is driven by the accelerating transition to renewable energy, particularly offshore wind farms, which require extensive submarine power cable interconnections. Growing demand for reliable electricity supply and supportive government initiatives for clean energy infrastructure further fuel market expansion. Technological advancements in high-voltage transmission and deep-sea capabilities are also unlocking new project opportunities and extending subsea power network reach. The market is segmented by voltage type, with High Voltage Direct Current (HVDC) gaining prominence over High Voltage Alternating Current (HVAC) due to its efficiency in long-distance power transmission and reduced energy losses, essential for offshore renewable energy projects.
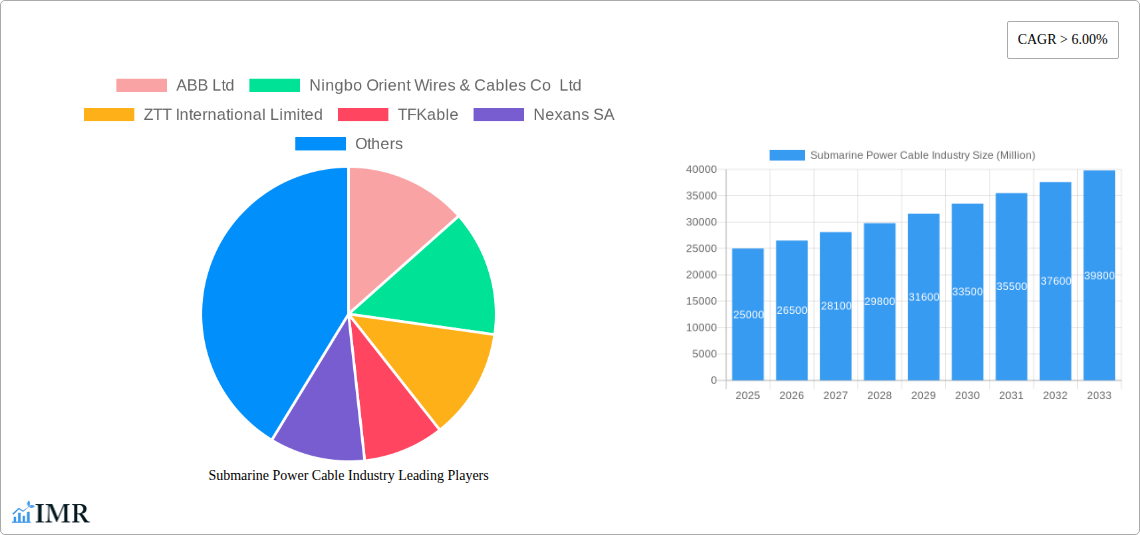
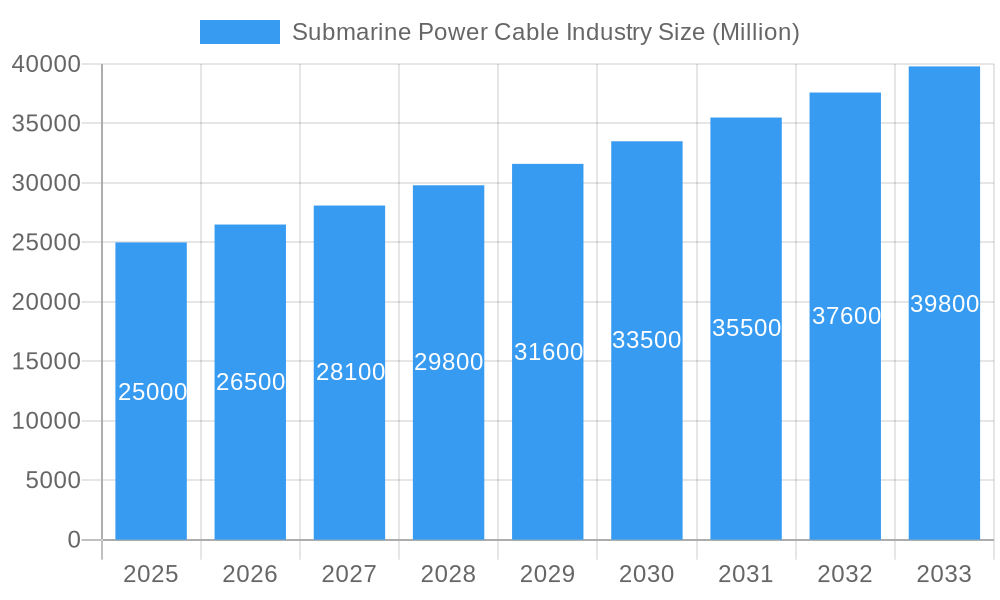
Submarine Power Cable Industry Market Size (In Billion)
Key growth factors include significant investments in offshore wind energy projects globally, expansion and modernization of national power grids to integrate renewables, and the development of interconnector cables for enhanced energy security. Emerging trends like the deployment of higher capacity cables for larger offshore wind turbines and advancements in subsea energy storage solutions will shape the market. Challenges include high capital expenditure, complex project execution, and potential environmental considerations. Despite these hurdles, the global commitment to decarbonization and the increasing need for robust energy infrastructure ensure a promising future for the submarine power cable industry, with leading companies driving innovation and market penetration.
Submarine Power Cable Industry Company Market Share
Submarine Power Cable Industry: Comprehensive Market Analysis and Future Outlook (2019-2033)
This in-depth report provides a holistic view of the global submarine power cable market, meticulously analyzing trends, dynamics, and growth trajectories from 2019 to 2033, with a base year of 2025. Dive deep into market segmentation by Type of Current (HVDC, HVAC), explore the strategic landscape shaped by key players like Prysmian Group, Nexans SA, and LS Cable & System Ltd., and understand the intricate interplay of parent and child market forces. With quantitative insights and actionable intelligence, this report is an indispensable resource for industry professionals seeking to navigate and capitalize on the evolving submarine power cable sector.
Submarine Power Cable Industry Market Dynamics & Structure
The submarine power cable industry exhibits a moderately concentrated market structure, with a few dominant players such as Prysmian Group, Nexans SA, and ABB Ltd. holding significant market share. Technological innovation is a primary driver, particularly in the advancement of High Voltage Direct Current (HVDC) transmission for long-distance, low-loss energy transfer, enabling offshore wind farm connectivity and intercontinental power grids. Regulatory frameworks, driven by government initiatives for renewable energy integration and grid modernization, are instrumental in shaping market access and project approvals. Competitive product substitutes are limited, primarily revolving around alternative transmission methods like overhead lines for shorter distances or existing grid upgrades. End-user demographics are evolving, with an increasing demand from utility companies, renewable energy developers, and offshore oil and gas operators. Mergers & Acquisitions (M&A) trends are indicative of market consolidation and strategic expansion; for instance, the acquisition of specialized installation companies by major cable manufacturers to offer end-to-end solutions.
- Market Concentration: Dominated by a few key global manufacturers, with a significant market share held by the top 3-5 companies.
- Technological Innovation Drivers: Focus on increased voltage levels, enhanced cable durability, and improved installation techniques for deeper waters and harsher environments.
- Regulatory Frameworks: Support for renewable energy targets and grid infrastructure upgrades are crucial.
- Competitive Product Substitutes: Limited for long-distance subsea transmission; focus on efficiency and reliability of submarine cables.
- End-User Demographics: Growing demand from utility-scale offshore wind projects, interconnector projects between countries, and grid reinforcement initiatives.
- M&A Trends: Strategic acquisitions to enhance manufacturing capabilities, expand geographical reach, and secure installation expertise.
Submarine Power Cable Industry Growth Trends & Insights
The global submarine power cable market is poised for robust expansion, driven by the accelerating transition towards renewable energy sources and the increasing need for reliable, high-capacity power transmission infrastructure. Market size is projected to witness significant growth, fueled by the development of massive offshore wind farms requiring substantial investment in subsea power export cables. Adoption rates for HVDC technology, in particular, are escalating due to its inherent efficiency in transmitting power over long distances with minimal energy loss, making it the preferred choice for connecting remote renewable energy generation sites to onshore grids. Technological disruptions are continuously reshaping the industry, with advancements in cable materials, manufacturing processes, and installation methods enhancing performance, durability, and cost-effectiveness. For example, developments in synthetic insulation materials and improved cable armorings are extending the operational lifespan and resilience of submarine power cables against environmental challenges. Consumer behavior shifts, predominantly observed among utility providers and energy developers, are characterized by a greater emphasis on sustainability, grid stability, and the security of energy supply, all of which necessitate the deployment of advanced submarine power cable systems. The market penetration of submarine power cables is expected to deepen as more countries invest in offshore energy development and cross-border electricity interconnections. The Compound Annual Growth Rate (CAGR) for the forecast period is projected to be substantial, reflecting the increasing global commitment to decarbonization and energy independence. Investments in subsea grid infrastructure are crucial for integrating intermittent renewable energy sources, thereby ensuring a stable and reliable power supply. The demand for higher voltage and higher capacity cables will continue to surge as renewable energy projects become larger and more geographically dispersed.
Dominant Regions, Countries, or Segments in Submarine Power Cable Industry
The High Voltage Direct Current (HVDC) segment is identified as the dominant force driving market growth within the submarine power cable industry. This dominance stems from its unparalleled efficiency in transmitting large amounts of power over vast distances with significantly lower energy losses compared to High Voltage Alternating Current (HVAC) systems. The increasing scale and geographical spread of offshore renewable energy projects, particularly offshore wind farms, are the primary catalysts for HVDC adoption. These projects often require the transmission of electricity from remote offshore generation sites to onshore substations, a scenario where HVDC technology's inherent advantages are most pronounced. The economic policies of nations worldwide are increasingly aligned with renewable energy targets, providing substantial impetus for investments in offshore wind infrastructure, which in turn fuels the demand for HVDC submarine power cables. Furthermore, the development of interconnector cables, linking national grids across seas and oceans to enhance energy security and facilitate electricity trading, heavily relies on HVDC technology for optimal performance. Countries with extensive coastlines and ambitious renewable energy mandates, such as those in Europe (e.g., United Kingdom, Germany, Denmark) and increasingly in Asia (e.g., China, South Korea), are at the forefront of this growth. The market share within the HVDC segment is further bolstered by technological advancements that have improved the reliability, cost-effectiveness, and capacity of HVDC converter stations and cables. The potential for future growth in this segment remains exceptionally high, driven by ongoing and planned offshore wind developments, the expansion of subsea transmission networks, and the continuous pursuit of grid modernization globally.
- Key Drivers for HVDC Dominance:
- Efficiency for Long Distances: Minimal energy loss over hundreds of kilometers.
- Offshore Wind Farm Connectivity: Essential for transmitting power from large-scale offshore installations.
- Interconnector Projects: Facilitating cross-border electricity trade and grid stability.
- Government Policies & Subsidies: Strong support for renewable energy targets and grid infrastructure upgrades.
- Technological Advancements: Improved converter technology and cable designs enhancing performance and reducing costs.
Submarine Power Cable Industry Product Landscape
The submarine power cable industry's product landscape is characterized by continuous innovation focused on enhancing power transmission efficiency, durability, and environmental resilience. Key product innovations include the development of extra-high voltage (EHV) cables, capable of transmitting greater capacities of electricity, and advanced insulation materials that withstand extreme pressures and temperatures of subsea environments. Applications span a wide spectrum, from connecting offshore wind farms to the grid and enabling intercontinental power transfer to supporting offshore oil and gas platforms and even facilitating subsea data transmission infrastructure. Performance metrics are constantly being pushed, with a focus on reducing losses, increasing bandwidth, and extending service life. Unique selling propositions of leading products revolve around their ability to withstand corrosive seawater, mechanical stresses from seabed movement, and the challenging installation processes. Technological advancements are also geared towards improving the integration of these cables with subsea connectors and protection systems.
Key Drivers, Barriers & Challenges in Submarine Power Cable Industry
Key Drivers:
- Renewable Energy Expansion: The global surge in offshore wind and other marine renewable energy projects is the most significant driver, demanding extensive subsea power transmission infrastructure.
- Grid Modernization and Interconnection: Investments in upgrading aging grids and establishing cross-border electricity interconnections to enhance energy security and efficiency are crucial.
- Technological Advancements: Innovations in HVDC technology, cable materials, and installation techniques are improving performance and reducing costs, making subsea transmission more viable.
- Government Policies and Incentives: Favorable regulatory frameworks, subsidies, and climate change commitments are accelerating project development.
Barriers & Challenges:
- High Capital Costs: The immense investment required for manufacturing, laying, and maintaining submarine power cables is a significant barrier.
- Complex Installation and Maintenance: Subsea cable laying and repair operations are technically challenging, time-consuming, and expensive, requiring specialized vessels and expertise.
- Environmental Concerns and Permitting: Navigating stringent environmental regulations and obtaining permits can lead to project delays and increased costs.
- Supply Chain Volatility: Fluctuations in the availability and cost of raw materials like copper and aluminum, along with the limited number of specialized installation vessels, can pose supply chain risks.
- Geopolitical Risks: International projects can be subject to political instability and trade disputes.
Emerging Opportunities in Submarine Power Cable Industry
Emerging opportunities within the submarine power cable industry are primarily driven by the growing demand for subsea grid interconnections to support distributed renewable energy generation and enhance grid resilience. Untapped markets in regions with significant offshore wind potential, such as parts of Asia and the Americas, present substantial growth avenues. Innovative applications are emerging in the development of subsea energy storage systems and the integration of subsea power cables with emerging subsea communication networks. Evolving consumer preferences, manifested as a strong societal push for decarbonization and energy independence, are creating a favorable environment for further investment in subsea power infrastructure. The development of floating offshore wind farms also presents new opportunities for specialized cable solutions designed for dynamic environments.
Growth Accelerators in the Submarine Power Cable Industry Industry
Long-term growth in the submarine power cable industry will be significantly accelerated by breakthroughs in subsea transmission technology, particularly in increasing the voltage ratings and capacity of cables, thereby enabling more efficient and cost-effective power delivery over longer distances. Strategic partnerships between cable manufacturers, offshore wind developers, and grid operators are crucial for streamlining project execution and de-risking large-scale investments. Market expansion strategies, including entering new geographical regions with burgeoning offshore energy sectors and developing localized manufacturing capabilities, will further fuel growth. The increasing demand for grid stabilization solutions and the integration of smart grid technologies into subsea networks will also act as significant accelerators.
Key Players Shaping the Submarine Power Cable Industry Market
- ABB Ltd
- Ningbo Orient Wires & Cables Co Ltd
- ZTT International Limited
- TFKable
- Nexans SA
- Furukawa Electric Co Ltd
- NKT A/S
- Prysmian Group
- Sumitomo Electric Industries Limited
- KEI Industries Limited
- LS Cable & System Ltd
Notable Milestones in Submarine Power Cable Industry Sector
- November 2022: LS Cable & System Ltd. became the largest shareholder of KT Submarine Co., a company specializing in undersea cable construction. This strategic investment aimed to strengthen LS Cable's position in the submarine cable market and expand its capabilities in undersea cable projects.
In-Depth Submarine Power Cable Industry Market Outlook
The future outlook for the submarine power cable industry is exceptionally promising, underpinned by a confluence of powerful growth accelerators. The persistent global drive towards renewable energy integration, particularly the expansion of offshore wind farms, will continue to be the primary demand generator. Technological breakthroughs in HVDC transmission, pushing voltage limits and enhancing efficiency, will unlock new possibilities for intercontinental power grids and larger, more remote renewable energy projects. Strategic partnerships between key industry players, from manufacturers to installers and end-users, will be vital for overcoming logistical challenges and accelerating project deployment. Market expansion into emerging regions with significant offshore energy potential, coupled with continued investment in grid modernization and interconnection projects worldwide, will solidify the industry's upward trajectory. The increasing focus on energy security and decarbonization policies further solidifies the strategic importance and future market potential of robust subsea power transmission infrastructure.
Submarine Power Cable Industry Segmentation
-
1. Type of Current
- 1.1. HVDC
- 1.2. HVAC
Submarine Power Cable Industry Segmentation By Geography
- 1. North America
- 2. Europe
- 3. Asia Pacific
- 4. South America
- 5. Middle East and Africa
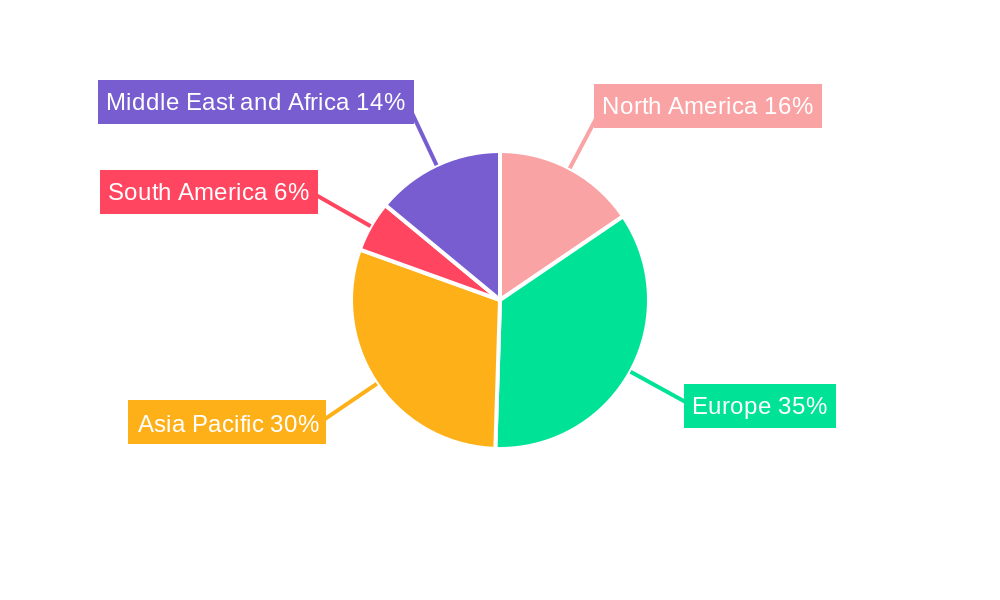
Submarine Power Cable Industry Regional Market Share
Geographic Coverage of Submarine Power Cable Industry
Submarine Power Cable Industry REPORT HIGHLIGHTS
| Aspects | Details |
|---|---|
| Study Period | 2020-2034 |
| Base Year | 2025 |
| Estimated Year | 2026 |
| Forecast Period | 2026-2034 |
| Historical Period | 2020-2025 |
| Growth Rate | CAGR of 5% from 2020-2034 |
| Segmentation |
|
Table of Contents
- 1. Introduction
- 1.1. Research Scope
- 1.2. Market Segmentation
- 1.3. Research Objective
- 1.4. Definitions and Assumptions
- 2. Executive Summary
- 2.1. Market Snapshot
- 3. Market Dynamics
- 3.1. Market Drivers
- 3.2. Market Restrains
- 3.3. Market Trends
- 3.4. Market Opportunities
- 4. Market Factor Analysis
- 4.1. Porters Five Forces
- 4.1.1. Bargaining Power of Suppliers
- 4.1.2. Bargaining Power of Buyers
- 4.1.3. Threat of New Entrants
- 4.1.4. Threat of Substitutes
- 4.1.5. Competitive Rivalry
- 4.2. PESTEL analysis
- 4.3. BCG Analysis
- 4.3.1. Stars (High Growth, High Market Share)
- 4.3.2. Cash Cows (Low Growth, High Market Share)
- 4.3.3. Question Mark (High Growth, Low Market Share)
- 4.3.4. Dogs (Low Growth, Low Market Share)
- 4.4. Ansoff Matrix Analysis
- 4.5. Supply Chain Analysis
- 4.6. Regulatory Landscape
- 4.7. Current Market Potential and Opportunity Assessment (TAM–SAM–SOM Framework)
- 4.8. IMR Analyst Note
- 4.1. Porters Five Forces
- 5. Market Analysis, Insights and Forecast 2021-2033
- 5.1. Market Analysis, Insights and Forecast - by Type of Current
- 5.1.1. HVDC
- 5.1.2. HVAC
- 5.2. Market Analysis, Insights and Forecast - by Region
- 5.2.1. North America
- 5.2.2. Europe
- 5.2.3. Asia Pacific
- 5.2.4. South America
- 5.2.5. Middle East and Africa
- 5.1. Market Analysis, Insights and Forecast - by Type of Current
- 6. Global Submarine Power Cable Industry Analysis, Insights and Forecast, 2021-2033
- 6.1. Market Analysis, Insights and Forecast - by Type of Current
- 6.1.1. HVDC
- 6.1.2. HVAC
- 6.1. Market Analysis, Insights and Forecast - by Type of Current
- 7. North America Submarine Power Cable Industry Analysis, Insights and Forecast, 2020-2032
- 7.1. Market Analysis, Insights and Forecast - by Type of Current
- 7.1.1. HVDC
- 7.1.2. HVAC
- 7.1. Market Analysis, Insights and Forecast - by Type of Current
- 8. Europe Submarine Power Cable Industry Analysis, Insights and Forecast, 2020-2032
- 8.1. Market Analysis, Insights and Forecast - by Type of Current
- 8.1.1. HVDC
- 8.1.2. HVAC
- 8.1. Market Analysis, Insights and Forecast - by Type of Current
- 9. Asia Pacific Submarine Power Cable Industry Analysis, Insights and Forecast, 2020-2032
- 9.1. Market Analysis, Insights and Forecast - by Type of Current
- 9.1.1. HVDC
- 9.1.2. HVAC
- 9.1. Market Analysis, Insights and Forecast - by Type of Current
- 10. South America Submarine Power Cable Industry Analysis, Insights and Forecast, 2020-2032
- 10.1. Market Analysis, Insights and Forecast - by Type of Current
- 10.1.1. HVDC
- 10.1.2. HVAC
- 10.1. Market Analysis, Insights and Forecast - by Type of Current
- 11. Middle East and Africa Submarine Power Cable Industry Analysis, Insights and Forecast, 2020-2032
- 11.1. Market Analysis, Insights and Forecast - by Type of Current
- 11.1.1. HVDC
- 11.1.2. HVAC
- 11.1. Market Analysis, Insights and Forecast - by Type of Current
- 12. Competitive Analysis
- 12.1. Company Profiles
- 12.1.1 ABB Ltd
- 12.1.1.1. Company Overview
- 12.1.1.2. Products
- 12.1.1.3. Company Financials
- 12.1.1.4. SWOT Analysis
- 12.1.2 Ningbo Orient Wires & Cables Co Ltd
- 12.1.2.1. Company Overview
- 12.1.2.2. Products
- 12.1.2.3. Company Financials
- 12.1.2.4. SWOT Analysis
- 12.1.3 ZTT International Limited
- 12.1.3.1. Company Overview
- 12.1.3.2. Products
- 12.1.3.3. Company Financials
- 12.1.3.4. SWOT Analysis
- 12.1.4 TFKable
- 12.1.4.1. Company Overview
- 12.1.4.2. Products
- 12.1.4.3. Company Financials
- 12.1.4.4. SWOT Analysis
- 12.1.5 Nexans SA
- 12.1.5.1. Company Overview
- 12.1.5.2. Products
- 12.1.5.3. Company Financials
- 12.1.5.4. SWOT Analysis
- 12.1.6 Furukawa Electric Co Ltd
- 12.1.6.1. Company Overview
- 12.1.6.2. Products
- 12.1.6.3. Company Financials
- 12.1.6.4. SWOT Analysis
- 12.1.7 NKT A/S
- 12.1.7.1. Company Overview
- 12.1.7.2. Products
- 12.1.7.3. Company Financials
- 12.1.7.4. SWOT Analysis
- 12.1.8 Prysmian Group
- 12.1.8.1. Company Overview
- 12.1.8.2. Products
- 12.1.8.3. Company Financials
- 12.1.8.4. SWOT Analysis
- 12.1.9 Sumitomo Electric Industries Limited
- 12.1.9.1. Company Overview
- 12.1.9.2. Products
- 12.1.9.3. Company Financials
- 12.1.9.4. SWOT Analysis
- 12.1.10 KEI Industries Limited
- 12.1.10.1. Company Overview
- 12.1.10.2. Products
- 12.1.10.3. Company Financials
- 12.1.10.4. SWOT Analysis
- 12.1.11 LS Cable & System Ltd
- 12.1.11.1. Company Overview
- 12.1.11.2. Products
- 12.1.11.3. Company Financials
- 12.1.11.4. SWOT Analysis
- 12.1.1 ABB Ltd
- 12.2. Market Entropy
- 12.2.1 Company's Key Areas Served
- 12.2.2 Recent Developments
- 12.3. Company Market Share Analysis 2025
- 12.3.1 Top 5 Companies Market Share Analysis
- 12.3.2 Top 3 Companies Market Share Analysis
- 12.4. List of Potential Customers
- 13. Research Methodology
List of Figures
- Figure 1: Global Submarine Power Cable Industry Revenue Breakdown (million, %) by Region 2025 & 2033
- Figure 2: North America Submarine Power Cable Industry Revenue (million), by Type of Current 2025 & 2033
- Figure 3: North America Submarine Power Cable Industry Revenue Share (%), by Type of Current 2025 & 2033
- Figure 4: North America Submarine Power Cable Industry Revenue (million), by Country 2025 & 2033
- Figure 5: North America Submarine Power Cable Industry Revenue Share (%), by Country 2025 & 2033
- Figure 6: Europe Submarine Power Cable Industry Revenue (million), by Type of Current 2025 & 2033
- Figure 7: Europe Submarine Power Cable Industry Revenue Share (%), by Type of Current 2025 & 2033
- Figure 8: Europe Submarine Power Cable Industry Revenue (million), by Country 2025 & 2033
- Figure 9: Europe Submarine Power Cable Industry Revenue Share (%), by Country 2025 & 2033
- Figure 10: Asia Pacific Submarine Power Cable Industry Revenue (million), by Type of Current 2025 & 2033
- Figure 11: Asia Pacific Submarine Power Cable Industry Revenue Share (%), by Type of Current 2025 & 2033
- Figure 12: Asia Pacific Submarine Power Cable Industry Revenue (million), by Country 2025 & 2033
- Figure 13: Asia Pacific Submarine Power Cable Industry Revenue Share (%), by Country 2025 & 2033
- Figure 14: South America Submarine Power Cable Industry Revenue (million), by Type of Current 2025 & 2033
- Figure 15: South America Submarine Power Cable Industry Revenue Share (%), by Type of Current 2025 & 2033
- Figure 16: South America Submarine Power Cable Industry Revenue (million), by Country 2025 & 2033
- Figure 17: South America Submarine Power Cable Industry Revenue Share (%), by Country 2025 & 2033
- Figure 18: Middle East and Africa Submarine Power Cable Industry Revenue (million), by Type of Current 2025 & 2033
- Figure 19: Middle East and Africa Submarine Power Cable Industry Revenue Share (%), by Type of Current 2025 & 2033
- Figure 20: Middle East and Africa Submarine Power Cable Industry Revenue (million), by Country 2025 & 2033
- Figure 21: Middle East and Africa Submarine Power Cable Industry Revenue Share (%), by Country 2025 & 2033
List of Tables
- Table 1: Global Submarine Power Cable Industry Revenue million Forecast, by Type of Current 2020 & 2033
- Table 2: Global Submarine Power Cable Industry Revenue million Forecast, by Region 2020 & 2033
- Table 3: Global Submarine Power Cable Industry Revenue million Forecast, by Type of Current 2020 & 2033
- Table 4: Global Submarine Power Cable Industry Revenue million Forecast, by Country 2020 & 2033
- Table 5: Global Submarine Power Cable Industry Revenue million Forecast, by Type of Current 2020 & 2033
- Table 6: Global Submarine Power Cable Industry Revenue million Forecast, by Country 2020 & 2033
- Table 7: Global Submarine Power Cable Industry Revenue million Forecast, by Type of Current 2020 & 2033
- Table 8: Global Submarine Power Cable Industry Revenue million Forecast, by Country 2020 & 2033
- Table 9: Global Submarine Power Cable Industry Revenue million Forecast, by Type of Current 2020 & 2033
- Table 10: Global Submarine Power Cable Industry Revenue million Forecast, by Country 2020 & 2033
- Table 11: Global Submarine Power Cable Industry Revenue million Forecast, by Type of Current 2020 & 2033
- Table 12: Global Submarine Power Cable Industry Revenue million Forecast, by Country 2020 & 2033
Frequently Asked Questions
1. What is the projected Compound Annual Growth Rate (CAGR) of the Submarine Power Cable Industry?
The projected CAGR is approximately 5%.
2. Which companies are prominent players in the Submarine Power Cable Industry?
Key companies in the market include ABB Ltd, Ningbo Orient Wires & Cables Co Ltd, ZTT International Limited, TFKable, Nexans SA, Furukawa Electric Co Ltd, NKT A/S, Prysmian Group, Sumitomo Electric Industries Limited, KEI Industries Limited, LS Cable & System Ltd.
3. What are the main segments of the Submarine Power Cable Industry?
The market segments include Type of Current.
4. Can you provide details about the market size?
The market size is estimated to be USD 33761.6 million as of 2022.
5. What are some drivers contributing to market growth?
HVDC submarine cables are increasingly preferred for long-distance power transmission due to their efficiency and lower energy losses compared to alternating current (AC) systems. The adoption of HVDC technology is a significant driver in the submarine power cable market..
6. What are the notable trends driving market growth?
There is a notable trend towards integrating renewable energy sources. such as offshore wind and solar power. into existing power grids. Submarine power cables play a crucial role in this integration by connecting remote renewable energy sites to onshore grids.
7. Are there any restraints impacting market growth?
The deployment and maintenance of submarine power cables involve substantial financial investments. The complex installation procedures. specialized equipment requirements. and the need for expert personnel contribute to these high costs..
8. Can you provide examples of recent developments in the market?
In November 2022, South Korea's leading cable manufacturer, LS Cable & System Ltd., became the largest shareholder of KT Submarine Co., a company specializing in undersea cable construction. This strategic investment aimed to strengthen LS Cable's position in the submarine cable market and expand its capabilities in undersea cable projects.
9. What pricing options are available for accessing the report?
Pricing options include single-user, multi-user, and enterprise licenses priced at USD 4750, USD 5250, and USD 8750 respectively.
10. Is the market size provided in terms of value or volume?
The market size is provided in terms of value, measured in million.
11. Are there any specific market keywords associated with the report?
Yes, the market keyword associated with the report is "Submarine Power Cable Industry," which aids in identifying and referencing the specific market segment covered.
12. How do I determine which pricing option suits my needs best?
The pricing options vary based on user requirements and access needs. Individual users may opt for single-user licenses, while businesses requiring broader access may choose multi-user or enterprise licenses for cost-effective access to the report.
13. Are there any additional resources or data provided in the Submarine Power Cable Industry report?
While the report offers comprehensive insights, it's advisable to review the specific contents or supplementary materials provided to ascertain if additional resources or data are available.
14. How can I stay updated on further developments or reports in the Submarine Power Cable Industry?
To stay informed about further developments, trends, and reports in the Submarine Power Cable Industry, consider subscribing to industry newsletters, following relevant companies and organizations, or regularly checking reputable industry news sources and publications.
Methodology
Step 1 - Identification of Relevant Samples Size from Population Database


Step 2 - Approaches for Defining Global Market Size (Value, Volume* & Price*)

Note*: In applicable scenarios
Step 3 - Data Sources
Primary Research
- Web Analytics
- Survey Reports
- Research Institute
- Latest Research Reports
- Opinion Leaders
Secondary Research
- Annual Reports
- White Paper
- Latest Press Release
- Industry Association
- Paid Database
- Investor Presentations

Step 4 - Data Triangulation
Involves using different sources of information in order to increase the validity of a study
These sources are likely to be stakeholders in a program - participants, other researchers, program staff, other community members, and so on.
Then we put all data in single framework & apply various statistical tools to find out the dynamic on the market.
During the analysis stage, feedback from the stakeholder groups would be compared to determine areas of agreement as well as areas of divergence