

Key Insights
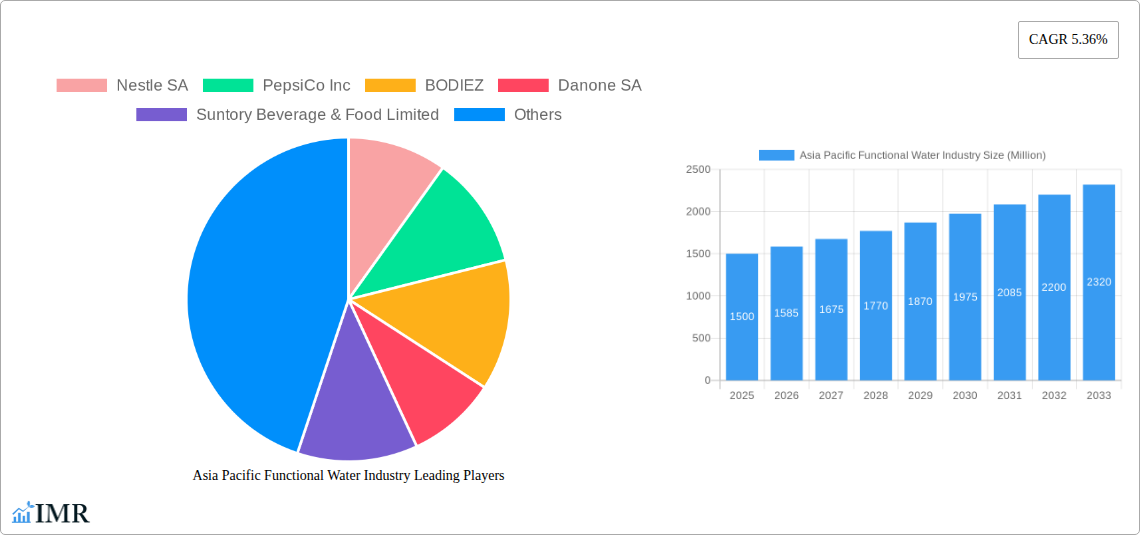
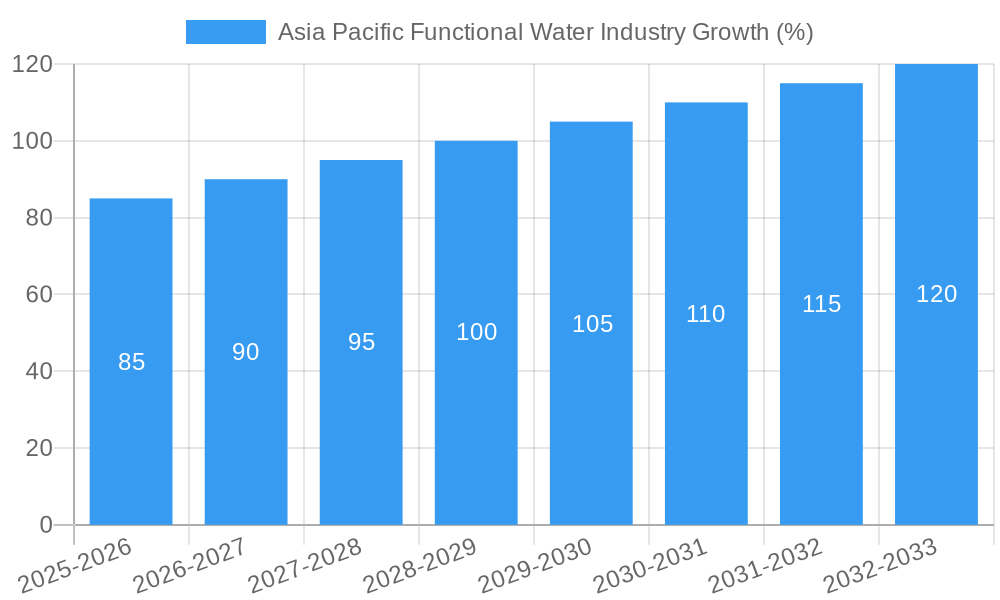
The Asia-Pacific functional water market, valued at approximately $XX million in 2025, is projected to experience robust growth, exhibiting a Compound Annual Growth Rate (CAGR) of 5.36% from 2025 to 2033. This expansion is fueled by several key drivers. Increasing health consciousness among consumers in the region is a significant factor, with a growing preference for healthier hydration alternatives compared to sugary drinks. The rising prevalence of lifestyle diseases and a greater emphasis on preventative healthcare further bolster demand. Moreover, innovative product launches, featuring unique flavors and enhanced functional benefits like added vitamins and electrolytes, are capturing consumer attention and driving market penetration. The expansion of e-commerce platforms is also contributing to market growth, providing convenient access to a wider range of functional water options. However, challenges remain. Price sensitivity, particularly in emerging markets, and potential regulatory hurdles related to health claims on product labeling could temper growth. Segmentation reveals strong performance across various distribution channels, with supermarkets/hypermarkets maintaining a significant share, while online stores are witnessing rapid growth reflecting evolving consumer purchasing habits. Plain functional water currently dominates the type segment, yet flavored functional water is experiencing rapid expansion driven by consumer preference for diverse tastes and enhanced experiences. Key players like Nestle SA, PepsiCo Inc., and Coca-Cola Company are actively investing in research and development, brand building, and strategic partnerships to maintain their competitive edge in this dynamic market.
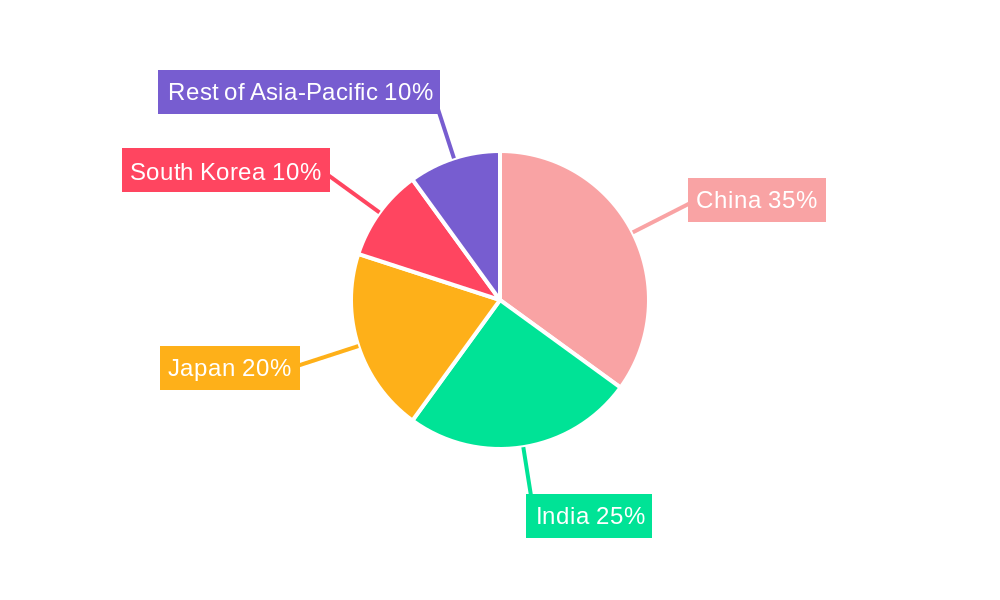
The projected growth in the Asia-Pacific functional water market is expected to be particularly strong in countries like China, India, and Japan, driven by increasing disposable incomes and expanding middle classes. The substantial growth potential is further enhanced by factors such as increasing urbanization, a young and health-conscious population, and government initiatives promoting healthier lifestyles. While the "Rest of Asia-Pacific" segment also presents opportunities, the varying levels of economic development and consumer preferences across this diverse region require tailored marketing strategies. Competitive intensity is expected to rise as both established beverage giants and smaller, specialized brands continue to compete for market share. The success of individual players will depend heavily on their ability to innovate, effectively target consumer segments, and navigate evolving regulatory landscapes. Furthermore, the sustainability of the functional water industry will become increasingly important as consumers become more aware of environmental impact.
Asia Pacific Functional Water Industry Market Report: 2019-2033
This comprehensive report provides an in-depth analysis of the Asia Pacific functional water market, offering invaluable insights for industry professionals, investors, and strategic decision-makers. Covering the period 2019-2033, with a focus on 2025, this report delves into market dynamics, growth trends, key players, and emerging opportunities within this rapidly expanding sector. The report segments the market by distribution channel (Supermarkets/Hypermarkets, Specialty Stores, Online Stores, Other Distribution Channels) and product type (Plain Functional Water, Flavored Functional Water), providing granular data for informed strategic planning.
Asia Pacific Functional Water Industry Market Dynamics & Structure
The Asia Pacific functional water market is characterized by a dynamic interplay of factors influencing its structure and growth trajectory. Market concentration is moderate, with key players like Nestle SA, PepsiCo Inc, and The Coca-Cola Company holding significant shares, but also witnessing increasing competition from regional players like Veda Beverages Private Limited and Malaki. Technological innovation, particularly in enhanced water purification and functional ingredient integration, is a major driver. Stringent regulatory frameworks regarding water safety and labeling influence product development and market entry. The market also faces competition from other hydration options like juices and sports drinks. Consumer demographics are shifting towards health-conscious individuals, boosting demand for functional water. Finally, M&A activity is expected to remain steady, with larger players seeking to expand their portfolios and smaller companies pursuing strategic partnerships for growth.
- Market Concentration: Moderate, with top players holding approximately xx% market share in 2025.
- Technological Innovation: Focus on enhanced filtration, functional ingredient addition (e.g., electrolytes, vitamins).
- Regulatory Framework: Stringent regulations on water purity and labeling create barriers to entry for smaller firms.
- Competitive Substitutes: Juices, sports drinks, and other beverages pose competitive challenges.
- End-User Demographics: Growing health consciousness among millennials and Gen Z drives demand.
- M&A Activity: An estimated xx M&A deals in the forecast period (2025-2033).
Asia Pacific Functional Water Industry Growth Trends & Insights
The Asia Pacific functional water market exhibits robust growth, driven by increasing health awareness, rising disposable incomes, and changing lifestyle preferences. The market size experienced significant expansion during the historical period (2019-2024) with a CAGR of xx%. This upward trend is projected to continue during the forecast period (2025-2033), with a projected CAGR of xx%, reaching a market value of xx Million units by 2033. Technological disruptions, such as the introduction of innovative packaging and enhanced functional ingredients, are accelerating market growth. Consumer behavior is shifting towards premiumization, with a preference for functional waters offering enhanced health benefits. Market penetration remains relatively low in several regions, offering significant growth potential.
Dominant Regions, Countries, or Segments in Asia Pacific Functional Water Industry
China and India are the leading markets in the Asia Pacific functional water industry, driven by large populations, rising disposable incomes, and increasing health consciousness. Within distribution channels, supermarkets/hypermarkets hold the largest market share, followed by specialty stores. Plain functional water accounts for the majority of the market share, while Flavored functional water shows higher growth potential.
- Key Drivers (China & India):
- Rapid economic growth and rising disposable incomes.
- Increasing health awareness and wellness trends.
- Growing urbanization and changing lifestyles.
- Dominant Distribution Channel: Supermarkets/Hypermarkets (xx% market share in 2025) driven by strong retail infrastructure and accessibility.
- Dominant Product Type: Plain Functional Water (xx% market share in 2025) due to affordability and widespread appeal.
- Growth Potential: Flavored Functional Water segment expected to showcase high growth potential due to rising demand for unique taste and functional benefits.
Asia Pacific Functional Water Industry Product Landscape
The Asia Pacific functional water market showcases a diverse range of products, with innovations focusing on enhanced functionality and improved taste profiles. Products incorporate electrolytes, vitamins, and other functional ingredients to cater to specific health needs. Packaging innovations emphasize sustainability and convenience, such as recyclable bottles and on-the-go packaging. These advancements enhance the products’ unique selling propositions, driving consumer preference. Technological developments in water purification and bottling processes contribute to high-quality product offerings.
Key Drivers, Barriers & Challenges in Asia Pacific Functional Water Industry
Key Drivers:
- Growing health consciousness among consumers.
- Rising disposable incomes, particularly in developing economies.
- Expanding retail infrastructure and improved distribution networks.
- Increasing government initiatives promoting healthy lifestyles.
Challenges and Restraints:
- Intense competition from established beverage companies.
- Fluctuations in raw material prices and supply chain disruptions.
- Regulatory hurdles related to labeling and product claims.
- Concerns regarding the sustainability of packaging materials.
Emerging Opportunities in Asia Pacific Functional Water Industry
- Expanding into untapped markets within rural areas.
- Developing functional waters targeting specific health needs (e.g., sports performance, digestive health).
- Introducing innovative packaging formats and sustainable solutions.
- Leveraging online platforms and e-commerce for enhanced distribution.
Growth Accelerators in the Asia Pacific Functional Water Industry Industry
Strategic partnerships between functional water companies and health and wellness brands are accelerating market expansion. Technological breakthroughs in water purification and functional ingredient delivery are enhancing product offerings. Furthermore, expansion into new markets and strategic diversification are key strategies driving long-term growth within this dynamic industry.
Key Players Shaping the Asia Pacific Functional Water Industry Market
- Nestle SA
- PepsiCo Inc
- BODIEZ
- Danone SA
- Suntory Beverage & Food Limited
- Malaki
- The Coca-Cola Company
- Veda Beverages Private Limited
Notable Milestones in Asia Pacific Functional Water Industry Sector
- 2020: Nestle SA launches a new line of functional water with added vitamins in India.
- 2022: PepsiCo Inc acquires a regional functional water brand in China.
- 2023: Suntory Beverage & Food Limited introduces a new sustainable packaging for its functional water products.
- 2024: New regulations on labeling and claims for functional water are implemented in several countries.
In-Depth Asia Pacific Functional Water Industry Market Outlook
The Asia Pacific functional water market is poised for continued growth, driven by health-conscious consumers and innovation. Strategic partnerships, technological advancements, and expansion into new markets will be crucial for success. The market's future potential is significant, with untapped opportunities across various segments and geographies. Companies that invest in product innovation, sustainability, and efficient distribution will be best positioned to capitalize on this expanding market.
Asia Pacific Functional Water Industry Segmentation
-
1. Product Type
- 1.1. Vitamin
- 1.2. Protein
- 1.3. Others
-
2. Distribution Channel
- 2.1. Supermarket/Hypermarket
- 2.2. Specialty Stores
- 2.3. Online Stores
- 2.4. Others
-
3. Geography
- 3.1. China
- 3.2. Japan
- 3.3. Australia
- 3.4. India
- 3.5. Rest of Asia-Pacific
Asia Pacific Functional Water Industry Segmentation By Geography
- 1. China
- 2. Japan
- 3. Australia
- 4. India
- 5. Rest of Asia Pacific
Asia Pacific Functional Water Industry REPORT HIGHLIGHTS
| Aspects | Details |
|---|---|
| Study Period | 2019-2033 |
| Base Year | 2024 |
| Estimated Year | 2025 |
| Forecast Period | 2025-2033 |
| Historical Period | 2019-2024 |
| Growth Rate | CAGR of 5.36% from 2019-2033 |
| Segmentation |
|
Table of Contents
- 1. Introduction
- 1.1. Research Scope
- 1.2. Market Segmentation
- 1.3. Research Methodology
- 1.4. Definitions and Assumptions
- 2. Executive Summary
- 2.1. Introduction
- 3. Market Dynamics
- 3.1. Introduction
- 3.2. Market Drivers
- 3.2.1. Increasing awareness of health and wellness drives demand for functional waters
- 3.3. Market Restrains
- 3.3.1. High Production Costs
- 3.4. Market Trends
- 3.4.1. Growing preference for functional waters with clean labels and natural ingredients
- 4. Market Factor Analysis
- 4.1. Porters Five Forces
- 4.2. Supply/Value Chain
- 4.3. PESTEL analysis
- 4.4. Market Entropy
- 4.5. Patent/Trademark Analysis
- 5. Asia Pacific Functional Water Industry Analysis, Insights and Forecast, 2019-2031
- 5.1. Market Analysis, Insights and Forecast - by Product Type
- 5.1.1. Vitamin
- 5.1.2. Protein
- 5.1.3. Others
- 5.2. Market Analysis, Insights and Forecast - by Distribution Channel
- 5.2.1. Supermarket/Hypermarket
- 5.2.2. Specialty Stores
- 5.2.3. Online Stores
- 5.2.4. Others
- 5.3. Market Analysis, Insights and Forecast - by Geography
- 5.3.1. China
- 5.3.2. Japan
- 5.3.3. Australia
- 5.3.4. India
- 5.3.5. Rest of Asia-Pacific
- 5.4. Market Analysis, Insights and Forecast - by Region
- 5.4.1. China
- 5.4.2. Japan
- 5.4.3. Australia
- 5.4.4. India
- 5.4.5. Rest of Asia Pacific
- 5.1. Market Analysis, Insights and Forecast - by Product Type
- 6. China Asia Pacific Functional Water Industry Analysis, Insights and Forecast, 2019-2031
- 6.1. Market Analysis, Insights and Forecast - by Product Type
- 6.1.1. Vitamin
- 6.1.2. Protein
- 6.1.3. Others
- 6.2. Market Analysis, Insights and Forecast - by Distribution Channel
- 6.2.1. Supermarket/Hypermarket
- 6.2.2. Specialty Stores
- 6.2.3. Online Stores
- 6.2.4. Others
- 6.3. Market Analysis, Insights and Forecast - by Geography
- 6.3.1. China
- 6.3.2. Japan
- 6.3.3. Australia
- 6.3.4. India
- 6.3.5. Rest of Asia-Pacific
- 6.1. Market Analysis, Insights and Forecast - by Product Type
- 7. Japan Asia Pacific Functional Water Industry Analysis, Insights and Forecast, 2019-2031
- 7.1. Market Analysis, Insights and Forecast - by Product Type
- 7.1.1. Vitamin
- 7.1.2. Protein
- 7.1.3. Others
- 7.2. Market Analysis, Insights and Forecast - by Distribution Channel
- 7.2.1. Supermarket/Hypermarket
- 7.2.2. Specialty Stores
- 7.2.3. Online Stores
- 7.2.4. Others
- 7.3. Market Analysis, Insights and Forecast - by Geography
- 7.3.1. China
- 7.3.2. Japan
- 7.3.3. Australia
- 7.3.4. India
- 7.3.5. Rest of Asia-Pacific
- 7.1. Market Analysis, Insights and Forecast - by Product Type
- 8. Australia Asia Pacific Functional Water Industry Analysis, Insights and Forecast, 2019-2031
- 8.1. Market Analysis, Insights and Forecast - by Product Type
- 8.1.1. Vitamin
- 8.1.2. Protein
- 8.1.3. Others
- 8.2. Market Analysis, Insights and Forecast - by Distribution Channel
- 8.2.1. Supermarket/Hypermarket
- 8.2.2. Specialty Stores
- 8.2.3. Online Stores
- 8.2.4. Others
- 8.3. Market Analysis, Insights and Forecast - by Geography
- 8.3.1. China
- 8.3.2. Japan
- 8.3.3. Australia
- 8.3.4. India
- 8.3.5. Rest of Asia-Pacific
- 8.1. Market Analysis, Insights and Forecast - by Product Type
- 9. India Asia Pacific Functional Water Industry Analysis, Insights and Forecast, 2019-2031
- 9.1. Market Analysis, Insights and Forecast - by Product Type
- 9.1.1. Vitamin
- 9.1.2. Protein
- 9.1.3. Others
- 9.2. Market Analysis, Insights and Forecast - by Distribution Channel
- 9.2.1. Supermarket/Hypermarket
- 9.2.2. Specialty Stores
- 9.2.3. Online Stores
- 9.2.4. Others
- 9.3. Market Analysis, Insights and Forecast - by Geography
- 9.3.1. China
- 9.3.2. Japan
- 9.3.3. Australia
- 9.3.4. India
- 9.3.5. Rest of Asia-Pacific
- 9.1. Market Analysis, Insights and Forecast - by Product Type
- 10. Rest of Asia Pacific Asia Pacific Functional Water Industry Analysis, Insights and Forecast, 2019-2031
- 10.1. Market Analysis, Insights and Forecast - by Product Type
- 10.1.1. Vitamin
- 10.1.2. Protein
- 10.1.3. Others
- 10.2. Market Analysis, Insights and Forecast - by Distribution Channel
- 10.2.1. Supermarket/Hypermarket
- 10.2.2. Specialty Stores
- 10.2.3. Online Stores
- 10.2.4. Others
- 10.3. Market Analysis, Insights and Forecast - by Geography
- 10.3.1. China
- 10.3.2. Japan
- 10.3.3. Australia
- 10.3.4. India
- 10.3.5. Rest of Asia-Pacific
- 10.1. Market Analysis, Insights and Forecast - by Product Type
- 11. China Asia Pacific Functional Water Industry Analysis, Insights and Forecast, 2019-2031
- 12. Japan Asia Pacific Functional Water Industry Analysis, Insights and Forecast, 2019-2031
- 13. India Asia Pacific Functional Water Industry Analysis, Insights and Forecast, 2019-2031
- 14. South Korea Asia Pacific Functional Water Industry Analysis, Insights and Forecast, 2019-2031
- 15. Taiwan Asia Pacific Functional Water Industry Analysis, Insights and Forecast, 2019-2031
- 16. Australia Asia Pacific Functional Water Industry Analysis, Insights and Forecast, 2019-2031
- 17. Rest of Asia-Pacific Asia Pacific Functional Water Industry Analysis, Insights and Forecast, 2019-2031
- 18. Competitive Analysis
- 18.1. Market Share Analysis 2024
- 18.2. Company Profiles
- 18.2.1 Nestle SA
- 18.2.1.1. Overview
- 18.2.1.2. Products
- 18.2.1.3. SWOT Analysis
- 18.2.1.4. Recent Developments
- 18.2.1.5. Financials (Based on Availability)
- 18.2.2 PepsiCo Inc
- 18.2.2.1. Overview
- 18.2.2.2. Products
- 18.2.2.3. SWOT Analysis
- 18.2.2.4. Recent Developments
- 18.2.2.5. Financials (Based on Availability)
- 18.2.3 BODIEZ
- 18.2.3.1. Overview
- 18.2.3.2. Products
- 18.2.3.3. SWOT Analysis
- 18.2.3.4. Recent Developments
- 18.2.3.5. Financials (Based on Availability)
- 18.2.4 Danone SA
- 18.2.4.1. Overview
- 18.2.4.2. Products
- 18.2.4.3. SWOT Analysis
- 18.2.4.4. Recent Developments
- 18.2.4.5. Financials (Based on Availability)
- 18.2.5 Suntory Beverage & Food Limited
- 18.2.5.1. Overview
- 18.2.5.2. Products
- 18.2.5.3. SWOT Analysis
- 18.2.5.4. Recent Developments
- 18.2.5.5. Financials (Based on Availability)
- 18.2.6 Malaki
- 18.2.6.1. Overview
- 18.2.6.2. Products
- 18.2.6.3. SWOT Analysis
- 18.2.6.4. Recent Developments
- 18.2.6.5. Financials (Based on Availability)
- 18.2.7 The Coca-Cola Company
- 18.2.7.1. Overview
- 18.2.7.2. Products
- 18.2.7.3. SWOT Analysis
- 18.2.7.4. Recent Developments
- 18.2.7.5. Financials (Based on Availability)
- 18.2.8 Veda Beverages Private Limited
- 18.2.8.1. Overview
- 18.2.8.2. Products
- 18.2.8.3. SWOT Analysis
- 18.2.8.4. Recent Developments
- 18.2.8.5. Financials (Based on Availability)
- 18.2.1 Nestle SA
List of Figures
- Figure 1: Asia Pacific Functional Water Industry Revenue Breakdown (Million, %) by Product 2024 & 2032
- Figure 2: Asia Pacific Functional Water Industry Share (%) by Company 2024
List of Tables
- Table 1: Asia Pacific Functional Water Industry Revenue Million Forecast, by Region 2019 & 2032
- Table 2: Asia Pacific Functional Water Industry Volume K Litres Forecast, by Region 2019 & 2032
- Table 3: Asia Pacific Functional Water Industry Revenue Million Forecast, by Product Type 2019 & 2032
- Table 4: Asia Pacific Functional Water Industry Volume K Litres Forecast, by Product Type 2019 & 2032
- Table 5: Asia Pacific Functional Water Industry Revenue Million Forecast, by Distribution Channel 2019 & 2032
- Table 6: Asia Pacific Functional Water Industry Volume K Litres Forecast, by Distribution Channel 2019 & 2032
- Table 7: Asia Pacific Functional Water Industry Revenue Million Forecast, by Geography 2019 & 2032
- Table 8: Asia Pacific Functional Water Industry Volume K Litres Forecast, by Geography 2019 & 2032
- Table 9: Asia Pacific Functional Water Industry Revenue Million Forecast, by Region 2019 & 2032
- Table 10: Asia Pacific Functional Water Industry Volume K Litres Forecast, by Region 2019 & 2032
- Table 11: Asia Pacific Functional Water Industry Revenue Million Forecast, by Country 2019 & 2032
- Table 12: Asia Pacific Functional Water Industry Volume K Litres Forecast, by Country 2019 & 2032
- Table 13: China Asia Pacific Functional Water Industry Revenue (Million) Forecast, by Application 2019 & 2032
- Table 14: China Asia Pacific Functional Water Industry Volume (K Litres) Forecast, by Application 2019 & 2032
- Table 15: Japan Asia Pacific Functional Water Industry Revenue (Million) Forecast, by Application 2019 & 2032
- Table 16: Japan Asia Pacific Functional Water Industry Volume (K Litres) Forecast, by Application 2019 & 2032
- Table 17: India Asia Pacific Functional Water Industry Revenue (Million) Forecast, by Application 2019 & 2032
- Table 18: India Asia Pacific Functional Water Industry Volume (K Litres) Forecast, by Application 2019 & 2032
- Table 19: South Korea Asia Pacific Functional Water Industry Revenue (Million) Forecast, by Application 2019 & 2032
- Table 20: South Korea Asia Pacific Functional Water Industry Volume (K Litres) Forecast, by Application 2019 & 2032
- Table 21: Taiwan Asia Pacific Functional Water Industry Revenue (Million) Forecast, by Application 2019 & 2032
- Table 22: Taiwan Asia Pacific Functional Water Industry Volume (K Litres) Forecast, by Application 2019 & 2032
- Table 23: Australia Asia Pacific Functional Water Industry Revenue (Million) Forecast, by Application 2019 & 2032
- Table 24: Australia Asia Pacific Functional Water Industry Volume (K Litres) Forecast, by Application 2019 & 2032
- Table 25: Rest of Asia-Pacific Asia Pacific Functional Water Industry Revenue (Million) Forecast, by Application 2019 & 2032
- Table 26: Rest of Asia-Pacific Asia Pacific Functional Water Industry Volume (K Litres) Forecast, by Application 2019 & 2032
- Table 27: Asia Pacific Functional Water Industry Revenue Million Forecast, by Product Type 2019 & 2032
- Table 28: Asia Pacific Functional Water Industry Volume K Litres Forecast, by Product Type 2019 & 2032
- Table 29: Asia Pacific Functional Water Industry Revenue Million Forecast, by Distribution Channel 2019 & 2032
- Table 30: Asia Pacific Functional Water Industry Volume K Litres Forecast, by Distribution Channel 2019 & 2032
- Table 31: Asia Pacific Functional Water Industry Revenue Million Forecast, by Geography 2019 & 2032
- Table 32: Asia Pacific Functional Water Industry Volume K Litres Forecast, by Geography 2019 & 2032
- Table 33: Asia Pacific Functional Water Industry Revenue Million Forecast, by Country 2019 & 2032
- Table 34: Asia Pacific Functional Water Industry Volume K Litres Forecast, by Country 2019 & 2032
- Table 35: Asia Pacific Functional Water Industry Revenue Million Forecast, by Product Type 2019 & 2032
- Table 36: Asia Pacific Functional Water Industry Volume K Litres Forecast, by Product Type 2019 & 2032
- Table 37: Asia Pacific Functional Water Industry Revenue Million Forecast, by Distribution Channel 2019 & 2032
- Table 38: Asia Pacific Functional Water Industry Volume K Litres Forecast, by Distribution Channel 2019 & 2032
- Table 39: Asia Pacific Functional Water Industry Revenue Million Forecast, by Geography 2019 & 2032
- Table 40: Asia Pacific Functional Water Industry Volume K Litres Forecast, by Geography 2019 & 2032
- Table 41: Asia Pacific Functional Water Industry Revenue Million Forecast, by Country 2019 & 2032
- Table 42: Asia Pacific Functional Water Industry Volume K Litres Forecast, by Country 2019 & 2032
- Table 43: Asia Pacific Functional Water Industry Revenue Million Forecast, by Product Type 2019 & 2032
- Table 44: Asia Pacific Functional Water Industry Volume K Litres Forecast, by Product Type 2019 & 2032
- Table 45: Asia Pacific Functional Water Industry Revenue Million Forecast, by Distribution Channel 2019 & 2032
- Table 46: Asia Pacific Functional Water Industry Volume K Litres Forecast, by Distribution Channel 2019 & 2032
- Table 47: Asia Pacific Functional Water Industry Revenue Million Forecast, by Geography 2019 & 2032
- Table 48: Asia Pacific Functional Water Industry Volume K Litres Forecast, by Geography 2019 & 2032
- Table 49: Asia Pacific Functional Water Industry Revenue Million Forecast, by Country 2019 & 2032
- Table 50: Asia Pacific Functional Water Industry Volume K Litres Forecast, by Country 2019 & 2032
- Table 51: Asia Pacific Functional Water Industry Revenue Million Forecast, by Product Type 2019 & 2032
- Table 52: Asia Pacific Functional Water Industry Volume K Litres Forecast, by Product Type 2019 & 2032
- Table 53: Asia Pacific Functional Water Industry Revenue Million Forecast, by Distribution Channel 2019 & 2032
- Table 54: Asia Pacific Functional Water Industry Volume K Litres Forecast, by Distribution Channel 2019 & 2032
- Table 55: Asia Pacific Functional Water Industry Revenue Million Forecast, by Geography 2019 & 2032
- Table 56: Asia Pacific Functional Water Industry Volume K Litres Forecast, by Geography 2019 & 2032
- Table 57: Asia Pacific Functional Water Industry Revenue Million Forecast, by Country 2019 & 2032
- Table 58: Asia Pacific Functional Water Industry Volume K Litres Forecast, by Country 2019 & 2032
- Table 59: Asia Pacific Functional Water Industry Revenue Million Forecast, by Product Type 2019 & 2032
- Table 60: Asia Pacific Functional Water Industry Volume K Litres Forecast, by Product Type 2019 & 2032
- Table 61: Asia Pacific Functional Water Industry Revenue Million Forecast, by Distribution Channel 2019 & 2032
- Table 62: Asia Pacific Functional Water Industry Volume K Litres Forecast, by Distribution Channel 2019 & 2032
- Table 63: Asia Pacific Functional Water Industry Revenue Million Forecast, by Geography 2019 & 2032
- Table 64: Asia Pacific Functional Water Industry Volume K Litres Forecast, by Geography 2019 & 2032
- Table 65: Asia Pacific Functional Water Industry Revenue Million Forecast, by Country 2019 & 2032
- Table 66: Asia Pacific Functional Water Industry Volume K Litres Forecast, by Country 2019 & 2032
Frequently Asked Questions
1. What is the projected Compound Annual Growth Rate (CAGR) of the Asia Pacific Functional Water Industry?
The projected CAGR is approximately 5.36%.
2. Which companies are prominent players in the Asia Pacific Functional Water Industry?
Key companies in the market include Nestle SA, PepsiCo Inc, BODIEZ, Danone SA, Suntory Beverage & Food Limited, Malaki, The Coca-Cola Company, Veda Beverages Private Limited.
3. What are the main segments of the Asia Pacific Functional Water Industry?
The market segments include Product Type, Distribution Channel, Geography.
4. Can you provide details about the market size?
The market size is estimated to be USD XX Million as of 2022.
5. What are some drivers contributing to market growth?
Increasing awareness of health and wellness drives demand for functional waters.
6. What are the notable trends driving market growth?
Growing preference for functional waters with clean labels and natural ingredients.
7. Are there any restraints impacting market growth?
High Production Costs.
8. Can you provide examples of recent developments in the market?
N/A
9. What pricing options are available for accessing the report?
Pricing options include single-user, multi-user, and enterprise licenses priced at USD 4750, USD 5250, and USD 8750 respectively.
10. Is the market size provided in terms of value or volume?
The market size is provided in terms of value, measured in Million and volume, measured in K Litres.
11. Are there any specific market keywords associated with the report?
Yes, the market keyword associated with the report is "Asia Pacific Functional Water Industry," which aids in identifying and referencing the specific market segment covered.
12. How do I determine which pricing option suits my needs best?
The pricing options vary based on user requirements and access needs. Individual users may opt for single-user licenses, while businesses requiring broader access may choose multi-user or enterprise licenses for cost-effective access to the report.
13. Are there any additional resources or data provided in the Asia Pacific Functional Water Industry report?
While the report offers comprehensive insights, it's advisable to review the specific contents or supplementary materials provided to ascertain if additional resources or data are available.
14. How can I stay updated on further developments or reports in the Asia Pacific Functional Water Industry?
To stay informed about further developments, trends, and reports in the Asia Pacific Functional Water Industry, consider subscribing to industry newsletters, following relevant companies and organizations, or regularly checking reputable industry news sources and publications.
Methodology
Step 1 - Identification of Relevant Samples Size from Population Database


Step 2 - Approaches for Defining Global Market Size (Value, Volume* & Price*)

Note*: In applicable scenarios
Step 3 - Data Sources
Primary Research
- Web Analytics
- Survey Reports
- Research Institute
- Latest Research Reports
- Opinion Leaders
Secondary Research
- Annual Reports
- White Paper
- Latest Press Release
- Industry Association
- Paid Database
- Investor Presentations

Step 4 - Data Triangulation
Involves using different sources of information in order to increase the validity of a study
These sources are likely to be stakeholders in a program - participants, other researchers, program staff, other community members, and so on.
Then we put all data in single framework & apply various statistical tools to find out the dynamic on the market.
During the analysis stage, feedback from the stakeholder groups would be compared to determine areas of agreement as well as areas of divergence
