

Key Insights
The global Dehydrated Vegetables market is projected for significant growth, estimated at $7.76 billion in the base year 2025, with a Compound Annual Growth Rate (CAGR) of 7.48% through 2033. This expansion is driven by increasing consumer preference for convenient, shelf-stable, and nutritionally rich food products. Key drivers include the rising demand for healthy processed foods and enhanced awareness of dehydrated vegetables' benefits, such as extended shelf life and reduced spoilage. The food manufacturing sector is a primary consumer, utilizing dehydrated vegetables in soups, sauces, ready-to-eat meals, and snacks. Retail channels offer substantial growth through consumer-ready packaging.
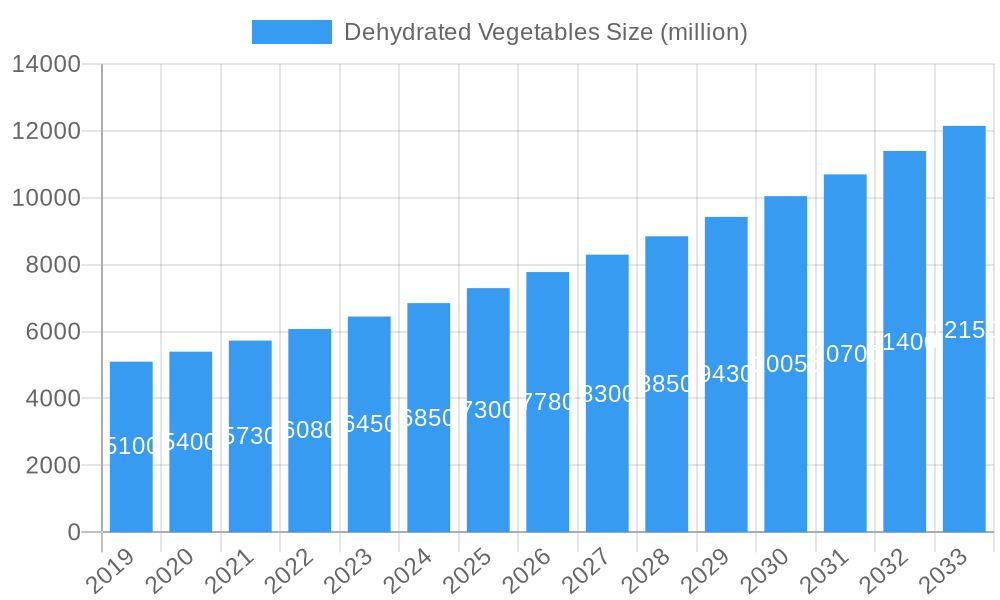
Dehydrated Vegetables Market Size (In Billion)
The market is also influenced by the growing demand for organic and natural food options, reflecting a shift towards sustainable agriculture and cleaner labels. Potential restraints include nutrient degradation during dehydration and raw material price volatility. However, strategic investments in R&D for advanced dehydration techniques and innovative product development are expected to propel market expansion. Emerging economies, particularly in the Asia Pacific, present considerable untapped potential due to burgeoning food processing industries and rising disposable incomes.
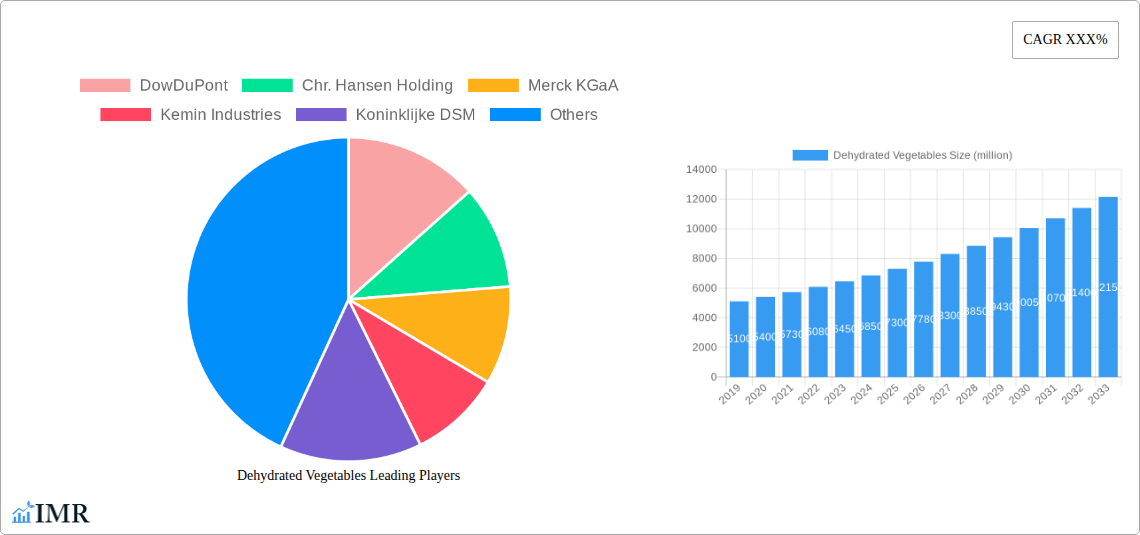
Dehydrated Vegetables Company Market Share
This comprehensive report offers an in-depth analysis of the global dehydrated vegetables market, a vital segment of the food ingredients industry. Spanning from 2019 to 2033, with 2025 as the base year, it provides crucial insights for industry stakeholders. The study meticulously covers market dynamics, growth trends, regional insights, product innovation, key drivers, barriers, emerging opportunities, and the competitive landscape, offering a clear and actionable understanding of the market's present and future trajectory.
Dehydrated Vegetables Market Dynamics & Structure
The global dehydrated vegetables market exhibits a moderately concentrated structure, with a few key players holding significant market shares. Technological innovation, particularly in drying techniques like freeze-drying and spray drying, acts as a primary driver, enhancing product quality, shelf-life, and nutrient retention. Regulatory frameworks, including food safety standards and labeling requirements from bodies such as the FDA and EFSA, are crucial in shaping market access and product development. Competitive product substitutes, including canned and frozen vegetables, exert pressure, but dehydrated alternatives offer unique advantages in terms of weight, storage, and reconstitution. End-user demographics are shifting, with a growing demand from health-conscious consumers and the convenience-seeking food service sector. Mergers and acquisitions (M&A) are active, with larger players acquiring innovative startups to expand their product portfolios and geographical reach. For instance, the M&A volume averaged approximately 8 deals per year during the historical period (2019-2024). Innovation barriers include the high capital investment required for advanced drying technologies and the need for consistent raw material supply chains.
- Market Concentration: Moderate to high, with leading companies dominating specific product categories.
- Technological Innovation Drivers: Advancements in freeze-drying, spray drying, and vacuum drying technologies for enhanced quality and nutrient preservation.
- Regulatory Frameworks: Stringent food safety and labeling regulations influencing product formulation and market entry.
- Competitive Product Substitutes: Canned, frozen, and fresh vegetables, with dehydrated options offering superior shelf-life and reduced transportation costs.
- End-User Demographics: Growing demand from food manufacturers for extended shelf-life ingredients, the food service industry for convenience, and retail for healthy snacking options.
- M&A Trends: Strategic acquisitions to gain market share, acquire proprietary technologies, and diversify product offerings. Estimated M&A deal volume for the forecast period is projected to increase by 15% annually.
Dehydrated Vegetables Growth Trends & Insights
The dehydrated vegetables market is poised for robust expansion, driven by evolving consumer preferences and the increasing integration of dehydrated ingredients across various food applications. The global market size for dehydrated vegetables was approximately $XX billion in 2024 and is projected to reach $YY billion by 2033, demonstrating a Compound Annual Growth Rate (CAGR) of approximately 7.2% during the forecast period (2025-2033). Adoption rates for dehydrated vegetables are steadily increasing, particularly within the processed food manufacturing sector, where they serve as essential ingredients for soups, sauces, seasonings, and ready-to-eat meals. Technological disruptions, such as improved dehydration methods that preserve color, flavor, and nutritional content, are key enablers of this growth. Consumer behavior shifts towards healthier lifestyles and convenience are further fueling demand for products incorporating dehydrated vegetables, especially in the snack and functional food categories. The market penetration of organic dehydrated vegetables is also on an upward trajectory, reflecting a broader trend towards sustainable and natural food choices. Innovative applications, such as dehydrated vegetable powders for smoothies and nutritional supplements, are emerging and contributing significantly to market diversification. The shift from traditional preservation methods to dehydration, driven by its ability to extend shelf life without significant nutrient degradation, is a pivotal trend. The market size evolution shows a consistent upward trend, with specific segments like freeze-dried vegetables experiencing even higher growth rates due to their premium quality. The demand for clean-label products also necessitates the use of dehydrated ingredients as they offer a more natural and less processed alternative to some other preservation methods. The integration of dehydrated vegetables in convenience foods and ready-to-cook meals caters to the fast-paced lifestyles of modern consumers, further solidifying their market presence. The perceived health benefits associated with consuming a variety of vegetables, even in dehydrated form, also play a crucial role in market expansion.
Dominant Regions, Countries, or Segments in Dehydrated Vegetables
The Food Manufacturer segment, within the Application category, is currently the dominant force driving the global dehydrated vegetables market. This segment accounts for an estimated 55% of the total market share in 2025, with substantial growth potential projected through 2033. Key drivers for this dominance include the extensive use of dehydrated vegetables as functional ingredients in a wide array of processed food products. Food manufacturers leverage these ingredients for their extended shelf life, consistent quality, reduced transportation costs, and ability to maintain desirable flavor profiles and textures when rehydrated. Economic policies supporting the food processing industry, coupled with the robust infrastructure for ingredient sourcing and processing, further bolster the demand from this segment. Countries with a strong food processing base, such as the United States, China, India, and Germany, are major contributors to this segment's growth. The Organic type segment, while smaller in current market share (approximately 30% in 2025), is exhibiting the fastest growth rate, driven by increasing consumer demand for natural and sustainably produced food products. This segment's growth potential is significant, projected to outpace conventional dehydrated vegetables. The increasing awareness of health and wellness, coupled with growing concerns about pesticide residues, is propelling consumers towards organic options. This trend is particularly evident in North America and Europe, where stringent regulations and a well-informed consumer base prioritize organic certification. Emerging economies are also witnessing a rise in organic consumption as disposable incomes increase. The infrastructure for organic farming and processing is expanding in these regions, further supporting the growth of organic dehydrated vegetables. The retail segment is also experiencing a notable upward trend, driven by the increasing popularity of dehydrated vegetable snacks, dried fruit and vegetable mixes, and convenience food products. The growing online retail channels further facilitate the accessibility of these products to a wider consumer base.
- Dominant Application Segment: Food Manufacturer
- Market Share (2025): 55%
- Key Drivers: Ingredient functionality, extended shelf life, cost-effectiveness in processed foods, robust food processing infrastructure.
- Geographic Hotspots: North America, Europe, Asia-Pacific.
- High-Growth Segment (Type): Organic
- Market Share (2025): 30%
- Projected CAGR (2025-2033): 8.5%
- Key Drivers: Health consciousness, demand for natural and sustainable products, clean-label trends, increasing disposable incomes.
- Geographic Hotspots: North America, Europe, followed by APAC.
Dehydrated Vegetables Product Landscape
The dehydrated vegetables market is characterized by continuous product innovation, focusing on enhancing nutritional value, flavor profiles, and functional properties. Advanced drying techniques such as freeze-drying and osmotic dehydration are yielding premium products with superior texture and retained vitamins. Applications span across a wide spectrum, from ingredient fortification in ready-to-eat meals and snacks to direct consumption as healthy snacks and components in culinary preparations. Performance metrics like extended shelf-life (often exceeding 1-2 years under optimal conditions), reduced weight and volume for efficient logistics, and rapid reconstitution capabilities are key selling propositions. Unique selling propositions often lie in the preservation of vibrant colors, natural flavors, and essential nutrients, making them attractive alternatives to fresh or less preserved forms. Technological advancements are also enabling the production of dehydrated vegetable powders, catering to the burgeoning functional food and sports nutrition sectors.
Key Drivers, Barriers & Challenges in Dehydrated Vegetables
Key Drivers:
- Increasing Demand for Convenience Foods: Dehydrated vegetables offer extended shelf life and ease of preparation, aligning with the growing consumer preference for convenient meal solutions.
- Health and Wellness Trends: The growing consumer focus on healthy eating and the demand for natural, nutrient-dense ingredients are significantly boosting the market.
- Technological Advancements in Drying: Innovations in freeze-drying, spray drying, and other methods are improving the quality, taste, and nutritional retention of dehydrated vegetables.
- Cost-Effectiveness and Extended Shelf Life: Dehydration significantly reduces transportation costs and storage requirements, offering economic advantages to manufacturers and retailers.
Key Barriers & Challenges:
- Raw Material Availability and Price Volatility: Dependence on agricultural output makes the supply chain susceptible to weather conditions, pests, and market fluctuations, impacting raw material costs.
- Energy Consumption: The dehydration process, particularly freeze-drying, can be energy-intensive, leading to higher operational costs and environmental concerns.
- Consumer Perception and Taste Preferences: Some consumers may perceive dehydrated vegetables as inferior in taste and texture compared to fresh alternatives, requiring continuous efforts in product development and marketing.
- Regulatory Compliance: Adhering to diverse international food safety standards and labeling regulations can be complex and costly for manufacturers.
- Competition from Canned and Frozen Vegetables: These established preservation methods offer significant competition, especially in price-sensitive markets.
Emerging Opportunities in Dehydrated Vegetables
Emerging opportunities in the dehydrated vegetables market lie in the development of innovative product formats and the expansion into untapped markets. The growing demand for plant-based diets and clean-label products presents significant potential for dehydrated vegetables as key ingredients. Applications in functional foods, dietary supplements, and pet food are also experiencing rapid growth. The exploration of novel drying techniques that further enhance nutrient profiles and sensory attributes can unlock new consumer segments. Furthermore, the increasing global focus on food security and sustainable agriculture creates a favorable environment for shelf-stable, low-waste dehydrated vegetable products. Untapped markets in developing economies, with rising disposable incomes and a growing awareness of health and convenience, represent a substantial growth avenue.
Growth Accelerators in the Dehydrated Vegetables Industry
Long-term growth in the dehydrated vegetables industry will be significantly propelled by ongoing technological breakthroughs in drying and processing efficiency, leading to improved quality and reduced production costs. Strategic partnerships between ingredient suppliers and food manufacturers are crucial for co-developing innovative products and expanding market reach. Furthermore, increasing investments in research and development focused on enhancing the nutritional value and functional properties of dehydrated vegetables will cater to evolving consumer demands for health-conscious products. Market expansion strategies targeting emerging economies, coupled with effective consumer education campaigns highlighting the benefits of dehydrated vegetables, will also serve as significant growth accelerators. The development of sustainable sourcing and production practices will further enhance the appeal of dehydrated vegetables.
Key Players Shaping the Dehydrated Vegetables Market
- DowDuPont
- Chr. Hansen Holding
- Merck KGaA
- Kemin Industries
- Koninklijke DSM
- Archer Daniels Midland Company
- Kerry Group
- Naturex SA
- BTSA Biotecnologías Aplicadas
- Galactic
- Handary
- Zhengzhou Bainafo Bioengineering
- Kalsec
- Siveele
- Cayman Chemical Company
- MAYASAN Food Industries
- Wiley Organics (Organic Technologies)
- Chihon Biotechnology
- Dumoco
Notable Milestones in Dehydrated Vegetables Sector
- 2019: Increased investment in freeze-drying technology by major players to enhance product quality.
- 2020: Launch of new organic dehydrated vegetable snack lines in response to rising health consciousness.
- 2021: Expansion of dehydrated vegetable applications into the pet food industry.
- 2022: Acquisition of a smaller dehydration technology firm by a leading ingredient supplier to bolster R&D capabilities.
- 2023: Introduction of novel dehydration techniques focusing on nutrient preservation and energy efficiency.
- 2024: Growing emphasis on sustainable sourcing and traceability in dehydrated vegetable supply chains.
In-Depth Dehydrated Vegetables Market Outlook
The future outlook for the dehydrated vegetables market is exceptionally promising, driven by a confluence of sustained demand for convenient and healthy food options, coupled with continuous innovation in processing technologies. Growth accelerators such as advancements in freeze-drying and osmotic dehydration will continue to elevate product quality and expand application possibilities. Strategic collaborations between ingredient providers and food manufacturers will be instrumental in co-creating novel products that resonate with evolving consumer palates and dietary trends. Investment in research and development to further enhance the nutritional and functional attributes of dehydrated vegetables will solidify their position in the functional food and dietary supplement sectors. Furthermore, aggressive market expansion initiatives targeting burgeoning economies and comprehensive consumer education campaigns will broaden market penetration. The ongoing global emphasis on food security and sustainable food systems will further bolster the demand for shelf-stable, resource-efficient dehydrated vegetable solutions. Strategic opportunities abound for players focusing on organic certification, clean-label products, and innovative applications that cater to niche dietary needs and lifestyle preferences.
Dehydrated Vegetables Segmentation
-
1. Application
- 1.1. Food Manufacturer
- 1.2. Food Service
- 1.3. Retail
-
2. Type
- 2.1. Organic
- 2.2. Conventional
Dehydrated Vegetables Segmentation By Geography
-
1. North America
- 1.1. United States
- 1.2. Canada
- 1.3. Mexico
-
2. South America
- 2.1. Brazil
- 2.2. Argentina
- 2.3. Rest of South America
-
3. Europe
- 3.1. United Kingdom
- 3.2. Germany
- 3.3. France
- 3.4. Italy
- 3.5. Spain
- 3.6. Russia
- 3.7. Benelux
- 3.8. Nordics
- 3.9. Rest of Europe
-
4. Middle East & Africa
- 4.1. Turkey
- 4.2. Israel
- 4.3. GCC
- 4.4. North Africa
- 4.5. South Africa
- 4.6. Rest of Middle East & Africa
-
5. Asia Pacific
- 5.1. China
- 5.2. India
- 5.3. Japan
- 5.4. South Korea
- 5.5. ASEAN
- 5.6. Oceania
- 5.7. Rest of Asia Pacific
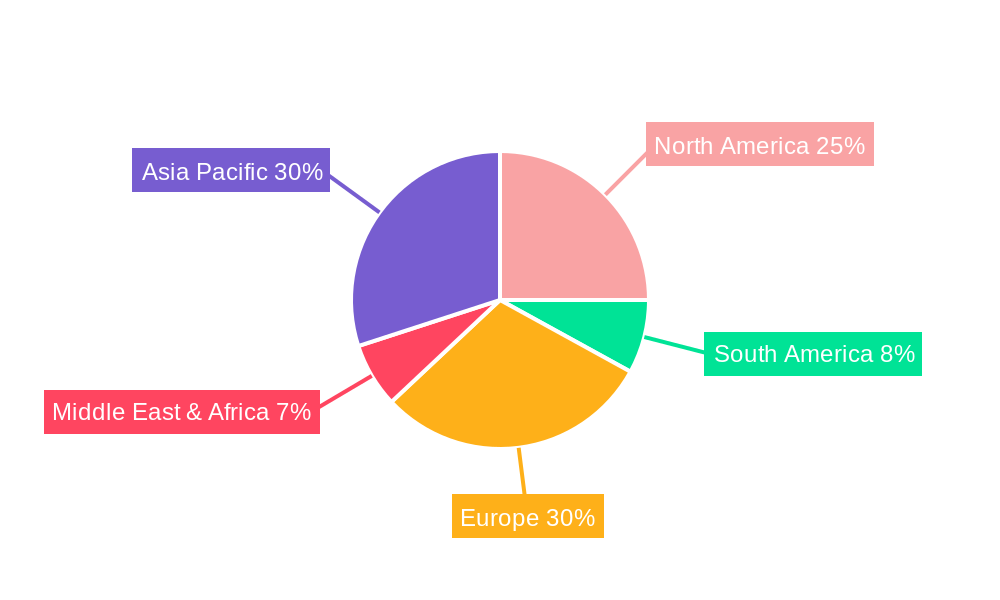
Dehydrated Vegetables Regional Market Share
Geographic Coverage of Dehydrated Vegetables
Dehydrated Vegetables REPORT HIGHLIGHTS
| Aspects | Details |
|---|---|
| Study Period | 2020-2034 |
| Base Year | 2025 |
| Estimated Year | 2026 |
| Forecast Period | 2026-2034 |
| Historical Period | 2020-2025 |
| Growth Rate | CAGR of 7.48% from 2020-2034 |
| Segmentation |
|
Table of Contents
- 1. Introduction
- 1.1. Research Scope
- 1.2. Market Segmentation
- 1.3. Research Methodology
- 1.4. Definitions and Assumptions
- 2. Executive Summary
- 2.1. Introduction
- 3. Market Dynamics
- 3.1. Introduction
- 3.2. Market Drivers
- 3.3. Market Restrains
- 3.4. Market Trends
- 4. Market Factor Analysis
- 4.1. Porters Five Forces
- 4.2. Supply/Value Chain
- 4.3. PESTEL analysis
- 4.4. Market Entropy
- 4.5. Patent/Trademark Analysis
- 5. Global Dehydrated Vegetables Analysis, Insights and Forecast, 2020-2032
- 5.1. Market Analysis, Insights and Forecast - by Application
- 5.1.1. Food Manufacturer
- 5.1.2. Food Service
- 5.1.3. Retail
- 5.2. Market Analysis, Insights and Forecast - by Type
- 5.2.1. Organic
- 5.2.2. Conventional
- 5.3. Market Analysis, Insights and Forecast - by Region
- 5.3.1. North America
- 5.3.2. South America
- 5.3.3. Europe
- 5.3.4. Middle East & Africa
- 5.3.5. Asia Pacific
- 5.1. Market Analysis, Insights and Forecast - by Application
- 6. North America Dehydrated Vegetables Analysis, Insights and Forecast, 2020-2032
- 6.1. Market Analysis, Insights and Forecast - by Application
- 6.1.1. Food Manufacturer
- 6.1.2. Food Service
- 6.1.3. Retail
- 6.2. Market Analysis, Insights and Forecast - by Type
- 6.2.1. Organic
- 6.2.2. Conventional
- 6.1. Market Analysis, Insights and Forecast - by Application
- 7. South America Dehydrated Vegetables Analysis, Insights and Forecast, 2020-2032
- 7.1. Market Analysis, Insights and Forecast - by Application
- 7.1.1. Food Manufacturer
- 7.1.2. Food Service
- 7.1.3. Retail
- 7.2. Market Analysis, Insights and Forecast - by Type
- 7.2.1. Organic
- 7.2.2. Conventional
- 7.1. Market Analysis, Insights and Forecast - by Application
- 8. Europe Dehydrated Vegetables Analysis, Insights and Forecast, 2020-2032
- 8.1. Market Analysis, Insights and Forecast - by Application
- 8.1.1. Food Manufacturer
- 8.1.2. Food Service
- 8.1.3. Retail
- 8.2. Market Analysis, Insights and Forecast - by Type
- 8.2.1. Organic
- 8.2.2. Conventional
- 8.1. Market Analysis, Insights and Forecast - by Application
- 9. Middle East & Africa Dehydrated Vegetables Analysis, Insights and Forecast, 2020-2032
- 9.1. Market Analysis, Insights and Forecast - by Application
- 9.1.1. Food Manufacturer
- 9.1.2. Food Service
- 9.1.3. Retail
- 9.2. Market Analysis, Insights and Forecast - by Type
- 9.2.1. Organic
- 9.2.2. Conventional
- 9.1. Market Analysis, Insights and Forecast - by Application
- 10. Asia Pacific Dehydrated Vegetables Analysis, Insights and Forecast, 2020-2032
- 10.1. Market Analysis, Insights and Forecast - by Application
- 10.1.1. Food Manufacturer
- 10.1.2. Food Service
- 10.1.3. Retail
- 10.2. Market Analysis, Insights and Forecast - by Type
- 10.2.1. Organic
- 10.2.2. Conventional
- 10.1. Market Analysis, Insights and Forecast - by Application
- 11. Competitive Analysis
- 11.1. Global Market Share Analysis 2025
- 11.2. Company Profiles
- 11.2.1 DowDuPont
- 11.2.1.1. Overview
- 11.2.1.2. Products
- 11.2.1.3. SWOT Analysis
- 11.2.1.4. Recent Developments
- 11.2.1.5. Financials (Based on Availability)
- 11.2.2 Chr. Hansen Holding
- 11.2.2.1. Overview
- 11.2.2.2. Products
- 11.2.2.3. SWOT Analysis
- 11.2.2.4. Recent Developments
- 11.2.2.5. Financials (Based on Availability)
- 11.2.3 Merck KGaA
- 11.2.3.1. Overview
- 11.2.3.2. Products
- 11.2.3.3. SWOT Analysis
- 11.2.3.4. Recent Developments
- 11.2.3.5. Financials (Based on Availability)
- 11.2.4 Kemin Industries
- 11.2.4.1. Overview
- 11.2.4.2. Products
- 11.2.4.3. SWOT Analysis
- 11.2.4.4. Recent Developments
- 11.2.4.5. Financials (Based on Availability)
- 11.2.5 Koninklijke DSM
- 11.2.5.1. Overview
- 11.2.5.2. Products
- 11.2.5.3. SWOT Analysis
- 11.2.5.4. Recent Developments
- 11.2.5.5. Financials (Based on Availability)
- 11.2.6 Archer Daniels Midland Company
- 11.2.6.1. Overview
- 11.2.6.2. Products
- 11.2.6.3. SWOT Analysis
- 11.2.6.4. Recent Developments
- 11.2.6.5. Financials (Based on Availability)
- 11.2.7 Kerry Group
- 11.2.7.1. Overview
- 11.2.7.2. Products
- 11.2.7.3. SWOT Analysis
- 11.2.7.4. Recent Developments
- 11.2.7.5. Financials (Based on Availability)
- 11.2.8 Naturex SA
- 11.2.8.1. Overview
- 11.2.8.2. Products
- 11.2.8.3. SWOT Analysis
- 11.2.8.4. Recent Developments
- 11.2.8.5. Financials (Based on Availability)
- 11.2.9 BTSA Biotecnologías Aplicadas
- 11.2.9.1. Overview
- 11.2.9.2. Products
- 11.2.9.3. SWOT Analysis
- 11.2.9.4. Recent Developments
- 11.2.9.5. Financials (Based on Availability)
- 11.2.10 Galactic
- 11.2.10.1. Overview
- 11.2.10.2. Products
- 11.2.10.3. SWOT Analysis
- 11.2.10.4. Recent Developments
- 11.2.10.5. Financials (Based on Availability)
- 11.2.11 Handary
- 11.2.11.1. Overview
- 11.2.11.2. Products
- 11.2.11.3. SWOT Analysis
- 11.2.11.4. Recent Developments
- 11.2.11.5. Financials (Based on Availability)
- 11.2.12 Zhengzhou Bainafo Bioengineering
- 11.2.12.1. Overview
- 11.2.12.2. Products
- 11.2.12.3. SWOT Analysis
- 11.2.12.4. Recent Developments
- 11.2.12.5. Financials (Based on Availability)
- 11.2.13 Kalsec
- 11.2.13.1. Overview
- 11.2.13.2. Products
- 11.2.13.3. SWOT Analysis
- 11.2.13.4. Recent Developments
- 11.2.13.5. Financials (Based on Availability)
- 11.2.14 Siveele
- 11.2.14.1. Overview
- 11.2.14.2. Products
- 11.2.14.3. SWOT Analysis
- 11.2.14.4. Recent Developments
- 11.2.14.5. Financials (Based on Availability)
- 11.2.15 Cayman Chemical Company
- 11.2.15.1. Overview
- 11.2.15.2. Products
- 11.2.15.3. SWOT Analysis
- 11.2.15.4. Recent Developments
- 11.2.15.5. Financials (Based on Availability)
- 11.2.16 MAYASAN Food Industries
- 11.2.16.1. Overview
- 11.2.16.2. Products
- 11.2.16.3. SWOT Analysis
- 11.2.16.4. Recent Developments
- 11.2.16.5. Financials (Based on Availability)
- 11.2.17 Wiley Organics. (Organic Technologies)
- 11.2.17.1. Overview
- 11.2.17.2. Products
- 11.2.17.3. SWOT Analysis
- 11.2.17.4. Recent Developments
- 11.2.17.5. Financials (Based on Availability)
- 11.2.18 Chihon Biotechnology
- 11.2.18.1. Overview
- 11.2.18.2. Products
- 11.2.18.3. SWOT Analysis
- 11.2.18.4. Recent Developments
- 11.2.18.5. Financials (Based on Availability)
- 11.2.19 Dumoco
- 11.2.19.1. Overview
- 11.2.19.2. Products
- 11.2.19.3. SWOT Analysis
- 11.2.19.4. Recent Developments
- 11.2.19.5. Financials (Based on Availability)
- 11.2.1 DowDuPont
List of Figures
- Figure 1: Global Dehydrated Vegetables Revenue Breakdown (billion, %) by Region 2025 & 2033
- Figure 2: Global Dehydrated Vegetables Volume Breakdown (K, %) by Region 2025 & 2033
- Figure 3: North America Dehydrated Vegetables Revenue (billion), by Application 2025 & 2033
- Figure 4: North America Dehydrated Vegetables Volume (K), by Application 2025 & 2033
- Figure 5: North America Dehydrated Vegetables Revenue Share (%), by Application 2025 & 2033
- Figure 6: North America Dehydrated Vegetables Volume Share (%), by Application 2025 & 2033
- Figure 7: North America Dehydrated Vegetables Revenue (billion), by Type 2025 & 2033
- Figure 8: North America Dehydrated Vegetables Volume (K), by Type 2025 & 2033
- Figure 9: North America Dehydrated Vegetables Revenue Share (%), by Type 2025 & 2033
- Figure 10: North America Dehydrated Vegetables Volume Share (%), by Type 2025 & 2033
- Figure 11: North America Dehydrated Vegetables Revenue (billion), by Country 2025 & 2033
- Figure 12: North America Dehydrated Vegetables Volume (K), by Country 2025 & 2033
- Figure 13: North America Dehydrated Vegetables Revenue Share (%), by Country 2025 & 2033
- Figure 14: North America Dehydrated Vegetables Volume Share (%), by Country 2025 & 2033
- Figure 15: South America Dehydrated Vegetables Revenue (billion), by Application 2025 & 2033
- Figure 16: South America Dehydrated Vegetables Volume (K), by Application 2025 & 2033
- Figure 17: South America Dehydrated Vegetables Revenue Share (%), by Application 2025 & 2033
- Figure 18: South America Dehydrated Vegetables Volume Share (%), by Application 2025 & 2033
- Figure 19: South America Dehydrated Vegetables Revenue (billion), by Type 2025 & 2033
- Figure 20: South America Dehydrated Vegetables Volume (K), by Type 2025 & 2033
- Figure 21: South America Dehydrated Vegetables Revenue Share (%), by Type 2025 & 2033
- Figure 22: South America Dehydrated Vegetables Volume Share (%), by Type 2025 & 2033
- Figure 23: South America Dehydrated Vegetables Revenue (billion), by Country 2025 & 2033
- Figure 24: South America Dehydrated Vegetables Volume (K), by Country 2025 & 2033
- Figure 25: South America Dehydrated Vegetables Revenue Share (%), by Country 2025 & 2033
- Figure 26: South America Dehydrated Vegetables Volume Share (%), by Country 2025 & 2033
- Figure 27: Europe Dehydrated Vegetables Revenue (billion), by Application 2025 & 2033
- Figure 28: Europe Dehydrated Vegetables Volume (K), by Application 2025 & 2033
- Figure 29: Europe Dehydrated Vegetables Revenue Share (%), by Application 2025 & 2033
- Figure 30: Europe Dehydrated Vegetables Volume Share (%), by Application 2025 & 2033
- Figure 31: Europe Dehydrated Vegetables Revenue (billion), by Type 2025 & 2033
- Figure 32: Europe Dehydrated Vegetables Volume (K), by Type 2025 & 2033
- Figure 33: Europe Dehydrated Vegetables Revenue Share (%), by Type 2025 & 2033
- Figure 34: Europe Dehydrated Vegetables Volume Share (%), by Type 2025 & 2033
- Figure 35: Europe Dehydrated Vegetables Revenue (billion), by Country 2025 & 2033
- Figure 36: Europe Dehydrated Vegetables Volume (K), by Country 2025 & 2033
- Figure 37: Europe Dehydrated Vegetables Revenue Share (%), by Country 2025 & 2033
- Figure 38: Europe Dehydrated Vegetables Volume Share (%), by Country 2025 & 2033
- Figure 39: Middle East & Africa Dehydrated Vegetables Revenue (billion), by Application 2025 & 2033
- Figure 40: Middle East & Africa Dehydrated Vegetables Volume (K), by Application 2025 & 2033
- Figure 41: Middle East & Africa Dehydrated Vegetables Revenue Share (%), by Application 2025 & 2033
- Figure 42: Middle East & Africa Dehydrated Vegetables Volume Share (%), by Application 2025 & 2033
- Figure 43: Middle East & Africa Dehydrated Vegetables Revenue (billion), by Type 2025 & 2033
- Figure 44: Middle East & Africa Dehydrated Vegetables Volume (K), by Type 2025 & 2033
- Figure 45: Middle East & Africa Dehydrated Vegetables Revenue Share (%), by Type 2025 & 2033
- Figure 46: Middle East & Africa Dehydrated Vegetables Volume Share (%), by Type 2025 & 2033
- Figure 47: Middle East & Africa Dehydrated Vegetables Revenue (billion), by Country 2025 & 2033
- Figure 48: Middle East & Africa Dehydrated Vegetables Volume (K), by Country 2025 & 2033
- Figure 49: Middle East & Africa Dehydrated Vegetables Revenue Share (%), by Country 2025 & 2033
- Figure 50: Middle East & Africa Dehydrated Vegetables Volume Share (%), by Country 2025 & 2033
- Figure 51: Asia Pacific Dehydrated Vegetables Revenue (billion), by Application 2025 & 2033
- Figure 52: Asia Pacific Dehydrated Vegetables Volume (K), by Application 2025 & 2033
- Figure 53: Asia Pacific Dehydrated Vegetables Revenue Share (%), by Application 2025 & 2033
- Figure 54: Asia Pacific Dehydrated Vegetables Volume Share (%), by Application 2025 & 2033
- Figure 55: Asia Pacific Dehydrated Vegetables Revenue (billion), by Type 2025 & 2033
- Figure 56: Asia Pacific Dehydrated Vegetables Volume (K), by Type 2025 & 2033
- Figure 57: Asia Pacific Dehydrated Vegetables Revenue Share (%), by Type 2025 & 2033
- Figure 58: Asia Pacific Dehydrated Vegetables Volume Share (%), by Type 2025 & 2033
- Figure 59: Asia Pacific Dehydrated Vegetables Revenue (billion), by Country 2025 & 2033
- Figure 60: Asia Pacific Dehydrated Vegetables Volume (K), by Country 2025 & 2033
- Figure 61: Asia Pacific Dehydrated Vegetables Revenue Share (%), by Country 2025 & 2033
- Figure 62: Asia Pacific Dehydrated Vegetables Volume Share (%), by Country 2025 & 2033
List of Tables
- Table 1: Global Dehydrated Vegetables Revenue billion Forecast, by Application 2020 & 2033
- Table 2: Global Dehydrated Vegetables Volume K Forecast, by Application 2020 & 2033
- Table 3: Global Dehydrated Vegetables Revenue billion Forecast, by Type 2020 & 2033
- Table 4: Global Dehydrated Vegetables Volume K Forecast, by Type 2020 & 2033
- Table 5: Global Dehydrated Vegetables Revenue billion Forecast, by Region 2020 & 2033
- Table 6: Global Dehydrated Vegetables Volume K Forecast, by Region 2020 & 2033
- Table 7: Global Dehydrated Vegetables Revenue billion Forecast, by Application 2020 & 2033
- Table 8: Global Dehydrated Vegetables Volume K Forecast, by Application 2020 & 2033
- Table 9: Global Dehydrated Vegetables Revenue billion Forecast, by Type 2020 & 2033
- Table 10: Global Dehydrated Vegetables Volume K Forecast, by Type 2020 & 2033
- Table 11: Global Dehydrated Vegetables Revenue billion Forecast, by Country 2020 & 2033
- Table 12: Global Dehydrated Vegetables Volume K Forecast, by Country 2020 & 2033
- Table 13: United States Dehydrated Vegetables Revenue (billion) Forecast, by Application 2020 & 2033
- Table 14: United States Dehydrated Vegetables Volume (K) Forecast, by Application 2020 & 2033
- Table 15: Canada Dehydrated Vegetables Revenue (billion) Forecast, by Application 2020 & 2033
- Table 16: Canada Dehydrated Vegetables Volume (K) Forecast, by Application 2020 & 2033
- Table 17: Mexico Dehydrated Vegetables Revenue (billion) Forecast, by Application 2020 & 2033
- Table 18: Mexico Dehydrated Vegetables Volume (K) Forecast, by Application 2020 & 2033
- Table 19: Global Dehydrated Vegetables Revenue billion Forecast, by Application 2020 & 2033
- Table 20: Global Dehydrated Vegetables Volume K Forecast, by Application 2020 & 2033
- Table 21: Global Dehydrated Vegetables Revenue billion Forecast, by Type 2020 & 2033
- Table 22: Global Dehydrated Vegetables Volume K Forecast, by Type 2020 & 2033
- Table 23: Global Dehydrated Vegetables Revenue billion Forecast, by Country 2020 & 2033
- Table 24: Global Dehydrated Vegetables Volume K Forecast, by Country 2020 & 2033
- Table 25: Brazil Dehydrated Vegetables Revenue (billion) Forecast, by Application 2020 & 2033
- Table 26: Brazil Dehydrated Vegetables Volume (K) Forecast, by Application 2020 & 2033
- Table 27: Argentina Dehydrated Vegetables Revenue (billion) Forecast, by Application 2020 & 2033
- Table 28: Argentina Dehydrated Vegetables Volume (K) Forecast, by Application 2020 & 2033
- Table 29: Rest of South America Dehydrated Vegetables Revenue (billion) Forecast, by Application 2020 & 2033
- Table 30: Rest of South America Dehydrated Vegetables Volume (K) Forecast, by Application 2020 & 2033
- Table 31: Global Dehydrated Vegetables Revenue billion Forecast, by Application 2020 & 2033
- Table 32: Global Dehydrated Vegetables Volume K Forecast, by Application 2020 & 2033
- Table 33: Global Dehydrated Vegetables Revenue billion Forecast, by Type 2020 & 2033
- Table 34: Global Dehydrated Vegetables Volume K Forecast, by Type 2020 & 2033
- Table 35: Global Dehydrated Vegetables Revenue billion Forecast, by Country 2020 & 2033
- Table 36: Global Dehydrated Vegetables Volume K Forecast, by Country 2020 & 2033
- Table 37: United Kingdom Dehydrated Vegetables Revenue (billion) Forecast, by Application 2020 & 2033
- Table 38: United Kingdom Dehydrated Vegetables Volume (K) Forecast, by Application 2020 & 2033
- Table 39: Germany Dehydrated Vegetables Revenue (billion) Forecast, by Application 2020 & 2033
- Table 40: Germany Dehydrated Vegetables Volume (K) Forecast, by Application 2020 & 2033
- Table 41: France Dehydrated Vegetables Revenue (billion) Forecast, by Application 2020 & 2033
- Table 42: France Dehydrated Vegetables Volume (K) Forecast, by Application 2020 & 2033
- Table 43: Italy Dehydrated Vegetables Revenue (billion) Forecast, by Application 2020 & 2033
- Table 44: Italy Dehydrated Vegetables Volume (K) Forecast, by Application 2020 & 2033
- Table 45: Spain Dehydrated Vegetables Revenue (billion) Forecast, by Application 2020 & 2033
- Table 46: Spain Dehydrated Vegetables Volume (K) Forecast, by Application 2020 & 2033
- Table 47: Russia Dehydrated Vegetables Revenue (billion) Forecast, by Application 2020 & 2033
- Table 48: Russia Dehydrated Vegetables Volume (K) Forecast, by Application 2020 & 2033
- Table 49: Benelux Dehydrated Vegetables Revenue (billion) Forecast, by Application 2020 & 2033
- Table 50: Benelux Dehydrated Vegetables Volume (K) Forecast, by Application 2020 & 2033
- Table 51: Nordics Dehydrated Vegetables Revenue (billion) Forecast, by Application 2020 & 2033
- Table 52: Nordics Dehydrated Vegetables Volume (K) Forecast, by Application 2020 & 2033
- Table 53: Rest of Europe Dehydrated Vegetables Revenue (billion) Forecast, by Application 2020 & 2033
- Table 54: Rest of Europe Dehydrated Vegetables Volume (K) Forecast, by Application 2020 & 2033
- Table 55: Global Dehydrated Vegetables Revenue billion Forecast, by Application 2020 & 2033
- Table 56: Global Dehydrated Vegetables Volume K Forecast, by Application 2020 & 2033
- Table 57: Global Dehydrated Vegetables Revenue billion Forecast, by Type 2020 & 2033
- Table 58: Global Dehydrated Vegetables Volume K Forecast, by Type 2020 & 2033
- Table 59: Global Dehydrated Vegetables Revenue billion Forecast, by Country 2020 & 2033
- Table 60: Global Dehydrated Vegetables Volume K Forecast, by Country 2020 & 2033
- Table 61: Turkey Dehydrated Vegetables Revenue (billion) Forecast, by Application 2020 & 2033
- Table 62: Turkey Dehydrated Vegetables Volume (K) Forecast, by Application 2020 & 2033
- Table 63: Israel Dehydrated Vegetables Revenue (billion) Forecast, by Application 2020 & 2033
- Table 64: Israel Dehydrated Vegetables Volume (K) Forecast, by Application 2020 & 2033
- Table 65: GCC Dehydrated Vegetables Revenue (billion) Forecast, by Application 2020 & 2033
- Table 66: GCC Dehydrated Vegetables Volume (K) Forecast, by Application 2020 & 2033
- Table 67: North Africa Dehydrated Vegetables Revenue (billion) Forecast, by Application 2020 & 2033
- Table 68: North Africa Dehydrated Vegetables Volume (K) Forecast, by Application 2020 & 2033
- Table 69: South Africa Dehydrated Vegetables Revenue (billion) Forecast, by Application 2020 & 2033
- Table 70: South Africa Dehydrated Vegetables Volume (K) Forecast, by Application 2020 & 2033
- Table 71: Rest of Middle East & Africa Dehydrated Vegetables Revenue (billion) Forecast, by Application 2020 & 2033
- Table 72: Rest of Middle East & Africa Dehydrated Vegetables Volume (K) Forecast, by Application 2020 & 2033
- Table 73: Global Dehydrated Vegetables Revenue billion Forecast, by Application 2020 & 2033
- Table 74: Global Dehydrated Vegetables Volume K Forecast, by Application 2020 & 2033
- Table 75: Global Dehydrated Vegetables Revenue billion Forecast, by Type 2020 & 2033
- Table 76: Global Dehydrated Vegetables Volume K Forecast, by Type 2020 & 2033
- Table 77: Global Dehydrated Vegetables Revenue billion Forecast, by Country 2020 & 2033
- Table 78: Global Dehydrated Vegetables Volume K Forecast, by Country 2020 & 2033
- Table 79: China Dehydrated Vegetables Revenue (billion) Forecast, by Application 2020 & 2033
- Table 80: China Dehydrated Vegetables Volume (K) Forecast, by Application 2020 & 2033
- Table 81: India Dehydrated Vegetables Revenue (billion) Forecast, by Application 2020 & 2033
- Table 82: India Dehydrated Vegetables Volume (K) Forecast, by Application 2020 & 2033
- Table 83: Japan Dehydrated Vegetables Revenue (billion) Forecast, by Application 2020 & 2033
- Table 84: Japan Dehydrated Vegetables Volume (K) Forecast, by Application 2020 & 2033
- Table 85: South Korea Dehydrated Vegetables Revenue (billion) Forecast, by Application 2020 & 2033
- Table 86: South Korea Dehydrated Vegetables Volume (K) Forecast, by Application 2020 & 2033
- Table 87: ASEAN Dehydrated Vegetables Revenue (billion) Forecast, by Application 2020 & 2033
- Table 88: ASEAN Dehydrated Vegetables Volume (K) Forecast, by Application 2020 & 2033
- Table 89: Oceania Dehydrated Vegetables Revenue (billion) Forecast, by Application 2020 & 2033
- Table 90: Oceania Dehydrated Vegetables Volume (K) Forecast, by Application 2020 & 2033
- Table 91: Rest of Asia Pacific Dehydrated Vegetables Revenue (billion) Forecast, by Application 2020 & 2033
- Table 92: Rest of Asia Pacific Dehydrated Vegetables Volume (K) Forecast, by Application 2020 & 2033
Frequently Asked Questions
1. What is the projected Compound Annual Growth Rate (CAGR) of the Dehydrated Vegetables?
The projected CAGR is approximately 7.48%.
2. Which companies are prominent players in the Dehydrated Vegetables?
Key companies in the market include DowDuPont, Chr. Hansen Holding, Merck KGaA, Kemin Industries, Koninklijke DSM, Archer Daniels Midland Company, Kerry Group, Naturex SA, BTSA Biotecnologías Aplicadas, Galactic, Handary, Zhengzhou Bainafo Bioengineering, Kalsec, Siveele, Cayman Chemical Company, MAYASAN Food Industries, Wiley Organics. (Organic Technologies), Chihon Biotechnology, Dumoco.
3. What are the main segments of the Dehydrated Vegetables?
The market segments include Application, Type.
4. Can you provide details about the market size?
The market size is estimated to be USD 7.76 billion as of 2022.
5. What are some drivers contributing to market growth?
N/A
6. What are the notable trends driving market growth?
N/A
7. Are there any restraints impacting market growth?
N/A
8. Can you provide examples of recent developments in the market?
N/A
9. What pricing options are available for accessing the report?
Pricing options include single-user, multi-user, and enterprise licenses priced at USD 3950.00, USD 5925.00, and USD 7900.00 respectively.
10. Is the market size provided in terms of value or volume?
The market size is provided in terms of value, measured in billion and volume, measured in K.
11. Are there any specific market keywords associated with the report?
Yes, the market keyword associated with the report is "Dehydrated Vegetables," which aids in identifying and referencing the specific market segment covered.
12. How do I determine which pricing option suits my needs best?
The pricing options vary based on user requirements and access needs. Individual users may opt for single-user licenses, while businesses requiring broader access may choose multi-user or enterprise licenses for cost-effective access to the report.
13. Are there any additional resources or data provided in the Dehydrated Vegetables report?
While the report offers comprehensive insights, it's advisable to review the specific contents or supplementary materials provided to ascertain if additional resources or data are available.
14. How can I stay updated on further developments or reports in the Dehydrated Vegetables?
To stay informed about further developments, trends, and reports in the Dehydrated Vegetables, consider subscribing to industry newsletters, following relevant companies and organizations, or regularly checking reputable industry news sources and publications.
Methodology
Step 1 - Identification of Relevant Samples Size from Population Database


Step 2 - Approaches for Defining Global Market Size (Value, Volume* & Price*)

Note*: In applicable scenarios
Step 3 - Data Sources
Primary Research
- Web Analytics
- Survey Reports
- Research Institute
- Latest Research Reports
- Opinion Leaders
Secondary Research
- Annual Reports
- White Paper
- Latest Press Release
- Industry Association
- Paid Database
- Investor Presentations

Step 4 - Data Triangulation
Involves using different sources of information in order to increase the validity of a study
These sources are likely to be stakeholders in a program - participants, other researchers, program staff, other community members, and so on.
Then we put all data in single framework & apply various statistical tools to find out the dynamic on the market.
During the analysis stage, feedback from the stakeholder groups would be compared to determine areas of agreement as well as areas of divergence