

Key Insights
The global beverage caps and closures market is poised for significant expansion, projected to reach $13.3 billion by 2025. Driven by escalating demand for packaged beverages, the market is expected to grow at a Compound Annual Growth Rate (CAGR) of 4.6% from 2025 to 2033. Key growth catalysts include the increasing preference for convenient, on-the-go beverage options, a strong emphasis on sustainable and eco-friendly packaging materials such as recyclable and compostable alternatives, and ongoing innovations in closure design for enhanced product protection and consumer experience. The market is segmented by material, with plastic, metal, and other materials forming substantial segments. Plastic closures currently lead due to their cost-effectiveness and versatility, while metal caps provide premium appeal and superior barrier properties for specific beverage types. The drive towards sustainable packaging is fueling a greater demand for closures made from recycled or renewable resources. Geographically, North America and Europe hold considerable market shares, with Asia Pacific anticipated to exhibit the most rapid growth driven by increasing consumption and economic development. The competitive landscape features a mix of large multinational corporations and specialized regional entities. Market expansion will likely be influenced by raw material price volatility, evolving consumer preferences, and regulatory shifts concerning packaging sustainability.
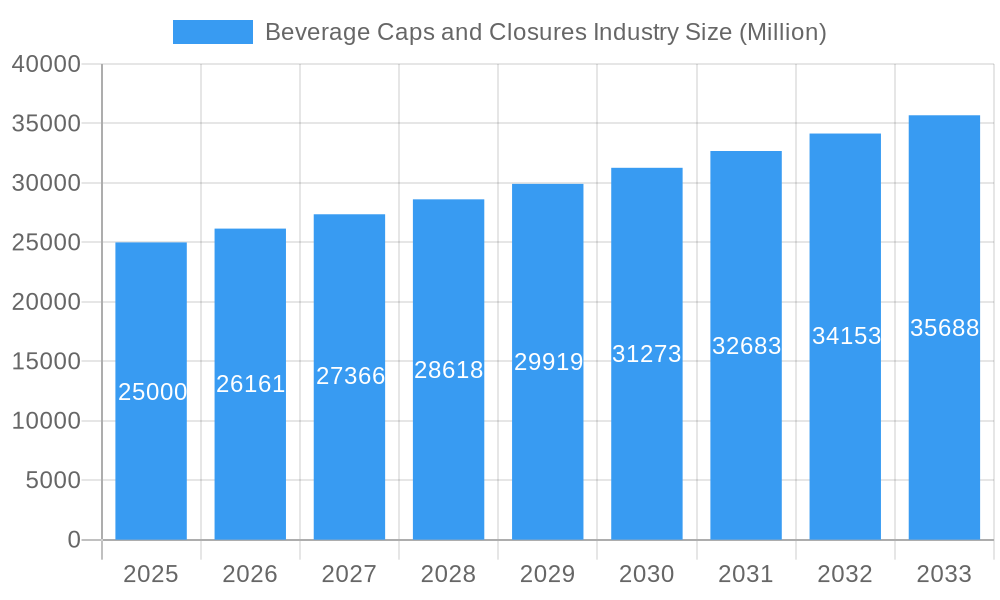
Beverage Caps and Closures Industry Market Size (In Billion)
The forecast period (2025-2033) offers substantial opportunities for industry stakeholders. Strategic investments in research and development for innovative and sustainable closure solutions will be critical for market success. Mergers, acquisitions, and strategic partnerships are anticipated to shape the competitive environment, enabling companies to broaden their product portfolios and market presence. Addressing consumer concerns regarding sustainability and product safety is paramount, requiring manufacturers to adopt environmentally responsible practices and transparent labeling to secure consumer trust and market share. Expanding into high-growth regions, particularly in Asia Pacific, will be essential for sustained long-term growth and market leadership. In summary, the beverage caps and closures industry is set for sustained growth, presenting ample opportunities for proactive players who adapt to evolving market trends and consumer demands.
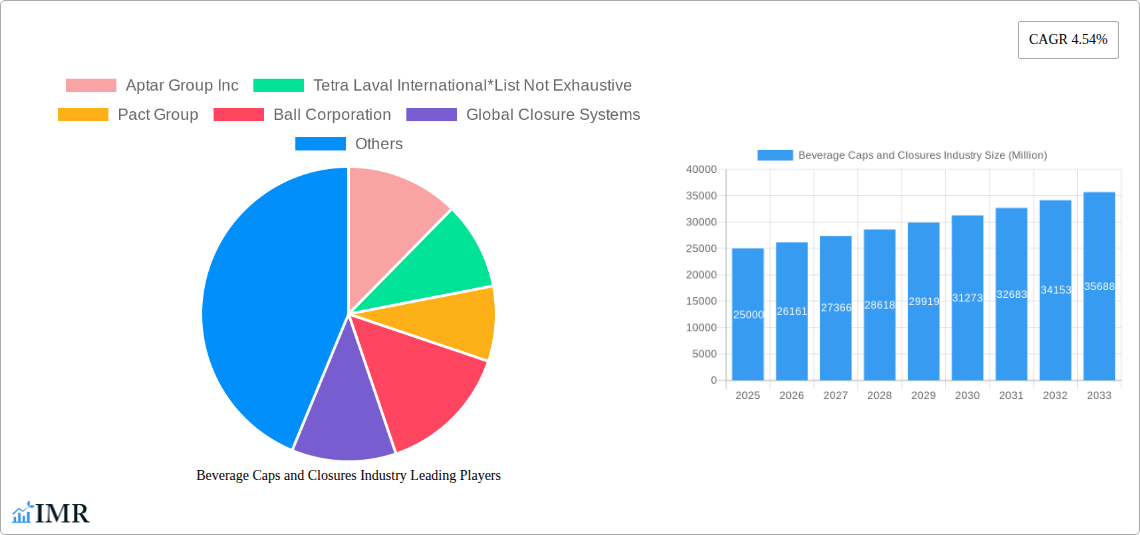
Beverage Caps and Closures Industry Company Market Share
Beverage Caps and Closures Industry Market Report: 2019-2033
This comprehensive report provides an in-depth analysis of the global beverage caps and closures market, encompassing market dynamics, growth trends, regional insights, competitive landscape, and future outlook. The study period covers 2019-2033, with 2025 as the base and estimated year. The forecast period is 2025-2033, and the historical period is 2019-2024. The market size is presented in million units.
Beverage Caps and Closures Industry Market Dynamics & Structure
The beverage caps and closures market is characterized by a moderately concentrated structure, with key players like Aptar Group Inc, Tetra Laval International, Pact Group, Ball Corporation, and others holding significant market share. Technological innovation, particularly in sustainable and tamper-evident closures, is a major driver. Stringent regulatory frameworks concerning material safety and recyclability influence product development and market dynamics. Competitive substitutes, such as screw caps versus crown corks, create diverse market segments. End-user demographics, particularly shifting consumer preferences toward convenience and sustainability, are shaping demand. The market has witnessed several M&A activities in recent years, with xx deals recorded between 2019 and 2024, primarily driven by consolidation and expansion into new markets.
- Market Concentration: Moderately concentrated, with top 5 players holding approximately xx% market share in 2024.
- Technological Innovation: Focus on sustainable materials (e.g., bioplastics), improved sealing technologies, and smart closures.
- Regulatory Landscape: Stringent regulations on material safety and recyclability in regions like Europe and North America.
- Competitive Substitutes: Competition between different closure types (e.g., screw caps, crown corks, flip-tops).
- M&A Activity: xx M&A deals between 2019 and 2024, driven by market consolidation and expansion.
- Innovation Barriers: High R&D costs, stringent regulatory approvals, and consumer acceptance of new technologies.
Beverage Caps and Closures Industry Growth Trends & Insights
The global beverage caps and closures market experienced robust growth between 2019 and 2024, with a CAGR of xx%. This growth is attributed to factors such as the rising demand for packaged beverages, increasing consumer preference for convenient packaging, and technological advancements leading to improved closure designs. The market is expected to continue its growth trajectory, with a projected CAGR of xx% during the forecast period (2025-2033), reaching an estimated xx million units by 2033. Market penetration of sustainable and innovative closures is increasing, driven by heightened environmental consciousness among consumers and stricter regulations. Technological disruptions, such as the adoption of smart closures with embedded sensors, are transforming the industry landscape. Shifts in consumer behavior, with a preference for on-the-go consumption, are bolstering demand for convenient packaging formats.
Dominant Regions, Countries, or Segments in Beverage Caps and Closures Industry
The North American beverage caps and closures market is currently the leading region, driven by high beverage consumption, robust infrastructure, and established manufacturing capabilities. Within this region, the United States holds the largest market share, due to its substantial beverage industry and well-developed packaging sector. The plastic segment dominates the overall market in terms of volume, accounting for approximately xx% of total units, followed by metal at xx% and other materials at xx%. This is primarily due to the cost-effectiveness and versatility of plastic. However, the metal segment is expected to witness considerable growth in the forecast period, driven by its recyclability and suitability for premium beverages.
- Key Drivers in North America: High beverage consumption, strong economy, established infrastructure, and supportive government policies.
- Plastic Segment Dominance: Cost-effectiveness, versatility, and ease of manufacturing.
- Metal Segment Growth Potential: Increasing demand for recyclable and premium closures.
- Other Materials (Rubber, Cork): Niche applications in specialty beverage segments.
Beverage Caps and Closures Industry Product Landscape
The beverage caps and closures market offers a wide range of products, from basic screw caps to sophisticated tamper-evident and resealable closures. Significant innovation focuses on sustainability, using recycled and bio-based materials. Performance metrics prioritize leak-proof seals, ease of opening, and tamper evidence. Unique selling propositions include improved convenience features, enhanced sustainability credentials, and advanced security features against counterfeiting. Technological advancements involve integration of smart technologies, enabling traceability and brand protection.
Key Drivers, Barriers & Challenges in Beverage Caps and Closures Industry
Key Drivers: Growing demand for packaged beverages, increasing consumer preference for convenience and sustainability, technological advancements in closure design and materials, and supportive government regulations promoting recyclable packaging.
Challenges: Fluctuations in raw material prices, stringent regulatory requirements concerning material safety and recyclability, intense competition among industry players, and supply chain disruptions impacting production and delivery. These challenges have led to approximately xx% increase in production costs in the past two years.
Emerging Opportunities in Beverage Caps and Closures Industry
Emerging opportunities lie in the growing demand for sustainable and eco-friendly closures, increasing adoption of smart closures with integrated sensors, expansion into untapped markets in developing economies, and the development of innovative closures for specialized beverage types, such as functional drinks and craft beers.
Growth Accelerators in the Beverage Caps and Closures Industry Industry
Technological breakthroughs in sustainable materials and smart closure technologies, strategic partnerships between closure manufacturers and beverage companies to develop innovative solutions, and market expansion into emerging economies are key accelerators driving long-term growth in the industry.
Key Players Shaping the Beverage Caps and Closures Industry Market
- Aptar Group Inc
- Tetra Laval International
- Pact Group
- Ball Corporation
- Global Closure Systems
- Bericap GmbH & Co KG
- Guala Closures Group
- Crown Holdings Inc
- Albea Group
- Evergreen Packaging Inc
- Berry Global Inc
- Silgan Holdings Inc
- Amcor Ltd
Notable Milestones in Beverage Caps and Closures Industry Sector
- 2021: Launch of a new bio-based closure by Berry Global Inc.
- 2022: Acquisition of a smaller closure manufacturer by Amcor Ltd.
- 2023: Introduction of a tamper-evident closure with integrated sensor technology by Aptar Group Inc.
- 2024: Increased focus on recyclability and sustainable materials across the industry.
In-Depth Beverage Caps and Closures Industry Market Outlook
The beverage caps and closures market is poised for continued growth, driven by a confluence of factors including increasing beverage consumption, innovation in sustainable packaging, and the adoption of smart closure technologies. Strategic opportunities exist for companies to invest in R&D, forge strategic partnerships, and expand into emerging markets to capitalize on the substantial growth potential within this dynamic industry. The market is expected to see a significant increase in demand for sustainable closures, creating a lucrative opportunity for manufacturers to innovate and capture a larger market share.
Beverage Caps and Closures Industry Segmentation
-
1. Material
- 1.1. Metal
- 1.2. Plastic
- 1.3. Other Materials (Rubber, Cork)
Beverage Caps and Closures Industry Segmentation By Geography
-
1. North America
- 1.1. US
- 1.2. Canada
-
2. Europe
- 2.1. Germany
- 2.2. UK
- 2.3. France
- 2.4. Rest of Europe
-
3. Asia Pacific
- 3.1. China
- 3.2. Japan
- 3.3. India
- 3.4. Rest of Asia Pacific
-
4. Latin America
- 4.1. Brazil
- 4.2. Mexico
- 4.3. Rest of Latin America
-
5. Middle East and Africa
- 5.1. UAE
- 5.2. Saudi Arabia
- 5.3. South Africa
- 5.4. Rest of Middle East
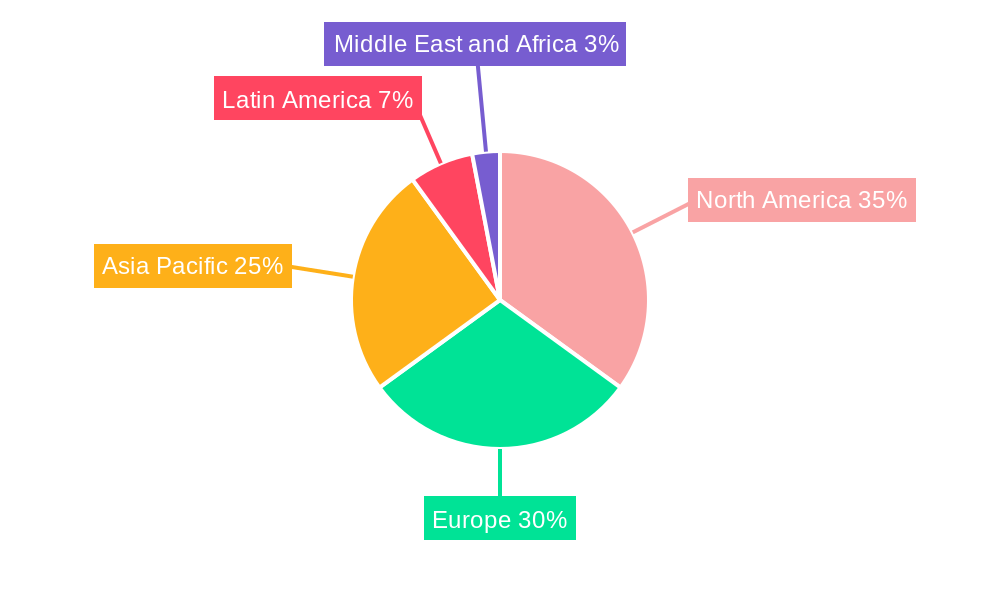
Beverage Caps and Closures Industry Regional Market Share
Geographic Coverage of Beverage Caps and Closures Industry
Beverage Caps and Closures Industry REPORT HIGHLIGHTS
| Aspects | Details |
|---|---|
| Study Period | 2020-2034 |
| Base Year | 2025 |
| Estimated Year | 2026 |
| Forecast Period | 2026-2034 |
| Historical Period | 2020-2025 |
| Growth Rate | CAGR of 4.6% from 2020-2034 |
| Segmentation |
|
Table of Contents
- 1. Introduction
- 1.1. Research Scope
- 1.2. Market Segmentation
- 1.3. Research Objective
- 1.4. Definitions and Assumptions
- 2. Executive Summary
- 2.1. Market Snapshot
- 3. Market Dynamics
- 3.1. Market Drivers
- 3.2. Market Restrains
- 3.3. Market Trends
- 3.4. Market Opportunities
- 4. Market Factor Analysis
- 4.1. Porters Five Forces
- 4.1.1. Bargaining Power of Suppliers
- 4.1.2. Bargaining Power of Buyers
- 4.1.3. Threat of New Entrants
- 4.1.4. Threat of Substitutes
- 4.1.5. Competitive Rivalry
- 4.2. PESTEL analysis
- 4.3. BCG Analysis
- 4.3.1. Stars (High Growth, High Market Share)
- 4.3.2. Cash Cows (Low Growth, High Market Share)
- 4.3.3. Question Mark (High Growth, Low Market Share)
- 4.3.4. Dogs (Low Growth, Low Market Share)
- 4.4. Ansoff Matrix Analysis
- 4.5. Supply Chain Analysis
- 4.6. Regulatory Landscape
- 4.7. Current Market Potential and Opportunity Assessment (TAM–SAM–SOM Framework)
- 4.8. IMR Analyst Note
- 4.1. Porters Five Forces
- 5. Market Analysis, Insights and Forecast 2021-2033
- 5.1. Market Analysis, Insights and Forecast - by Material
- 5.1.1. Metal
- 5.1.2. Plastic
- 5.1.3. Other Materials (Rubber, Cork)
- 5.2. Market Analysis, Insights and Forecast - by Region
- 5.2.1. North America
- 5.2.2. Europe
- 5.2.3. Asia Pacific
- 5.2.4. Latin America
- 5.2.5. Middle East and Africa
- 5.1. Market Analysis, Insights and Forecast - by Material
- 6. Global Beverage Caps and Closures Industry Analysis, Insights and Forecast, 2021-2033
- 6.1. Market Analysis, Insights and Forecast - by Material
- 6.1.1. Metal
- 6.1.2. Plastic
- 6.1.3. Other Materials (Rubber, Cork)
- 6.1. Market Analysis, Insights and Forecast - by Material
- 7. North America Beverage Caps and Closures Industry Analysis, Insights and Forecast, 2020-2032
- 7.1. Market Analysis, Insights and Forecast - by Material
- 7.1.1. Metal
- 7.1.2. Plastic
- 7.1.3. Other Materials (Rubber, Cork)
- 7.1. Market Analysis, Insights and Forecast - by Material
- 8. Europe Beverage Caps and Closures Industry Analysis, Insights and Forecast, 2020-2032
- 8.1. Market Analysis, Insights and Forecast - by Material
- 8.1.1. Metal
- 8.1.2. Plastic
- 8.1.3. Other Materials (Rubber, Cork)
- 8.1. Market Analysis, Insights and Forecast - by Material
- 9. Asia Pacific Beverage Caps and Closures Industry Analysis, Insights and Forecast, 2020-2032
- 9.1. Market Analysis, Insights and Forecast - by Material
- 9.1.1. Metal
- 9.1.2. Plastic
- 9.1.3. Other Materials (Rubber, Cork)
- 9.1. Market Analysis, Insights and Forecast - by Material
- 10. Latin America Beverage Caps and Closures Industry Analysis, Insights and Forecast, 2020-2032
- 10.1. Market Analysis, Insights and Forecast - by Material
- 10.1.1. Metal
- 10.1.2. Plastic
- 10.1.3. Other Materials (Rubber, Cork)
- 10.1. Market Analysis, Insights and Forecast - by Material
- 11. Middle East and Africa Beverage Caps and Closures Industry Analysis, Insights and Forecast, 2020-2032
- 11.1. Market Analysis, Insights and Forecast - by Material
- 11.1.1. Metal
- 11.1.2. Plastic
- 11.1.3. Other Materials (Rubber, Cork)
- 11.1. Market Analysis, Insights and Forecast - by Material
- 12. Competitive Analysis
- 12.1. Company Profiles
- 12.1.1 Aptar Group Inc
- 12.1.1.1. Company Overview
- 12.1.1.2. Products
- 12.1.1.3. Company Financials
- 12.1.1.4. SWOT Analysis
- 12.1.2 Tetra Laval International*List Not Exhaustive
- 12.1.2.1. Company Overview
- 12.1.2.2. Products
- 12.1.2.3. Company Financials
- 12.1.2.4. SWOT Analysis
- 12.1.3 Pact Group
- 12.1.3.1. Company Overview
- 12.1.3.2. Products
- 12.1.3.3. Company Financials
- 12.1.3.4. SWOT Analysis
- 12.1.4 Ball Corporation
- 12.1.4.1. Company Overview
- 12.1.4.2. Products
- 12.1.4.3. Company Financials
- 12.1.4.4. SWOT Analysis
- 12.1.5 Global Closure Systems
- 12.1.5.1. Company Overview
- 12.1.5.2. Products
- 12.1.5.3. Company Financials
- 12.1.5.4. SWOT Analysis
- 12.1.6 Bericap GmbH & Co KG
- 12.1.6.1. Company Overview
- 12.1.6.2. Products
- 12.1.6.3. Company Financials
- 12.1.6.4. SWOT Analysis
- 12.1.7 Guala Closures Group
- 12.1.7.1. Company Overview
- 12.1.7.2. Products
- 12.1.7.3. Company Financials
- 12.1.7.4. SWOT Analysis
- 12.1.8 Crown Holdings Inc
- 12.1.8.1. Company Overview
- 12.1.8.2. Products
- 12.1.8.3. Company Financials
- 12.1.8.4. SWOT Analysis
- 12.1.9 Albea Group
- 12.1.9.1. Company Overview
- 12.1.9.2. Products
- 12.1.9.3. Company Financials
- 12.1.9.4. SWOT Analysis
- 12.1.10 Evergreen Packaging Inc
- 12.1.10.1. Company Overview
- 12.1.10.2. Products
- 12.1.10.3. Company Financials
- 12.1.10.4. SWOT Analysis
- 12.1.11 Berry Global Inc
- 12.1.11.1. Company Overview
- 12.1.11.2. Products
- 12.1.11.3. Company Financials
- 12.1.11.4. SWOT Analysis
- 12.1.12 Silgan Holdings Inc
- 12.1.12.1. Company Overview
- 12.1.12.2. Products
- 12.1.12.3. Company Financials
- 12.1.12.4. SWOT Analysis
- 12.1.13 Amcor Ltd
- 12.1.13.1. Company Overview
- 12.1.13.2. Products
- 12.1.13.3. Company Financials
- 12.1.13.4. SWOT Analysis
- 12.1.1 Aptar Group Inc
- 12.2. Market Entropy
- 12.2.1 Company's Key Areas Served
- 12.2.2 Recent Developments
- 12.3. Company Market Share Analysis 2025
- 12.3.1 Top 5 Companies Market Share Analysis
- 12.3.2 Top 3 Companies Market Share Analysis
- 12.4. List of Potential Customers
- 13. Research Methodology
List of Figures
- Figure 1: Global Beverage Caps and Closures Industry Revenue Breakdown (billion, %) by Region 2025 & 2033
- Figure 2: North America Beverage Caps and Closures Industry Revenue (billion), by Material 2025 & 2033
- Figure 3: North America Beverage Caps and Closures Industry Revenue Share (%), by Material 2025 & 2033
- Figure 4: North America Beverage Caps and Closures Industry Revenue (billion), by Country 2025 & 2033
- Figure 5: North America Beverage Caps and Closures Industry Revenue Share (%), by Country 2025 & 2033
- Figure 6: Europe Beverage Caps and Closures Industry Revenue (billion), by Material 2025 & 2033
- Figure 7: Europe Beverage Caps and Closures Industry Revenue Share (%), by Material 2025 & 2033
- Figure 8: Europe Beverage Caps and Closures Industry Revenue (billion), by Country 2025 & 2033
- Figure 9: Europe Beverage Caps and Closures Industry Revenue Share (%), by Country 2025 & 2033
- Figure 10: Asia Pacific Beverage Caps and Closures Industry Revenue (billion), by Material 2025 & 2033
- Figure 11: Asia Pacific Beverage Caps and Closures Industry Revenue Share (%), by Material 2025 & 2033
- Figure 12: Asia Pacific Beverage Caps and Closures Industry Revenue (billion), by Country 2025 & 2033
- Figure 13: Asia Pacific Beverage Caps and Closures Industry Revenue Share (%), by Country 2025 & 2033
- Figure 14: Latin America Beverage Caps and Closures Industry Revenue (billion), by Material 2025 & 2033
- Figure 15: Latin America Beverage Caps and Closures Industry Revenue Share (%), by Material 2025 & 2033
- Figure 16: Latin America Beverage Caps and Closures Industry Revenue (billion), by Country 2025 & 2033
- Figure 17: Latin America Beverage Caps and Closures Industry Revenue Share (%), by Country 2025 & 2033
- Figure 18: Middle East and Africa Beverage Caps and Closures Industry Revenue (billion), by Material 2025 & 2033
- Figure 19: Middle East and Africa Beverage Caps and Closures Industry Revenue Share (%), by Material 2025 & 2033
- Figure 20: Middle East and Africa Beverage Caps and Closures Industry Revenue (billion), by Country 2025 & 2033
- Figure 21: Middle East and Africa Beverage Caps and Closures Industry Revenue Share (%), by Country 2025 & 2033
List of Tables
- Table 1: Global Beverage Caps and Closures Industry Revenue billion Forecast, by Material 2020 & 2033
- Table 2: Global Beverage Caps and Closures Industry Revenue billion Forecast, by Region 2020 & 2033
- Table 3: Global Beverage Caps and Closures Industry Revenue billion Forecast, by Material 2020 & 2033
- Table 4: Global Beverage Caps and Closures Industry Revenue billion Forecast, by Country 2020 & 2033
- Table 5: US Beverage Caps and Closures Industry Revenue (billion) Forecast, by Application 2020 & 2033
- Table 6: Canada Beverage Caps and Closures Industry Revenue (billion) Forecast, by Application 2020 & 2033
- Table 7: Global Beverage Caps and Closures Industry Revenue billion Forecast, by Material 2020 & 2033
- Table 8: Global Beverage Caps and Closures Industry Revenue billion Forecast, by Country 2020 & 2033
- Table 9: Germany Beverage Caps and Closures Industry Revenue (billion) Forecast, by Application 2020 & 2033
- Table 10: UK Beverage Caps and Closures Industry Revenue (billion) Forecast, by Application 2020 & 2033
- Table 11: France Beverage Caps and Closures Industry Revenue (billion) Forecast, by Application 2020 & 2033
- Table 12: Rest of Europe Beverage Caps and Closures Industry Revenue (billion) Forecast, by Application 2020 & 2033
- Table 13: Global Beverage Caps and Closures Industry Revenue billion Forecast, by Material 2020 & 2033
- Table 14: Global Beverage Caps and Closures Industry Revenue billion Forecast, by Country 2020 & 2033
- Table 15: China Beverage Caps and Closures Industry Revenue (billion) Forecast, by Application 2020 & 2033
- Table 16: Japan Beverage Caps and Closures Industry Revenue (billion) Forecast, by Application 2020 & 2033
- Table 17: India Beverage Caps and Closures Industry Revenue (billion) Forecast, by Application 2020 & 2033
- Table 18: Rest of Asia Pacific Beverage Caps and Closures Industry Revenue (billion) Forecast, by Application 2020 & 2033
- Table 19: Global Beverage Caps and Closures Industry Revenue billion Forecast, by Material 2020 & 2033
- Table 20: Global Beverage Caps and Closures Industry Revenue billion Forecast, by Country 2020 & 2033
- Table 21: Brazil Beverage Caps and Closures Industry Revenue (billion) Forecast, by Application 2020 & 2033
- Table 22: Mexico Beverage Caps and Closures Industry Revenue (billion) Forecast, by Application 2020 & 2033
- Table 23: Rest of Latin America Beverage Caps and Closures Industry Revenue (billion) Forecast, by Application 2020 & 2033
- Table 24: Global Beverage Caps and Closures Industry Revenue billion Forecast, by Material 2020 & 2033
- Table 25: Global Beverage Caps and Closures Industry Revenue billion Forecast, by Country 2020 & 2033
- Table 26: UAE Beverage Caps and Closures Industry Revenue (billion) Forecast, by Application 2020 & 2033
- Table 27: Saudi Arabia Beverage Caps and Closures Industry Revenue (billion) Forecast, by Application 2020 & 2033
- Table 28: South Africa Beverage Caps and Closures Industry Revenue (billion) Forecast, by Application 2020 & 2033
- Table 29: Rest of Middle East Beverage Caps and Closures Industry Revenue (billion) Forecast, by Application 2020 & 2033
Frequently Asked Questions
1. What is the projected Compound Annual Growth Rate (CAGR) of the Beverage Caps and Closures Industry?
The projected CAGR is approximately 4.6%.
2. Which companies are prominent players in the Beverage Caps and Closures Industry?
Key companies in the market include Aptar Group Inc, Tetra Laval International*List Not Exhaustive, Pact Group, Ball Corporation, Global Closure Systems, Bericap GmbH & Co KG, Guala Closures Group, Crown Holdings Inc, Albea Group, Evergreen Packaging Inc, Berry Global Inc, Silgan Holdings Inc, Amcor Ltd.
3. What are the main segments of the Beverage Caps and Closures Industry?
The market segments include Material.
4. Can you provide details about the market size?
The market size is estimated to be USD 13.3 billion as of 2022.
5. What are some drivers contributing to market growth?
; Increasing Beverage Consumption in Developing Economies; Technological Advancements and Innovative Packaging Solutions.
6. What are the notable trends driving market growth?
Plastic is Expected to Experience a Significant Market Share.
7. Are there any restraints impacting market growth?
; Stringent Regulations on the Usage of Plastic Bottles.
8. Can you provide examples of recent developments in the market?
N/A
9. What pricing options are available for accessing the report?
Pricing options include single-user, multi-user, and enterprise licenses priced at USD 4750, USD 5250, and USD 8750 respectively.
10. Is the market size provided in terms of value or volume?
The market size is provided in terms of value, measured in billion.
11. Are there any specific market keywords associated with the report?
Yes, the market keyword associated with the report is "Beverage Caps and Closures Industry," which aids in identifying and referencing the specific market segment covered.
12. How do I determine which pricing option suits my needs best?
The pricing options vary based on user requirements and access needs. Individual users may opt for single-user licenses, while businesses requiring broader access may choose multi-user or enterprise licenses for cost-effective access to the report.
13. Are there any additional resources or data provided in the Beverage Caps and Closures Industry report?
While the report offers comprehensive insights, it's advisable to review the specific contents or supplementary materials provided to ascertain if additional resources or data are available.
14. How can I stay updated on further developments or reports in the Beverage Caps and Closures Industry?
To stay informed about further developments, trends, and reports in the Beverage Caps and Closures Industry, consider subscribing to industry newsletters, following relevant companies and organizations, or regularly checking reputable industry news sources and publications.
Methodology
Step 1 - Identification of Relevant Samples Size from Population Database


Step 2 - Approaches for Defining Global Market Size (Value, Volume* & Price*)

Note*: In applicable scenarios
Step 3 - Data Sources
Primary Research
- Web Analytics
- Survey Reports
- Research Institute
- Latest Research Reports
- Opinion Leaders
Secondary Research
- Annual Reports
- White Paper
- Latest Press Release
- Industry Association
- Paid Database
- Investor Presentations

Step 4 - Data Triangulation
Involves using different sources of information in order to increase the validity of a study
These sources are likely to be stakeholders in a program - participants, other researchers, program staff, other community members, and so on.
Then we put all data in single framework & apply various statistical tools to find out the dynamic on the market.
During the analysis stage, feedback from the stakeholder groups would be compared to determine areas of agreement as well as areas of divergence