

Key Insights
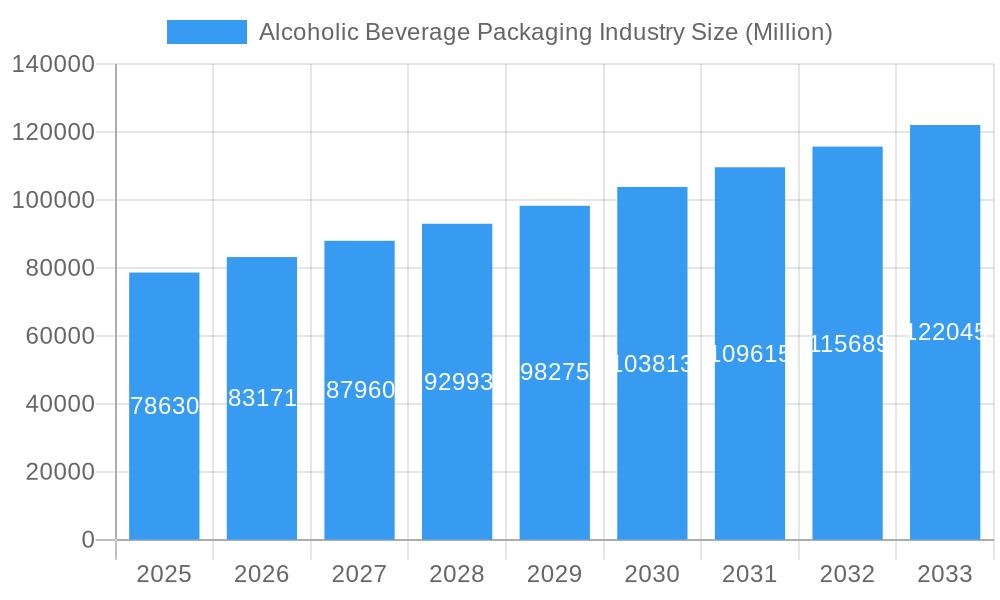
The Alcoholic Beverage Packaging market is poised for significant growth, projected to reach USD 78.63 billion by 2025, expanding at a robust Compound Annual Growth Rate (CAGR) of 5.8% through 2033. This expansion is fueled by a confluence of factors, including evolving consumer preferences for premium and convenient packaging formats, the rising global consumption of alcoholic beverages, and increasing demand for sustainable and innovative packaging solutions. The "premiumization" trend, where consumers are willing to spend more on higher-quality alcoholic drinks, directly translates to a greater demand for sophisticated and appealing packaging that enhances brand perception and product value. Furthermore, the convenience factor, driven by busy lifestyles and the rise of on-the-go consumption, is boosting the demand for single-serve and easily portable packaging options. The industry is also witnessing a strong push towards eco-friendly materials, with a growing emphasis on recyclability and biodegradability, aligning with global sustainability initiatives and consumer consciousness.
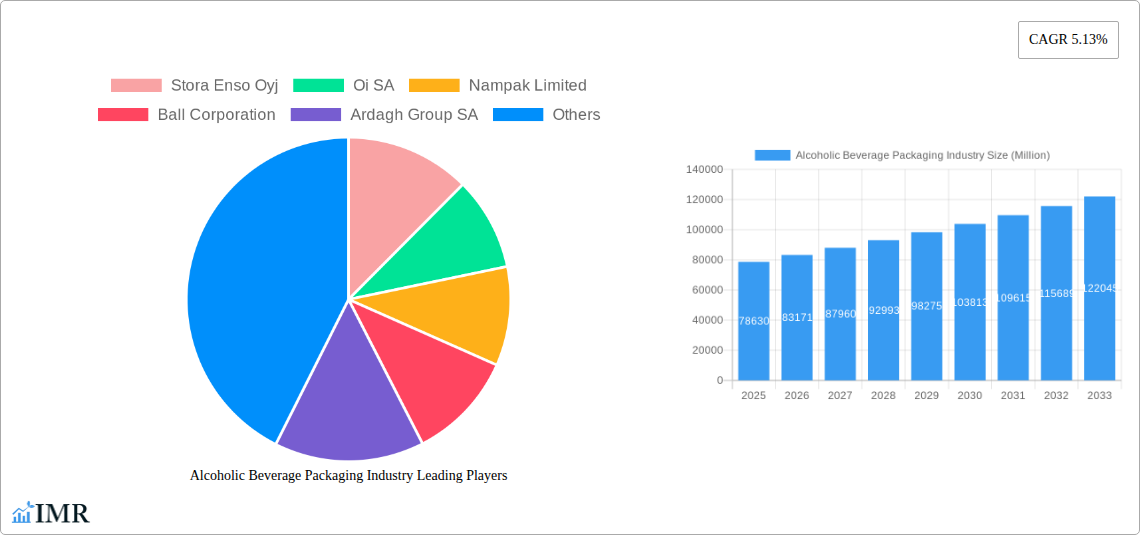
Alcoholic Beverage Packaging Industry Market Size (In Billion)
The market is characterized by diverse segmentation across materials and product types. Glass packaging continues to hold a significant share due to its perceived premium quality and inert nature, ideal for preserving the taste and aroma of spirits and wines. However, plastic packaging is gaining traction, especially for ready-to-drink (RTD) beverages and for its lightweight and shatter-proof properties, enhancing portability and safety. Metal packaging, particularly cans, is experiencing a resurgence due to their recyclability and cooling efficiency, appealing to the burgeoning craft beer and RTD segments. Key players like Stora Enso Oyj, Ball Corporation, and Crown Holdings Inc. are actively investing in research and development to introduce novel packaging designs and sustainable alternatives, driving innovation and shaping market dynamics. Geographically, North America and Europe are mature yet significant markets, while the Asia Pacific region, led by China and India, presents substantial growth opportunities owing to its expanding middle class and increasing alcohol consumption.
Alcoholic Beverage Packaging Industry Company Market Share
This comprehensive report offers an in-depth analysis of the global Alcoholic Beverage Packaging market, encompassing a detailed examination of market dynamics, growth trends, regional dominance, product landscape, key drivers, challenges, and emerging opportunities. Leveraging extensive historical data and forward-looking projections, this study provides actionable insights for stakeholders navigating this dynamic sector. The report covers the study period from 2019 to 2033, with 2025 serving as both the base and estimated year, and a forecast period of 2025–2033. The historical period analyzed is 2019–2024.
Alcoholic Beverage Packaging Industry Market Dynamics & Structure
The alcoholic beverage packaging market is characterized by a moderate to high level of concentration, with leading global players holding significant market shares. Technological innovation plays a pivotal role, driven by the demand for sustainable materials, enhanced shelf appeal, and improved product integrity. Regulatory frameworks, particularly concerning food-grade materials, recyclability, and anti-counterfeiting measures, significantly shape manufacturing processes and material choices. Competitive product substitutes, such as advancements in material science offering lighter yet equally protective alternatives, continuously challenge existing market norms. End-user demographics, influenced by evolving consumer preferences for convenience, premiumization, and eco-conscious choices, are a key driver of packaging design and functionality. Mergers and acquisitions (M&A) are a recurring trend, as companies seek to consolidate market presence, acquire innovative technologies, and expand their geographical reach. For instance, several high-value M&A deals have been observed in the historical period, impacting market shares and competitive landscapes. Barriers to innovation include the significant capital investment required for new machinery, the lengthy qualification processes for new materials within regulated industries, and the inertia of established supply chains.
- Market Concentration: Dominated by a few large global players, but with opportunities for niche market participation.
- Technological Innovation Drivers: Focus on sustainability (e.g., recycled content, biodegradable materials), lightweighting, smart packaging, and enhanced aesthetic appeal.
- Regulatory Frameworks: Strict adherence to food safety standards, labeling requirements, and increasing pressure for recyclable and reusable packaging solutions.
- Competitive Product Substitutes: Ongoing development of advanced polymers, composite materials, and innovative glass and metal technologies.
- End-User Demographics: Growing demand for premium and craft beverages, leading to sophisticated and differentiated packaging; increasing preference for single-serve and on-the-go formats.
- M&A Trends: Strategic acquisitions aimed at expanding product portfolios, gaining access to new technologies, and strengthening global supply chains.
Alcoholic Beverage Packaging Industry Growth Trends & Insights
The global alcoholic beverage packaging market is poised for robust growth, projected to witness a Compound Annual Growth Rate (CAGR) of approximately 5.8% during the forecast period (2025–2033). This expansion is fueled by a confluence of factors, including the steady increase in global alcoholic beverage consumption, particularly in emerging economies, and a rising consumer appreciation for aesthetically pleasing and environmentally responsible packaging. The market size is estimated to reach approximately $225.3 billion units by the end of the forecast period. Adoption rates for sustainable packaging solutions are rapidly accelerating, driven by both consumer demand and evolving regulatory mandates. This shift is evident in the increased use of recycled glass and aluminum, as well as the exploration of bioplastics and other novel biodegradable materials. Technological disruptions are continuously reshaping the industry, with advancements in printing techniques, barrier technologies, and smart packaging solutions enhancing product shelf life, authenticity, and consumer engagement. For example, innovations in direct-to-container printing are enabling greater customization and on-demand packaging solutions. Consumer behavior shifts are profoundly impacting the market; there's a growing preference for smaller, more convenient pack sizes, as well as a demand for premium and artisanal products that are reflected in sophisticated and unique packaging designs. The resurgence of craft brewing and distilling has further spurred innovation in packaging, with brands seeking to differentiate themselves through distinctive bottle shapes, labels, and closure systems. The convenience factor also plays a significant role, with the rise of ready-to-drink (RTD) beverages driving demand for cans and other portable packaging formats. Furthermore, the increasing focus on health and wellness is subtly influencing alcoholic beverage consumption patterns, with a growing interest in lower-alcohol and non-alcoholic options, which in turn presents new packaging challenges and opportunities. The e-commerce boom has also necessitated advancements in protective and aesthetically pleasing shipping solutions, ensuring that products arrive safely and in line with brand expectations.
Dominant Regions, Countries, or Segments in Alcoholic Beverage Packaging Industry
The Metal segment, particularly Cans, is emerging as a dominant force within the alcoholic beverage packaging industry, driven by its inherent recyclability, lightweight properties, and cost-effectiveness. North America and Europe currently lead in market share for metal beverage cans, owing to established recycling infrastructure and strong consumer preference for convenience and sustainability. The United States, in particular, accounts for a significant portion of the global demand, propelled by its large beer and RTD markets. The segment's dominance is further bolstered by ongoing technological advancements in can manufacturing, including thinner wall designs and advanced lining technologies that enhance product protection and reduce material usage. The widespread adoption of cans for beer, hard seltzers, and various RTD beverages across different alcohol categories underscores its versatility and appeal. Economic policies in key regions, such as deposit return schemes and mandates for recycled content, actively favor metal packaging. Infrastructure development, including expanded recycling facilities and efficient logistics networks for can collection and processing, also contributes to its sustained growth.
- Dominant Segment: Metal (specifically Cans)
- Key Drivers for Metal Cans:
- Sustainability: High recyclability rates and growing consumer demand for eco-friendly packaging.
- Cost-Effectiveness: Competitive pricing compared to other packaging materials.
- Lightweight Properties: Reduced transportation costs and environmental footprint.
- Product Preservation: Excellent barrier properties protecting against light, oxygen, and contaminants.
- Convenience: Portability and quick chilling capabilities.
- Technological Advancements: Innovations in can design, printing, and coating technologies.
- Regulatory Support: Favorable policies promoting recycled content and recyclability.
- Leading Countries: United States, Germany, United Kingdom, Canada.
- Growth Potential: Continued expansion driven by the RTD category, craft beverages, and increasing demand in emerging markets.
The Glass segment, particularly Bottles, remains a cornerstone of premium alcoholic beverage packaging. Its perceived quality, inertness, and aesthetic appeal make it the preferred choice for wine, spirits, and some premium beers. Europe, with its rich heritage in winemaking and spirits production, dominates the glass bottle market. Countries like France, Italy, and Spain are major consumers and innovators in this segment. The demand for glass bottles is driven by consumer preference for traditional packaging, the ability to showcase product color and clarity, and its excellent barrier properties that preserve the nuanced flavors of aged spirits and fine wines. Innovations in glass manufacturing, such as the development of lighter-weight glass and specialized coatings, are addressing some of the material's inherent challenges related to weight and fragility.
- Significant Segment: Glass (Bottles)
- Key Drivers for Glass Bottles:
- Premium Perception: Association with quality and tradition, especially for wine and spirits.
- Inertness: Does not react with contents, preserving flavor integrity.
- Aesthetic Appeal: Transparency allows for product visibility, enhancing visual appeal.
- Recyclability: Highly recyclable material with established recycling streams.
- Brand Heritage: Deeply embedded in the packaging strategies of established beverage brands.
- Leading Countries: France, Italy, Spain, United States.
- Growth Potential: Stable growth, particularly for high-end products and emerging craft spirits.
The Plastic segment, encompassing bottles and other products, is experiencing dynamic growth driven by its versatility, cost-effectiveness, and innovation in sustainable alternatives. While historically facing challenges related to environmental perception, advancements in recycled PET (rPET) and the development of bio-based plastics are reshaping this segment. The Asia-Pacific region, with its rapidly expanding middle class and growing alcoholic beverage market, is a key driver for plastic packaging. The convenience and shatterproof nature of plastic bottles make them attractive for certain beverage categories and markets where safety and portability are paramount.
- Growing Segment: Plastic (Bottles and Other Products)
- Key Drivers for Plastic:
- Versatility: Adaptable to various shapes, sizes, and functionalities.
- Cost-Effectiveness: Generally lower production and transportation costs.
- Lightweight: Reduces shipping expenses and environmental impact.
- Shatterproof: Enhanced safety, particularly in on-premise and event settings.
- Innovation in Sustainability: Increasing use of rPET and development of bio-plastics.
- Leading Regions: Asia-Pacific, North America.
- Growth Potential: Strong growth expected, especially with advancements in sustainable plastic solutions and expanding RTD markets.
Alcoholic Beverage Packaging Industry Product Landscape
The product landscape within alcoholic beverage packaging is characterized by continuous innovation aimed at enhancing consumer experience, ensuring product integrity, and promoting sustainability. Cans, particularly aluminum cans, are increasingly favored for their recyclability, lightweight properties, and rapid chilling capabilities, making them ideal for beers, hard seltzers, and RTDs. Bottles, crafted from glass or advanced plastics, continue to dominate the premium spirits and wine categories, offering aesthetic appeal and excellent barrier properties. Innovations include lightweight glass designs, advanced barrier coatings for plastics to prevent oxygen ingress, and unique bottle shapes that enhance brand differentiation. Other products, such as pouches and cartons, are gaining traction in niche markets for convenience and portability. Performance metrics like shelf life extension, reduction in material usage, and improved tamper-evident features are key differentiators in this competitive market.
Key Drivers, Barriers & Challenges in Alcoholic Beverage Packaging Industry
Key Drivers: The alcoholic beverage packaging industry is propelled by several key drivers. Growing Global Alcoholic Beverage Consumption, particularly in emerging markets, directly translates to increased demand for packaging solutions. Consumer Preference for Premiumization and Craft Beverages drives demand for innovative, aesthetically appealing packaging that enhances brand perception and product storytelling. The Increasing Popularity of Ready-to-Drink (RTD) Beverages necessitates convenient and portable packaging formats like cans and smaller bottles. Furthermore, the Growing Emphasis on Sustainability and Recyclability is a significant driver, pushing manufacturers to adopt eco-friendly materials and designs, including recycled content and lightweighting.
Barriers & Challenges: Despite robust growth, the industry faces significant barriers and challenges. Stringent Regulatory Frameworks concerning food contact materials, labeling, and recyclability can lead to increased compliance costs and product development timelines. Fluctuations in Raw Material Prices, such as aluminum and glass, can impact production costs and profitability. Supply Chain Disruptions, as witnessed in recent years, can affect the availability and timely delivery of essential packaging materials. High Capital Investment required for adopting new packaging technologies and machinery can be a barrier for smaller players. Finally, Consumer Skepticism towards certain materials, particularly plastics, necessitates continuous innovation in sustainable alternatives to maintain market acceptance. The cost of implementing advanced recycling infrastructure also presents a hurdle for widespread adoption of circular economy models.
Emerging Opportunities in Alcoholic Beverage Packaging Industry
Emerging opportunities in the alcoholic beverage packaging industry are abundant, driven by evolving consumer trends and technological advancements. The expansion of the Ready-to-Drink (RTD) beverage market presents a significant avenue for growth, with demand for innovative can designs, multi-packs, and single-serve formats. The increasing focus on low- and no-alcohol beverages is creating a new segment of packaging needs, often requiring distinct branding and messaging. Opportunities also lie in the development and adoption of truly circular packaging solutions, including enhanced reusable systems and advanced biodegradable materials that align with global sustainability goals. Smart packaging solutions, such as QR codes for traceability, augmented reality (AR) experiences, and temperature-sensing labels, offer avenues to enhance consumer engagement and product authenticity. Furthermore, the growing demand for personalized and limited-edition packaging in premium spirit and wine segments provides opportunities for bespoke design and printing solutions.
Growth Accelerators in the Alcoholic Beverage Packaging Industry Industry
Several catalysts are accelerating the growth of the alcoholic beverage packaging industry. Technological breakthroughs in material science, particularly in the development of lightweight, high-barrier, and sustainable materials like advanced polymers and bio-plastics, are enabling innovation and cost efficiencies. Strategic partnerships and collaborations between packaging manufacturers, beverage brands, and material suppliers are fostering the development and adoption of new solutions. Market expansion into emerging economies, driven by rising disposable incomes and evolving consumer lifestyles, is unlocking new demand centers. The ongoing digitalization of manufacturing processes, including advanced automation and data analytics, is improving efficiency, reducing waste, and enabling greater customization. Finally, increasing consumer awareness and demand for sustainable products acts as a powerful market pull, forcing the industry to innovate and invest in eco-friendly packaging solutions.
Key Players Shaping the Alcoholic Beverage Packaging Industry Market
- Stora Enso Oyj
- Oi SA
- Nampak Limited
- Ball Corporation
- Ardagh Group SA
- Krones AG
- Crown Holdings Inc
- Amcor PLC
- Mondi PLC
- Gerresheimer AG
- Berry Global Inc
- Sidel SA
Notable Milestones in Alcoholic Beverage Packaging Industry Sector
- 2020: Increased adoption of lightweight aluminum cans for seltzers and RTDs, expanding market share significantly.
- 2021: Rise in the use of recycled PET (rPET) for alcoholic beverage bottles, driven by sustainability commitments.
- 2022: Major beverage companies invest in R&D for innovative, reusable packaging solutions for beer and wine.
- 2023: Introduction of advanced barrier coatings for plastic bottles, extending shelf life for certain spirits.
- 2024: Growing interest in smart packaging solutions, including QR codes for traceability and augmented reality experiences.
In-Depth Alcoholic Beverage Packaging Industry Market Outlook
The outlook for the alcoholic beverage packaging industry remains exceptionally strong, underpinned by sustained growth in global consumption and an accelerating shift towards sustainable and innovative packaging solutions. Key growth accelerators, including advancements in material science, strategic industry collaborations, and expansion into high-potential emerging markets, will continue to fuel market expansion. The industry's ability to adapt to evolving consumer preferences for premium, convenient, and environmentally responsible products will be paramount. Strategic opportunities lie in further developing and scaling circular economy models, investing in digital manufacturing, and catering to the burgeoning low- and no-alcohol beverage segment. The market is poised for continued evolution, with a strong focus on delivering value through enhanced product protection, brand differentiation, and a reduced environmental footprint.
Alcoholic Beverage Packaging Industry Segmentation
-
1. Material
- 1.1. Glass
- 1.2. Metal
- 1.3. Plastic
- 1.4. Other Materials
-
2. Product
- 2.1. Cans
- 2.2. Bottles
- 2.3. Other Products
Alcoholic Beverage Packaging Industry Segmentation By Geography
-
1. North America
- 1.1. Unites States
- 1.2. Canada
-
2. Europe
- 2.1. Germany
- 2.2. United Kingdom
- 2.3. France
- 2.4. Rest of Europe
-
3. Asia Pacific
- 3.1. China
- 3.2. Japan
- 3.3. India
- 3.4. Rest of Asia Pacific
-
4. Rest of the World
- 4.1. Latin America
- 4.2. Middle East
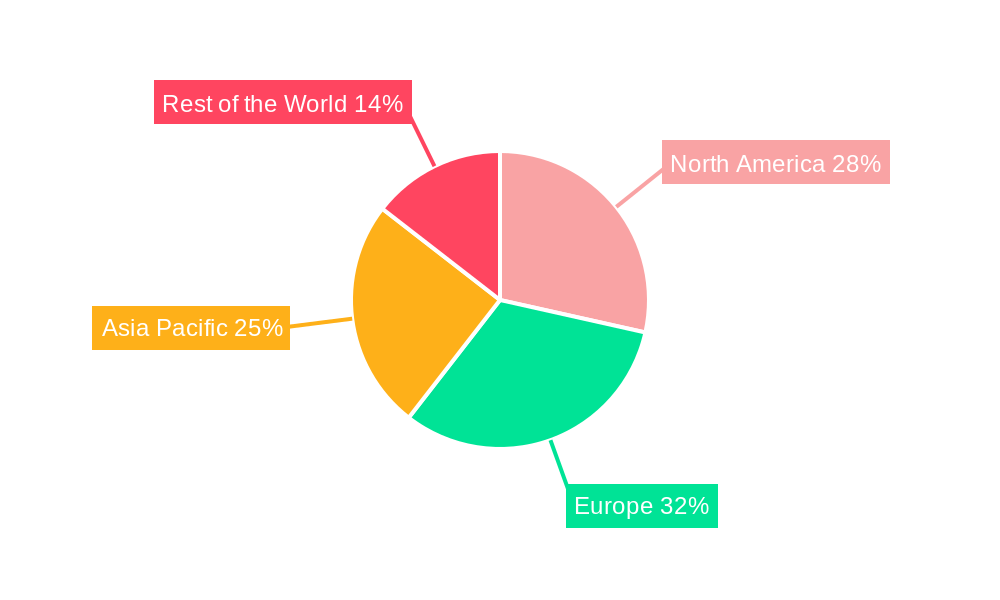
Alcoholic Beverage Packaging Industry Regional Market Share
Geographic Coverage of Alcoholic Beverage Packaging Industry
Alcoholic Beverage Packaging Industry REPORT HIGHLIGHTS
| Aspects | Details |
|---|---|
| Study Period | 2020-2034 |
| Base Year | 2025 |
| Estimated Year | 2026 |
| Forecast Period | 2026-2034 |
| Historical Period | 2020-2025 |
| Growth Rate | CAGR of 5.2% from 2020-2034 |
| Segmentation |
|
Table of Contents
- 1. Introduction
- 1.1. Research Scope
- 1.2. Market Segmentation
- 1.3. Research Objective
- 1.4. Definitions and Assumptions
- 2. Executive Summary
- 2.1. Market Snapshot
- 3. Market Dynamics
- 3.1. Market Drivers
- 3.2. Market Restrains
- 3.3. Market Trends
- 3.4. Market Opportunities
- 4. Market Factor Analysis
- 4.1. Porters Five Forces
- 4.1.1. Bargaining Power of Suppliers
- 4.1.2. Bargaining Power of Buyers
- 4.1.3. Threat of New Entrants
- 4.1.4. Threat of Substitutes
- 4.1.5. Competitive Rivalry
- 4.2. PESTEL analysis
- 4.3. BCG Analysis
- 4.3.1. Stars (High Growth, High Market Share)
- 4.3.2. Cash Cows (Low Growth, High Market Share)
- 4.3.3. Question Mark (High Growth, Low Market Share)
- 4.3.4. Dogs (Low Growth, Low Market Share)
- 4.4. Ansoff Matrix Analysis
- 4.5. Supply Chain Analysis
- 4.6. Regulatory Landscape
- 4.7. Current Market Potential and Opportunity Assessment (TAM–SAM–SOM Framework)
- 4.8. IMR Analyst Note
- 4.1. Porters Five Forces
- 5. Market Analysis, Insights and Forecast 2021-2033
- 5.1. Market Analysis, Insights and Forecast - by Material
- 5.1.1. Glass
- 5.1.2. Metal
- 5.1.3. Plastic
- 5.1.4. Other Materials
- 5.2. Market Analysis, Insights and Forecast - by Product
- 5.2.1. Cans
- 5.2.2. Bottles
- 5.2.3. Other Products
- 5.3. Market Analysis, Insights and Forecast - by Region
- 5.3.1. North America
- 5.3.2. Europe
- 5.3.3. Asia Pacific
- 5.3.4. Rest of the World
- 5.1. Market Analysis, Insights and Forecast - by Material
- 6. Global Alcoholic Beverage Packaging Industry Analysis, Insights and Forecast, 2021-2033
- 6.1. Market Analysis, Insights and Forecast - by Material
- 6.1.1. Glass
- 6.1.2. Metal
- 6.1.3. Plastic
- 6.1.4. Other Materials
- 6.2. Market Analysis, Insights and Forecast - by Product
- 6.2.1. Cans
- 6.2.2. Bottles
- 6.2.3. Other Products
- 6.1. Market Analysis, Insights and Forecast - by Material
- 7. North America Alcoholic Beverage Packaging Industry Analysis, Insights and Forecast, 2020-2032
- 7.1. Market Analysis, Insights and Forecast - by Material
- 7.1.1. Glass
- 7.1.2. Metal
- 7.1.3. Plastic
- 7.1.4. Other Materials
- 7.2. Market Analysis, Insights and Forecast - by Product
- 7.2.1. Cans
- 7.2.2. Bottles
- 7.2.3. Other Products
- 7.1. Market Analysis, Insights and Forecast - by Material
- 8. Europe Alcoholic Beverage Packaging Industry Analysis, Insights and Forecast, 2020-2032
- 8.1. Market Analysis, Insights and Forecast - by Material
- 8.1.1. Glass
- 8.1.2. Metal
- 8.1.3. Plastic
- 8.1.4. Other Materials
- 8.2. Market Analysis, Insights and Forecast - by Product
- 8.2.1. Cans
- 8.2.2. Bottles
- 8.2.3. Other Products
- 8.1. Market Analysis, Insights and Forecast - by Material
- 9. Asia Pacific Alcoholic Beverage Packaging Industry Analysis, Insights and Forecast, 2020-2032
- 9.1. Market Analysis, Insights and Forecast - by Material
- 9.1.1. Glass
- 9.1.2. Metal
- 9.1.3. Plastic
- 9.1.4. Other Materials
- 9.2. Market Analysis, Insights and Forecast - by Product
- 9.2.1. Cans
- 9.2.2. Bottles
- 9.2.3. Other Products
- 9.1. Market Analysis, Insights and Forecast - by Material
- 10. Rest of the World Alcoholic Beverage Packaging Industry Analysis, Insights and Forecast, 2020-2032
- 10.1. Market Analysis, Insights and Forecast - by Material
- 10.1.1. Glass
- 10.1.2. Metal
- 10.1.3. Plastic
- 10.1.4. Other Materials
- 10.2. Market Analysis, Insights and Forecast - by Product
- 10.2.1. Cans
- 10.2.2. Bottles
- 10.2.3. Other Products
- 10.1. Market Analysis, Insights and Forecast - by Material
- 11. Competitive Analysis
- 11.1. Company Profiles
- 11.1.1 Stora Enso Oyj
- 11.1.1.1. Company Overview
- 11.1.1.2. Products
- 11.1.1.3. Company Financials
- 11.1.1.4. SWOT Analysis
- 11.1.2 Oi SA
- 11.1.2.1. Company Overview
- 11.1.2.2. Products
- 11.1.2.3. Company Financials
- 11.1.2.4. SWOT Analysis
- 11.1.3 Nampak Limited
- 11.1.3.1. Company Overview
- 11.1.3.2. Products
- 11.1.3.3. Company Financials
- 11.1.3.4. SWOT Analysis
- 11.1.4 Ball Corporation
- 11.1.4.1. Company Overview
- 11.1.4.2. Products
- 11.1.4.3. Company Financials
- 11.1.4.4. SWOT Analysis
- 11.1.5 Ardagh Group SA
- 11.1.5.1. Company Overview
- 11.1.5.2. Products
- 11.1.5.3. Company Financials
- 11.1.5.4. SWOT Analysis
- 11.1.6 Krones AG
- 11.1.6.1. Company Overview
- 11.1.6.2. Products
- 11.1.6.3. Company Financials
- 11.1.6.4. SWOT Analysis
- 11.1.7 Crown Holdings Inc
- 11.1.7.1. Company Overview
- 11.1.7.2. Products
- 11.1.7.3. Company Financials
- 11.1.7.4. SWOT Analysis
- 11.1.8 Amcor PLC
- 11.1.8.1. Company Overview
- 11.1.8.2. Products
- 11.1.8.3. Company Financials
- 11.1.8.4. SWOT Analysis
- 11.1.9 Mondi PLC
- 11.1.9.1. Company Overview
- 11.1.9.2. Products
- 11.1.9.3. Company Financials
- 11.1.9.4. SWOT Analysis
- 11.1.10 Gerresheimer AG*List Not Exhaustive
- 11.1.10.1. Company Overview
- 11.1.10.2. Products
- 11.1.10.3. Company Financials
- 11.1.10.4. SWOT Analysis
- 11.1.11 Berry Global Inc
- 11.1.11.1. Company Overview
- 11.1.11.2. Products
- 11.1.11.3. Company Financials
- 11.1.11.4. SWOT Analysis
- 11.1.12 Sidel SA
- 11.1.12.1. Company Overview
- 11.1.12.2. Products
- 11.1.12.3. Company Financials
- 11.1.12.4. SWOT Analysis
- 11.1.1 Stora Enso Oyj
- 11.2. Market Entropy
- 11.2.1 Company's Key Areas Served
- 11.2.2 Recent Developments
- 11.3. Company Market Share Analysis 2025
- 11.3.1 Top 5 Companies Market Share Analysis
- 11.3.2 Top 3 Companies Market Share Analysis
- 11.4. List of Potential Customers
- 12. Research Methodology
List of Figures
- Figure 1: Global Alcoholic Beverage Packaging Industry Revenue Breakdown (billion, %) by Region 2025 & 2033
- Figure 2: North America Alcoholic Beverage Packaging Industry Revenue (billion), by Material 2025 & 2033
- Figure 3: North America Alcoholic Beverage Packaging Industry Revenue Share (%), by Material 2025 & 2033
- Figure 4: North America Alcoholic Beverage Packaging Industry Revenue (billion), by Product 2025 & 2033
- Figure 5: North America Alcoholic Beverage Packaging Industry Revenue Share (%), by Product 2025 & 2033
- Figure 6: North America Alcoholic Beverage Packaging Industry Revenue (billion), by Country 2025 & 2033
- Figure 7: North America Alcoholic Beverage Packaging Industry Revenue Share (%), by Country 2025 & 2033
- Figure 8: Europe Alcoholic Beverage Packaging Industry Revenue (billion), by Material 2025 & 2033
- Figure 9: Europe Alcoholic Beverage Packaging Industry Revenue Share (%), by Material 2025 & 2033
- Figure 10: Europe Alcoholic Beverage Packaging Industry Revenue (billion), by Product 2025 & 2033
- Figure 11: Europe Alcoholic Beverage Packaging Industry Revenue Share (%), by Product 2025 & 2033
- Figure 12: Europe Alcoholic Beverage Packaging Industry Revenue (billion), by Country 2025 & 2033
- Figure 13: Europe Alcoholic Beverage Packaging Industry Revenue Share (%), by Country 2025 & 2033
- Figure 14: Asia Pacific Alcoholic Beverage Packaging Industry Revenue (billion), by Material 2025 & 2033
- Figure 15: Asia Pacific Alcoholic Beverage Packaging Industry Revenue Share (%), by Material 2025 & 2033
- Figure 16: Asia Pacific Alcoholic Beverage Packaging Industry Revenue (billion), by Product 2025 & 2033
- Figure 17: Asia Pacific Alcoholic Beverage Packaging Industry Revenue Share (%), by Product 2025 & 2033
- Figure 18: Asia Pacific Alcoholic Beverage Packaging Industry Revenue (billion), by Country 2025 & 2033
- Figure 19: Asia Pacific Alcoholic Beverage Packaging Industry Revenue Share (%), by Country 2025 & 2033
- Figure 20: Rest of the World Alcoholic Beverage Packaging Industry Revenue (billion), by Material 2025 & 2033
- Figure 21: Rest of the World Alcoholic Beverage Packaging Industry Revenue Share (%), by Material 2025 & 2033
- Figure 22: Rest of the World Alcoholic Beverage Packaging Industry Revenue (billion), by Product 2025 & 2033
- Figure 23: Rest of the World Alcoholic Beverage Packaging Industry Revenue Share (%), by Product 2025 & 2033
- Figure 24: Rest of the World Alcoholic Beverage Packaging Industry Revenue (billion), by Country 2025 & 2033
- Figure 25: Rest of the World Alcoholic Beverage Packaging Industry Revenue Share (%), by Country 2025 & 2033
List of Tables
- Table 1: Global Alcoholic Beverage Packaging Industry Revenue billion Forecast, by Material 2020 & 2033
- Table 2: Global Alcoholic Beverage Packaging Industry Revenue billion Forecast, by Product 2020 & 2033
- Table 3: Global Alcoholic Beverage Packaging Industry Revenue billion Forecast, by Region 2020 & 2033
- Table 4: Global Alcoholic Beverage Packaging Industry Revenue billion Forecast, by Material 2020 & 2033
- Table 5: Global Alcoholic Beverage Packaging Industry Revenue billion Forecast, by Product 2020 & 2033
- Table 6: Global Alcoholic Beverage Packaging Industry Revenue billion Forecast, by Country 2020 & 2033
- Table 7: Unites States Alcoholic Beverage Packaging Industry Revenue (billion) Forecast, by Application 2020 & 2033
- Table 8: Canada Alcoholic Beverage Packaging Industry Revenue (billion) Forecast, by Application 2020 & 2033
- Table 9: Global Alcoholic Beverage Packaging Industry Revenue billion Forecast, by Material 2020 & 2033
- Table 10: Global Alcoholic Beverage Packaging Industry Revenue billion Forecast, by Product 2020 & 2033
- Table 11: Global Alcoholic Beverage Packaging Industry Revenue billion Forecast, by Country 2020 & 2033
- Table 12: Germany Alcoholic Beverage Packaging Industry Revenue (billion) Forecast, by Application 2020 & 2033
- Table 13: United Kingdom Alcoholic Beverage Packaging Industry Revenue (billion) Forecast, by Application 2020 & 2033
- Table 14: France Alcoholic Beverage Packaging Industry Revenue (billion) Forecast, by Application 2020 & 2033
- Table 15: Rest of Europe Alcoholic Beverage Packaging Industry Revenue (billion) Forecast, by Application 2020 & 2033
- Table 16: Global Alcoholic Beverage Packaging Industry Revenue billion Forecast, by Material 2020 & 2033
- Table 17: Global Alcoholic Beverage Packaging Industry Revenue billion Forecast, by Product 2020 & 2033
- Table 18: Global Alcoholic Beverage Packaging Industry Revenue billion Forecast, by Country 2020 & 2033
- Table 19: China Alcoholic Beverage Packaging Industry Revenue (billion) Forecast, by Application 2020 & 2033
- Table 20: Japan Alcoholic Beverage Packaging Industry Revenue (billion) Forecast, by Application 2020 & 2033
- Table 21: India Alcoholic Beverage Packaging Industry Revenue (billion) Forecast, by Application 2020 & 2033
- Table 22: Rest of Asia Pacific Alcoholic Beverage Packaging Industry Revenue (billion) Forecast, by Application 2020 & 2033
- Table 23: Global Alcoholic Beverage Packaging Industry Revenue billion Forecast, by Material 2020 & 2033
- Table 24: Global Alcoholic Beverage Packaging Industry Revenue billion Forecast, by Product 2020 & 2033
- Table 25: Global Alcoholic Beverage Packaging Industry Revenue billion Forecast, by Country 2020 & 2033
- Table 26: Latin America Alcoholic Beverage Packaging Industry Revenue (billion) Forecast, by Application 2020 & 2033
- Table 27: Middle East Alcoholic Beverage Packaging Industry Revenue (billion) Forecast, by Application 2020 & 2033
Frequently Asked Questions
1. What is the projected Compound Annual Growth Rate (CAGR) of the Alcoholic Beverage Packaging Industry?
The projected CAGR is approximately 5.2%.
2. Which companies are prominent players in the Alcoholic Beverage Packaging Industry?
Key companies in the market include Stora Enso Oyj, Oi SA, Nampak Limited, Ball Corporation, Ardagh Group SA, Krones AG, Crown Holdings Inc, Amcor PLC, Mondi PLC, Gerresheimer AG*List Not Exhaustive, Berry Global Inc, Sidel SA.
3. What are the main segments of the Alcoholic Beverage Packaging Industry?
The market segments include Material, Product.
4. Can you provide details about the market size?
The market size is estimated to be USD 157.28 billion as of 2022.
5. What are some drivers contributing to market growth?
; Increasing Consumption of Alcoholic Beverages; Increased Focus on Recycling; Rising Demand for Long Shelf Life of the Product.
6. What are the notable trends driving market growth?
Glass Packaging Segment to Account for a Crucial Share.
7. Are there any restraints impacting market growth?
; Implementation of Stringent Regulations on Packaging Materials.
8. Can you provide examples of recent developments in the market?
N/A
9. What pricing options are available for accessing the report?
Pricing options include single-user, multi-user, and enterprise licenses priced at USD 4750, USD 5250, and USD 8750 respectively.
10. Is the market size provided in terms of value or volume?
The market size is provided in terms of value, measured in billion.
11. Are there any specific market keywords associated with the report?
Yes, the market keyword associated with the report is "Alcoholic Beverage Packaging Industry," which aids in identifying and referencing the specific market segment covered.
12. How do I determine which pricing option suits my needs best?
The pricing options vary based on user requirements and access needs. Individual users may opt for single-user licenses, while businesses requiring broader access may choose multi-user or enterprise licenses for cost-effective access to the report.
13. Are there any additional resources or data provided in the Alcoholic Beverage Packaging Industry report?
While the report offers comprehensive insights, it's advisable to review the specific contents or supplementary materials provided to ascertain if additional resources or data are available.
14. How can I stay updated on further developments or reports in the Alcoholic Beverage Packaging Industry?
To stay informed about further developments, trends, and reports in the Alcoholic Beverage Packaging Industry, consider subscribing to industry newsletters, following relevant companies and organizations, or regularly checking reputable industry news sources and publications.
Methodology
Step 1 - Identification of Relevant Samples Size from Population Database


Step 2 - Approaches for Defining Global Market Size (Value, Volume* & Price*)

Note*: In applicable scenarios
Step 3 - Data Sources
Primary Research
- Web Analytics
- Survey Reports
- Research Institute
- Latest Research Reports
- Opinion Leaders
Secondary Research
- Annual Reports
- White Paper
- Latest Press Release
- Industry Association
- Paid Database
- Investor Presentations

Step 4 - Data Triangulation
Involves using different sources of information in order to increase the validity of a study
These sources are likely to be stakeholders in a program - participants, other researchers, program staff, other community members, and so on.
Then we put all data in single framework & apply various statistical tools to find out the dynamic on the market.
During the analysis stage, feedback from the stakeholder groups would be compared to determine areas of agreement as well as areas of divergence