

Key Insights
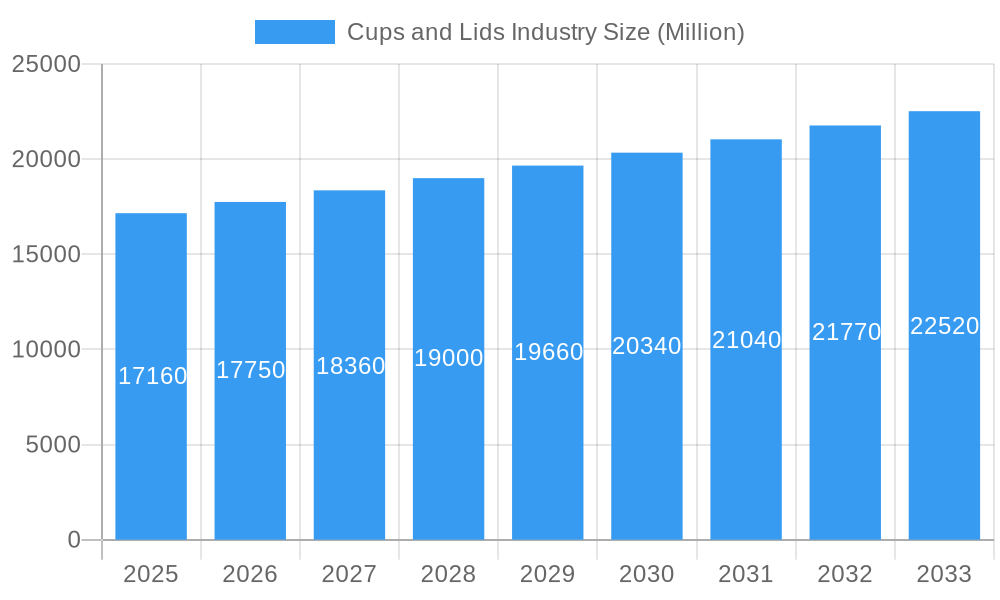
The global cups and lids market, valued at $17.16 billion in 2025, is projected to experience steady growth, driven by a compound annual growth rate (CAGR) of 3.40% from 2025 to 2033. This growth is fueled by several key factors. The burgeoning food and beverage industry, particularly the rise of quick-service restaurants and on-the-go consumption, significantly boosts demand for disposable cups and lids. Furthermore, the increasing popularity of takeaway and delivery services further fuels market expansion. Consumer preferences for convenience and single-use packaging, although facing increasing environmental concerns, continue to drive sales. Innovation in materials, with a focus on eco-friendly options like biodegradable and compostable alternatives to traditional plastics, is shaping market trends. However, growing environmental regulations and consumer awareness of plastic waste are creating constraints, pushing manufacturers towards sustainable solutions. Segmentation reveals that plastic cups currently dominate the market due to their affordability and versatility, yet paper and foam alternatives are gaining traction, driven by sustainability concerns. The food and beverage sector remains the largest end-user, with foodservice and retail industries exhibiting significant demand. Key players like Dart Container, Solo Cup, and Huhtamaki are continuously adapting their product portfolios to meet evolving consumer preferences and regulatory demands, highlighting the competitive landscape of this growing market.
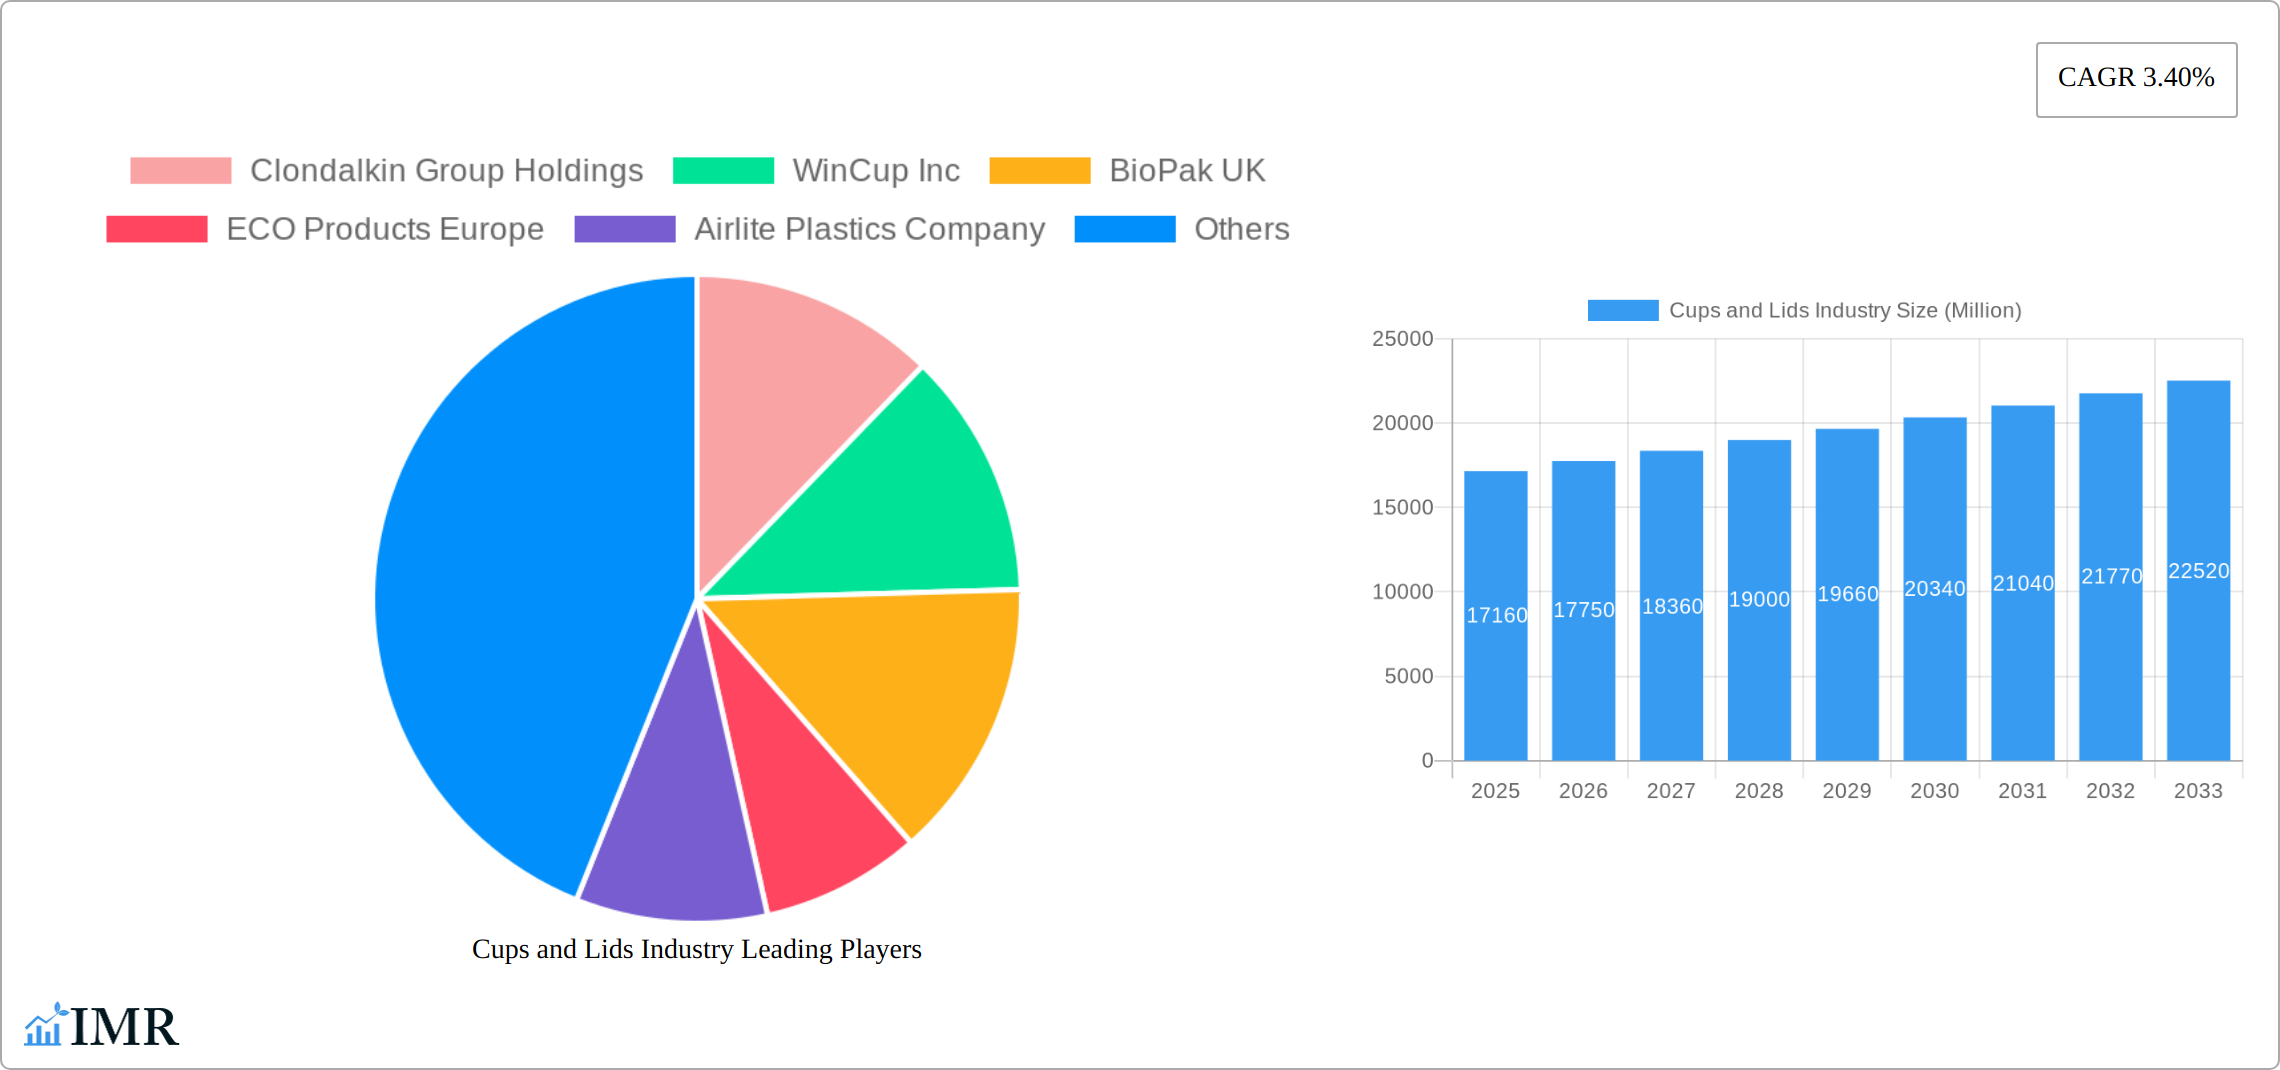
Cups and Lids Industry Market Size (In Billion)
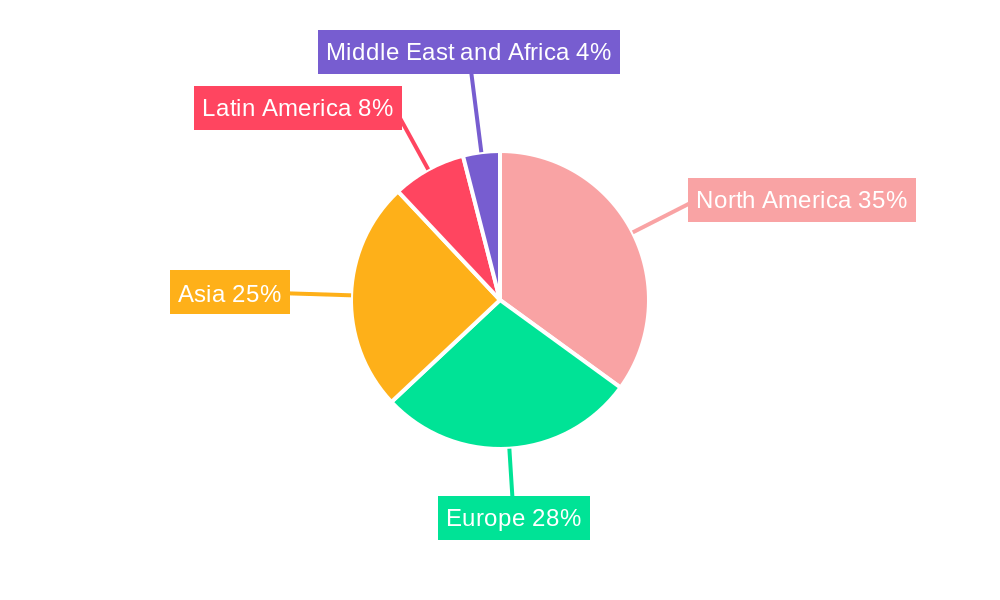
The geographical distribution of the market reflects regional variations in consumption patterns and economic development. North America and Europe currently hold significant market share, driven by high disposable incomes and established foodservice industries. However, the Asia-Pacific region, particularly China and India, is anticipated to witness substantial growth in the coming years, fueled by rapid urbanization and rising disposable incomes. Latin America and the Middle East and Africa are also expected to show modest growth, although at a potentially slower pace than other regions. The market's future trajectory is likely to be characterized by increasing emphasis on sustainable packaging solutions, material diversification, and expansion into emerging markets. Competition among established players and the emergence of new entrants offering innovative products will further shape the market landscape. Furthermore, the continued evolution of consumer preferences and environmental regulations will play a crucial role in determining the long-term growth prospects of the cups and lids industry.
Cups and Lids Industry Company Market Share
Cups and Lids Industry Market Report: 2019-2033
This comprehensive report provides a detailed analysis of the Cups and Lids industry, encompassing market dynamics, growth trends, competitive landscape, and future outlook. The study period covers 2019-2033, with 2025 as the base and estimated year. The report offers valuable insights for industry professionals, investors, and strategic decision-makers seeking to navigate this dynamic market. The global Cups and Lids market is projected to reach xx Million units by 2033.
Cups and Lids Industry Market Dynamics & Structure
The Cups and Lids industry is a dynamic sector characterized by moderate market consolidation, where established global manufacturers leverage economies of scale in production and sophisticated distribution networks to maintain significant market shares. Brand recognition and cutting-edge technological capabilities are pivotal in this competitive landscape. A primary driver of evolution is technological innovation, with a strong emphasis on developing sustainable materials. This includes a surge in biodegradable and compostable options, alongside advancements in recyclable plastics like rPET, and innovative manufacturing processes that enhance efficiency and reduce environmental impact. Furthermore, product functionality is a key focus, with ongoing research into leak-proof designs, improved insulation, and enhanced user convenience. The industry's trajectory is significantly shaped by a complex web of regulatory frameworks, particularly those focused on environmental stewardship, plastic waste reduction, and stringent food safety standards. In response to growing environmental awareness, the industry faces increasing competition from reusable alternatives, such as personal mugs and tumblers, which are influencing the demand for single-use solutions. Consumer preferences, especially a growing inclination towards eco-friendly products and convenience, are powerful trendsetters. The historical period from 2019 to 2024 has seen a moderate level of strategic mergers and acquisitions (M&A) activity, driven by companies aiming for market expansion, portfolio diversification, and overall sector consolidation.
- Market Concentration: Moderately consolidated, with top 10 players holding approximately 60-70% market share in 2024.
- Technological Innovation: A significant focus on sustainable material development (including advanced bioplastics, rPET, and molded fiber solutions), automation in manufacturing, and the implementation of superior sealing and barrier technologies.
- Regulatory Landscape: An increasing global emphasis on enhancing recyclability, promoting compostability, and actively reducing single-use plastic waste, leading to stricter regulations and product redesign.
- Competitive Substitutes: The market faces a growing threat from the increasing adoption of reusable cups, mugs, and tumblers, driven by consumer desire for sustainability and cost savings.
- M&A Activity: Approximately 40-50 major M&A deals were recorded between 2019 and 2024, predominantly aimed at expanding product portfolios, securing new technologies, and achieving greater geographic reach. The average deal value ranged from approximately $50 million to $250 million.
Cups and Lids Industry Growth Trends & Insights
The Cups and Lids industry has experienced steady growth over the past few years, driven by factors such as the increasing demand for takeaway food and beverages, expansion of foodservice outlets, and rising consumer preference for convenience. The market size exhibited a CAGR of xx% during the historical period (2019-2024), reaching xx Million units in 2024. Technological disruptions, particularly the introduction of sustainable materials and innovative manufacturing processes, are shaping market dynamics. Consumer behavior shifts towards eco-conscious choices and preference for premium quality products are also influencing market growth. Adoption rates for sustainable cups and lids are increasing steadily, although penetration rates still remain relatively low compared to conventional products. The forecast period (2025-2033) is expected to witness continued growth, driven by factors such as expanding foodservice sector, rising disposable incomes, and sustained technological advancements. The market is projected to reach xx Million units by 2033, with a projected CAGR of xx%.
Dominant Regions, Countries, or Segments in Cups and Lids Industry
North America and Europe currently stand as the dominant forces in the global Cups and Lids market. This leadership is attributed to a combination of factors including high per capita consumption of conveniently packaged food and beverages, well-developed and robust foodservice infrastructures, and the significant presence of key industry players. Within the material landscape, conventional plastic cups continue to hold the largest market share, although there is a clear and accelerating trend towards the adoption of paper-based and other sustainable material alternatives. The "drinking cups" segment constitutes the largest product category, followed closely by specialized packaging cups and lids designed for specific food items. The food and beverage sector, alongside the broader foodservice industry, represents the most significant end-user verticals for these products. Key drivers underpinning regional dominance in these established markets include strong economic growth, sophisticated retail and foodservice ecosystems, and supportive regulatory environments. Conversely, rapidly developing markets within the Asia-Pacific and Latin American regions present substantial future growth potential, fueled by rising disposable incomes, increasing urbanization, and the aggressive expansion of national and international foodservice chains.
- Leading Region: North America, with Europe as a close second.
- Leading Material Segment: Plastic (estimated xx% market share in 2024), with paper and molded fiber showing strong growth.
- Leading Product Segment: Drinking Cups (estimated xx% market share in 2024), encompassing hot and cold beverage cups.
- Leading End-User Vertical: Food and Beverage, closely followed by the Foodservice industry.
- Key Drivers: Sustained economic growth in developed markets, a significant increase in disposable incomes in emerging economies, and the continuous expansion of the global foodservice industry.
Cups and Lids Industry Product Landscape
Product innovation within the Cups and Lids industry is intensely focused on elevating functionality, enhancing sustainability credentials, and improving aesthetic appeal. New product developments are actively incorporating advanced leak-proof designs, superior insulation properties for better temperature retention, and a wider range of biodegradable and recyclable materials. Critical performance metrics such as material strength, product durability, and intuitive ease of use are paramount in influencing consumer purchasing decisions. Unique selling propositions frequently highlight key features such as environmental friendliness, user convenience, and sophisticated design aesthetics. Technological advancements are instrumental in driving the development of more efficient and environmentally responsible production processes, leading to reduced manufacturing costs and a minimized ecological footprint.
Key Drivers, Barriers & Challenges in Cups and Lids Industry
Key Drivers:
- Growing demand for takeaway food and beverages.
- Expansion of the foodservice industry.
- Increasing consumer preference for convenience.
- Technological advancements in sustainable materials and manufacturing processes.
Key Challenges and Restraints:
- Fluctuations in raw material prices, impacting profitability.
- Stringent environmental regulations, increasing compliance costs.
- Intense competition from established and new entrants.
- Supply chain disruptions due to geopolitical events or pandemics, potentially affecting production and distribution. Estimated impact on market growth in 2024: xx%.
Emerging Opportunities in Cups and Lids Industry
- Growing demand for sustainable and eco-friendly products presents significant opportunities for manufacturers of biodegradable and compostable cups and lids.
- Expansion into emerging markets with high growth potential in Asia and Latin America.
- Development of innovative product designs and features, catering to specific end-user needs.
- Customization options for branding and design, enhancing customer engagement.
Growth Accelerators in the Cups and Lids Industry
Strategic partnerships and collaborations between manufacturers and materials suppliers are accelerating the development and adoption of sustainable materials. Technological breakthroughs, particularly in the area of biodegradable plastics and improved manufacturing efficiency, are streamlining production and reducing costs. Market expansion strategies, focusing on untapped markets and emerging regions, are creating new revenue streams and driving long-term growth.
Key Players Shaping the Cups and Lids Industry Market
- Clondalkin Group Holdings
- WinCup Inc.
- BioPak UK
- ECO Products Europe
- Airlite Plastics Company
- Brendos Ltd
- Dart Container
- Paper Cup Company
- Solo Cup Operating Corporation
- Mondi Group
- Georgia-Pacific LLC
- Greiner Holding AG
- Greiner AG
- Graphic Packaging International LLC
- Berry Global
- Printpack Inc.
- Reynolds Consumer Products
- Huhtamaki Oyj
- Michael Procos SA
Notable Milestones in Cups and Lids Industry Sector
- April 2023: Greiner Packaging, in collaboration with Engel and Brink, successfully developed a new thin-walled rPET cup utilizing advanced injection molding techniques, resulting in a significant reduction in CO2e emissions.
- April 2022: PulPac and HSMG announced a strategic collaboration to develop advanced water and oil barrier solutions for PulPac's Dry Molded fiber technology, enhancing the recyclability and performance of molded fiber packaging for critical applications like coffee cups and lids.
In-Depth Cups and Lids Industry Market Outlook
The Cups and Lids industry is poised for sustained growth driven by the confluence of several factors, including increasing consumer demand for convenient packaging, a rising global population, and a growing emphasis on sustainable practices within the food and beverage sector. This presents significant opportunities for innovation, strategic partnerships, and expansion into emerging markets. The focus on eco-friendly alternatives and enhanced product functionalities will be key drivers of future market potential. Companies that successfully navigate the challenges of raw material price volatility and stringent environmental regulations will be best positioned to capture market share and realize substantial growth in the coming years.
Cups and Lids Industry Segmentation
-
1. Material
- 1.1. Plastic
- 1.2. Paper
- 1.3. Foam
- 1.4. Other Materials
-
2. Product
- 2.1. Drinking Cups
- 2.2. Packagin
- 2.3. Lids
-
3. End-User Vertical
- 3.1. Food and Beverage
- 3.2. Foodservices
- 3.3. Retail and Other End User Verticals
Cups and Lids Industry Segmentation By Geography
-
1. North America
- 1.1. United States
- 1.2. Canada
-
2. Europe
- 2.1. United kingdom
- 2.2. France
- 2.3. Germany
-
3. Asia
- 3.1. China
- 3.2. Japan
- 3.3. India
- 3.4. Australia and New Zealand
-
4. Latin America
- 4.1. Brazil
- 4.2. Mexico
-
5. Middle East and Africa
- 5.1. United Arab Emirates
- 5.2. South Africa
- 5.3. Saudi Arabia
Cups and Lids Industry Regional Market Share
Geographic Coverage of Cups and Lids Industry
Cups and Lids Industry REPORT HIGHLIGHTS
| Aspects | Details |
|---|---|
| Study Period | 2020-2034 |
| Base Year | 2025 |
| Estimated Year | 2026 |
| Forecast Period | 2026-2034 |
| Historical Period | 2020-2025 |
| Growth Rate | CAGR of 3.40% from 2020-2034 |
| Segmentation |
|
Table of Contents
- 1. Introduction
- 1.1. Research Scope
- 1.2. Market Segmentation
- 1.3. Research Objective
- 1.4. Definitions and Assumptions
- 2. Executive Summary
- 2.1. Market Snapshot
- 3. Market Dynamics
- 3.1. Market Drivers
- 3.2. Market Restrains
- 3.3. Market Trends
- 3.4. Market Opportunities
- 4. Market Factor Analysis
- 4.1. Porters Five Forces
- 4.1.1. Bargaining Power of Suppliers
- 4.1.2. Bargaining Power of Buyers
- 4.1.3. Threat of New Entrants
- 4.1.4. Threat of Substitutes
- 4.1.5. Competitive Rivalry
- 4.2. PESTEL analysis
- 4.3. BCG Analysis
- 4.3.1. Stars (High Growth, High Market Share)
- 4.3.2. Cash Cows (Low Growth, High Market Share)
- 4.3.3. Question Mark (High Growth, Low Market Share)
- 4.3.4. Dogs (Low Growth, Low Market Share)
- 4.4. Ansoff Matrix Analysis
- 4.5. Supply Chain Analysis
- 4.6. Regulatory Landscape
- 4.7. Current Market Potential and Opportunity Assessment (TAM–SAM–SOM Framework)
- 4.8. IMR Analyst Note
- 4.1. Porters Five Forces
- 5. Market Analysis, Insights and Forecast 2021-2033
- 5.1. Market Analysis, Insights and Forecast - by Material
- 5.1.1. Plastic
- 5.1.2. Paper
- 5.1.3. Foam
- 5.1.4. Other Materials
- 5.2. Market Analysis, Insights and Forecast - by Product
- 5.2.1. Drinking Cups
- 5.2.2. Packagin
- 5.2.3. Lids
- 5.3. Market Analysis, Insights and Forecast - by End-User Vertical
- 5.3.1. Food and Beverage
- 5.3.2. Foodservices
- 5.3.3. Retail and Other End User Verticals
- 5.4. Market Analysis, Insights and Forecast - by Region
- 5.4.1. North America
- 5.4.2. Europe
- 5.4.3. Asia
- 5.4.4. Latin America
- 5.4.5. Middle East and Africa
- 5.1. Market Analysis, Insights and Forecast - by Material
- 6. Global Cups and Lids Industry Analysis, Insights and Forecast, 2021-2033
- 6.1. Market Analysis, Insights and Forecast - by Material
- 6.1.1. Plastic
- 6.1.2. Paper
- 6.1.3. Foam
- 6.1.4. Other Materials
- 6.2. Market Analysis, Insights and Forecast - by Product
- 6.2.1. Drinking Cups
- 6.2.2. Packagin
- 6.2.3. Lids
- 6.3. Market Analysis, Insights and Forecast - by End-User Vertical
- 6.3.1. Food and Beverage
- 6.3.2. Foodservices
- 6.3.3. Retail and Other End User Verticals
- 6.1. Market Analysis, Insights and Forecast - by Material
- 7. North America Cups and Lids Industry Analysis, Insights and Forecast, 2020-2032
- 7.1. Market Analysis, Insights and Forecast - by Material
- 7.1.1. Plastic
- 7.1.2. Paper
- 7.1.3. Foam
- 7.1.4. Other Materials
- 7.2. Market Analysis, Insights and Forecast - by Product
- 7.2.1. Drinking Cups
- 7.2.2. Packagin
- 7.2.3. Lids
- 7.3. Market Analysis, Insights and Forecast - by End-User Vertical
- 7.3.1. Food and Beverage
- 7.3.2. Foodservices
- 7.3.3. Retail and Other End User Verticals
- 7.1. Market Analysis, Insights and Forecast - by Material
- 8. Europe Cups and Lids Industry Analysis, Insights and Forecast, 2020-2032
- 8.1. Market Analysis, Insights and Forecast - by Material
- 8.1.1. Plastic
- 8.1.2. Paper
- 8.1.3. Foam
- 8.1.4. Other Materials
- 8.2. Market Analysis, Insights and Forecast - by Product
- 8.2.1. Drinking Cups
- 8.2.2. Packagin
- 8.2.3. Lids
- 8.3. Market Analysis, Insights and Forecast - by End-User Vertical
- 8.3.1. Food and Beverage
- 8.3.2. Foodservices
- 8.3.3. Retail and Other End User Verticals
- 8.1. Market Analysis, Insights and Forecast - by Material
- 9. Asia Cups and Lids Industry Analysis, Insights and Forecast, 2020-2032
- 9.1. Market Analysis, Insights and Forecast - by Material
- 9.1.1. Plastic
- 9.1.2. Paper
- 9.1.3. Foam
- 9.1.4. Other Materials
- 9.2. Market Analysis, Insights and Forecast - by Product
- 9.2.1. Drinking Cups
- 9.2.2. Packagin
- 9.2.3. Lids
- 9.3. Market Analysis, Insights and Forecast - by End-User Vertical
- 9.3.1. Food and Beverage
- 9.3.2. Foodservices
- 9.3.3. Retail and Other End User Verticals
- 9.1. Market Analysis, Insights and Forecast - by Material
- 10. Latin America Cups and Lids Industry Analysis, Insights and Forecast, 2020-2032
- 10.1. Market Analysis, Insights and Forecast - by Material
- 10.1.1. Plastic
- 10.1.2. Paper
- 10.1.3. Foam
- 10.1.4. Other Materials
- 10.2. Market Analysis, Insights and Forecast - by Product
- 10.2.1. Drinking Cups
- 10.2.2. Packagin
- 10.2.3. Lids
- 10.3. Market Analysis, Insights and Forecast - by End-User Vertical
- 10.3.1. Food and Beverage
- 10.3.2. Foodservices
- 10.3.3. Retail and Other End User Verticals
- 10.1. Market Analysis, Insights and Forecast - by Material
- 11. Middle East and Africa Cups and Lids Industry Analysis, Insights and Forecast, 2020-2032
- 11.1. Market Analysis, Insights and Forecast - by Material
- 11.1.1. Plastic
- 11.1.2. Paper
- 11.1.3. Foam
- 11.1.4. Other Materials
- 11.2. Market Analysis, Insights and Forecast - by Product
- 11.2.1. Drinking Cups
- 11.2.2. Packagin
- 11.2.3. Lids
- 11.3. Market Analysis, Insights and Forecast - by End-User Vertical
- 11.3.1. Food and Beverage
- 11.3.2. Foodservices
- 11.3.3. Retail and Other End User Verticals
- 11.1. Market Analysis, Insights and Forecast - by Material
- 12. Competitive Analysis
- 12.1. Company Profiles
- 12.1.1 Clondalkin Group Holdings
- 12.1.1.1. Company Overview
- 12.1.1.2. Products
- 12.1.1.3. Company Financials
- 12.1.1.4. SWOT Analysis
- 12.1.2 WinCup Inc
- 12.1.2.1. Company Overview
- 12.1.2.2. Products
- 12.1.2.3. Company Financials
- 12.1.2.4. SWOT Analysis
- 12.1.3 BioPak UK
- 12.1.3.1. Company Overview
- 12.1.3.2. Products
- 12.1.3.3. Company Financials
- 12.1.3.4. SWOT Analysis
- 12.1.4 ECO Products Europe
- 12.1.4.1. Company Overview
- 12.1.4.2. Products
- 12.1.4.3. Company Financials
- 12.1.4.4. SWOT Analysis
- 12.1.5 Airlite Plastics Company
- 12.1.5.1. Company Overview
- 12.1.5.2. Products
- 12.1.5.3. Company Financials
- 12.1.5.4. SWOT Analysis
- 12.1.6 Brendos Ltd
- 12.1.6.1. Company Overview
- 12.1.6.2. Products
- 12.1.6.3. Company Financials
- 12.1.6.4. SWOT Analysis
- 12.1.7 Dart Containe
- 12.1.7.1. Company Overview
- 12.1.7.2. Products
- 12.1.7.3. Company Financials
- 12.1.7.4. SWOT Analysis
- 12.1.8 Paper Cup Company
- 12.1.8.1. Company Overview
- 12.1.8.2. Products
- 12.1.8.3. Company Financials
- 12.1.8.4. SWOT Analysis
- 12.1.9 Solo Cup Operating Corporation
- 12.1.9.1. Company Overview
- 12.1.9.2. Products
- 12.1.9.3. Company Financials
- 12.1.9.4. SWOT Analysis
- 12.1.10 Mondi Group
- 12.1.10.1. Company Overview
- 12.1.10.2. Products
- 12.1.10.3. Company Financials
- 12.1.10.4. SWOT Analysis
- 12.1.11 Georgia-Pacific LLC
- 12.1.11.1. Company Overview
- 12.1.11.2. Products
- 12.1.11.3. Company Financials
- 12.1.11.4. SWOT Analysis
- 12.1.12 Greiner Holding AG
- 12.1.12.1. Company Overview
- 12.1.12.2. Products
- 12.1.12.3. Company Financials
- 12.1.12.4. SWOT Analysis
- 12.1.13 Greiner AG
- 12.1.13.1. Company Overview
- 12.1.13.2. Products
- 12.1.13.3. Company Financials
- 12.1.13.4. SWOT Analysis
- 12.1.14 Graphic Packaging International LLC
- 12.1.14.1. Company Overview
- 12.1.14.2. Products
- 12.1.14.3. Company Financials
- 12.1.14.4. SWOT Analysis
- 12.1.15 Berry Global
- 12.1.15.1. Company Overview
- 12.1.15.2. Products
- 12.1.15.3. Company Financials
- 12.1.15.4. SWOT Analysis
- 12.1.16 Printpack Inc
- 12.1.16.1. Company Overview
- 12.1.16.2. Products
- 12.1.16.3. Company Financials
- 12.1.16.4. SWOT Analysis
- 12.1.17 Reynolds Consumer Products
- 12.1.17.1. Company Overview
- 12.1.17.2. Products
- 12.1.17.3. Company Financials
- 12.1.17.4. SWOT Analysis
- 12.1.18 Huhtamaki Oyj
- 12.1.18.1. Company Overview
- 12.1.18.2. Products
- 12.1.18.3. Company Financials
- 12.1.18.4. SWOT Analysis
- 12.1.19 Michael Procos SA
- 12.1.19.1. Company Overview
- 12.1.19.2. Products
- 12.1.19.3. Company Financials
- 12.1.19.4. SWOT Analysis
- 12.1.1 Clondalkin Group Holdings
- 12.2. Market Entropy
- 12.2.1 Company's Key Areas Served
- 12.2.2 Recent Developments
- 12.3. Company Market Share Analysis 2025
- 12.3.1 Top 5 Companies Market Share Analysis
- 12.3.2 Top 3 Companies Market Share Analysis
- 12.4. List of Potential Customers
- 13. Research Methodology
List of Figures
- Figure 1: Global Cups and Lids Industry Revenue Breakdown (Million, %) by Region 2025 & 2033
- Figure 2: North America Cups and Lids Industry Revenue (Million), by Material 2025 & 2033
- Figure 3: North America Cups and Lids Industry Revenue Share (%), by Material 2025 & 2033
- Figure 4: North America Cups and Lids Industry Revenue (Million), by Product 2025 & 2033
- Figure 5: North America Cups and Lids Industry Revenue Share (%), by Product 2025 & 2033
- Figure 6: North America Cups and Lids Industry Revenue (Million), by End-User Vertical 2025 & 2033
- Figure 7: North America Cups and Lids Industry Revenue Share (%), by End-User Vertical 2025 & 2033
- Figure 8: North America Cups and Lids Industry Revenue (Million), by Country 2025 & 2033
- Figure 9: North America Cups and Lids Industry Revenue Share (%), by Country 2025 & 2033
- Figure 10: Europe Cups and Lids Industry Revenue (Million), by Material 2025 & 2033
- Figure 11: Europe Cups and Lids Industry Revenue Share (%), by Material 2025 & 2033
- Figure 12: Europe Cups and Lids Industry Revenue (Million), by Product 2025 & 2033
- Figure 13: Europe Cups and Lids Industry Revenue Share (%), by Product 2025 & 2033
- Figure 14: Europe Cups and Lids Industry Revenue (Million), by End-User Vertical 2025 & 2033
- Figure 15: Europe Cups and Lids Industry Revenue Share (%), by End-User Vertical 2025 & 2033
- Figure 16: Europe Cups and Lids Industry Revenue (Million), by Country 2025 & 2033
- Figure 17: Europe Cups and Lids Industry Revenue Share (%), by Country 2025 & 2033
- Figure 18: Asia Cups and Lids Industry Revenue (Million), by Material 2025 & 2033
- Figure 19: Asia Cups and Lids Industry Revenue Share (%), by Material 2025 & 2033
- Figure 20: Asia Cups and Lids Industry Revenue (Million), by Product 2025 & 2033
- Figure 21: Asia Cups and Lids Industry Revenue Share (%), by Product 2025 & 2033
- Figure 22: Asia Cups and Lids Industry Revenue (Million), by End-User Vertical 2025 & 2033
- Figure 23: Asia Cups and Lids Industry Revenue Share (%), by End-User Vertical 2025 & 2033
- Figure 24: Asia Cups and Lids Industry Revenue (Million), by Country 2025 & 2033
- Figure 25: Asia Cups and Lids Industry Revenue Share (%), by Country 2025 & 2033
- Figure 26: Latin America Cups and Lids Industry Revenue (Million), by Material 2025 & 2033
- Figure 27: Latin America Cups and Lids Industry Revenue Share (%), by Material 2025 & 2033
- Figure 28: Latin America Cups and Lids Industry Revenue (Million), by Product 2025 & 2033
- Figure 29: Latin America Cups and Lids Industry Revenue Share (%), by Product 2025 & 2033
- Figure 30: Latin America Cups and Lids Industry Revenue (Million), by End-User Vertical 2025 & 2033
- Figure 31: Latin America Cups and Lids Industry Revenue Share (%), by End-User Vertical 2025 & 2033
- Figure 32: Latin America Cups and Lids Industry Revenue (Million), by Country 2025 & 2033
- Figure 33: Latin America Cups and Lids Industry Revenue Share (%), by Country 2025 & 2033
- Figure 34: Middle East and Africa Cups and Lids Industry Revenue (Million), by Material 2025 & 2033
- Figure 35: Middle East and Africa Cups and Lids Industry Revenue Share (%), by Material 2025 & 2033
- Figure 36: Middle East and Africa Cups and Lids Industry Revenue (Million), by Product 2025 & 2033
- Figure 37: Middle East and Africa Cups and Lids Industry Revenue Share (%), by Product 2025 & 2033
- Figure 38: Middle East and Africa Cups and Lids Industry Revenue (Million), by End-User Vertical 2025 & 2033
- Figure 39: Middle East and Africa Cups and Lids Industry Revenue Share (%), by End-User Vertical 2025 & 2033
- Figure 40: Middle East and Africa Cups and Lids Industry Revenue (Million), by Country 2025 & 2033
- Figure 41: Middle East and Africa Cups and Lids Industry Revenue Share (%), by Country 2025 & 2033
List of Tables
- Table 1: Global Cups and Lids Industry Revenue Million Forecast, by Material 2020 & 2033
- Table 2: Global Cups and Lids Industry Revenue Million Forecast, by Product 2020 & 2033
- Table 3: Global Cups and Lids Industry Revenue Million Forecast, by End-User Vertical 2020 & 2033
- Table 4: Global Cups and Lids Industry Revenue Million Forecast, by Region 2020 & 2033
- Table 5: Global Cups and Lids Industry Revenue Million Forecast, by Material 2020 & 2033
- Table 6: Global Cups and Lids Industry Revenue Million Forecast, by Product 2020 & 2033
- Table 7: Global Cups and Lids Industry Revenue Million Forecast, by End-User Vertical 2020 & 2033
- Table 8: Global Cups and Lids Industry Revenue Million Forecast, by Country 2020 & 2033
- Table 9: United States Cups and Lids Industry Revenue (Million) Forecast, by Application 2020 & 2033
- Table 10: Canada Cups and Lids Industry Revenue (Million) Forecast, by Application 2020 & 2033
- Table 11: Global Cups and Lids Industry Revenue Million Forecast, by Material 2020 & 2033
- Table 12: Global Cups and Lids Industry Revenue Million Forecast, by Product 2020 & 2033
- Table 13: Global Cups and Lids Industry Revenue Million Forecast, by End-User Vertical 2020 & 2033
- Table 14: Global Cups and Lids Industry Revenue Million Forecast, by Country 2020 & 2033
- Table 15: United kingdom Cups and Lids Industry Revenue (Million) Forecast, by Application 2020 & 2033
- Table 16: France Cups and Lids Industry Revenue (Million) Forecast, by Application 2020 & 2033
- Table 17: Germany Cups and Lids Industry Revenue (Million) Forecast, by Application 2020 & 2033
- Table 18: Global Cups and Lids Industry Revenue Million Forecast, by Material 2020 & 2033
- Table 19: Global Cups and Lids Industry Revenue Million Forecast, by Product 2020 & 2033
- Table 20: Global Cups and Lids Industry Revenue Million Forecast, by End-User Vertical 2020 & 2033
- Table 21: Global Cups and Lids Industry Revenue Million Forecast, by Country 2020 & 2033
- Table 22: China Cups and Lids Industry Revenue (Million) Forecast, by Application 2020 & 2033
- Table 23: Japan Cups and Lids Industry Revenue (Million) Forecast, by Application 2020 & 2033
- Table 24: India Cups and Lids Industry Revenue (Million) Forecast, by Application 2020 & 2033
- Table 25: Australia and New Zealand Cups and Lids Industry Revenue (Million) Forecast, by Application 2020 & 2033
- Table 26: Global Cups and Lids Industry Revenue Million Forecast, by Material 2020 & 2033
- Table 27: Global Cups and Lids Industry Revenue Million Forecast, by Product 2020 & 2033
- Table 28: Global Cups and Lids Industry Revenue Million Forecast, by End-User Vertical 2020 & 2033
- Table 29: Global Cups and Lids Industry Revenue Million Forecast, by Country 2020 & 2033
- Table 30: Brazil Cups and Lids Industry Revenue (Million) Forecast, by Application 2020 & 2033
- Table 31: Mexico Cups and Lids Industry Revenue (Million) Forecast, by Application 2020 & 2033
- Table 32: Global Cups and Lids Industry Revenue Million Forecast, by Material 2020 & 2033
- Table 33: Global Cups and Lids Industry Revenue Million Forecast, by Product 2020 & 2033
- Table 34: Global Cups and Lids Industry Revenue Million Forecast, by End-User Vertical 2020 & 2033
- Table 35: Global Cups and Lids Industry Revenue Million Forecast, by Country 2020 & 2033
- Table 36: United Arab Emirates Cups and Lids Industry Revenue (Million) Forecast, by Application 2020 & 2033
- Table 37: South Africa Cups and Lids Industry Revenue (Million) Forecast, by Application 2020 & 2033
- Table 38: Saudi Arabia Cups and Lids Industry Revenue (Million) Forecast, by Application 2020 & 2033
Frequently Asked Questions
1. What is the projected Compound Annual Growth Rate (CAGR) of the Cups and Lids Industry?
The projected CAGR is approximately 3.40%.
2. Which companies are prominent players in the Cups and Lids Industry?
Key companies in the market include Clondalkin Group Holdings, WinCup Inc, BioPak UK, ECO Products Europe, Airlite Plastics Company, Brendos Ltd, Dart Containe, Paper Cup Company, Solo Cup Operating Corporation, Mondi Group, Georgia-Pacific LLC, Greiner Holding AG, Greiner AG, Graphic Packaging International LLC, Berry Global, Printpack Inc, Reynolds Consumer Products, Huhtamaki Oyj, Michael Procos SA.
3. What are the main segments of the Cups and Lids Industry?
The market segments include Material, Product, End-User Vertical.
4. Can you provide details about the market size?
The market size is estimated to be USD 17.16 Million as of 2022.
5. What are some drivers contributing to market growth?
Food and Beverage Segment to Witness Significant Growth; Growing Number of QSR Aids to Market Growth.
6. What are the notable trends driving market growth?
Food and Beverage Segment to Witness Significant Growth.
7. Are there any restraints impacting market growth?
Various Regulations Pertaining to Plastic Usage.
8. Can you provide examples of recent developments in the market?
April 2023 - Greiner Packaging, Engel, and Brink have jointly developed a thin-walled cup of rPET that can be produced using injection molding technology and claims to reduce CO2 equivalent CO2e emissions.
9. What pricing options are available for accessing the report?
Pricing options include single-user, multi-user, and enterprise licenses priced at USD 4750, USD 5250, and USD 8750 respectively.
10. Is the market size provided in terms of value or volume?
The market size is provided in terms of value, measured in Million.
11. Are there any specific market keywords associated with the report?
Yes, the market keyword associated with the report is "Cups and Lids Industry," which aids in identifying and referencing the specific market segment covered.
12. How do I determine which pricing option suits my needs best?
The pricing options vary based on user requirements and access needs. Individual users may opt for single-user licenses, while businesses requiring broader access may choose multi-user or enterprise licenses for cost-effective access to the report.
13. Are there any additional resources or data provided in the Cups and Lids Industry report?
While the report offers comprehensive insights, it's advisable to review the specific contents or supplementary materials provided to ascertain if additional resources or data are available.
14. How can I stay updated on further developments or reports in the Cups and Lids Industry?
To stay informed about further developments, trends, and reports in the Cups and Lids Industry, consider subscribing to industry newsletters, following relevant companies and organizations, or regularly checking reputable industry news sources and publications.
Methodology
Step 1 - Identification of Relevant Samples Size from Population Database


Step 2 - Approaches for Defining Global Market Size (Value, Volume* & Price*)

Note*: In applicable scenarios
Step 3 - Data Sources
Primary Research
- Web Analytics
- Survey Reports
- Research Institute
- Latest Research Reports
- Opinion Leaders
Secondary Research
- Annual Reports
- White Paper
- Latest Press Release
- Industry Association
- Paid Database
- Investor Presentations

Step 4 - Data Triangulation
Involves using different sources of information in order to increase the validity of a study
These sources are likely to be stakeholders in a program - participants, other researchers, program staff, other community members, and so on.
Then we put all data in single framework & apply various statistical tools to find out the dynamic on the market.
During the analysis stage, feedback from the stakeholder groups would be compared to determine areas of agreement as well as areas of divergence