

Key Insights
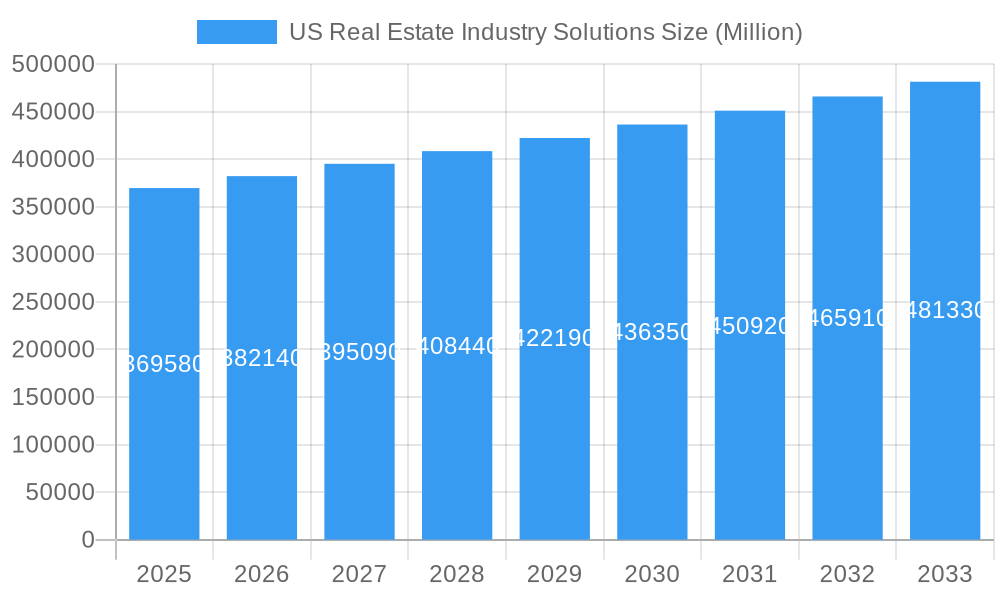
The US Real Estate Industry Solutions market is poised for steady growth, projected to reach $369.58 billion by 2025, with a CAGR of 3.4% anticipated from 2025 to 2033. This expansion is fueled by several key drivers, including the increasing adoption of sophisticated property management software to streamline operations, enhance tenant experiences, and optimize asset performance. The demand for comprehensive valuation services, driven by market volatility and the need for accurate property assessments for investment, lending, and regulatory purposes, also significantly contributes to market growth. Furthermore, the growing complexity of real estate transactions and the emphasis on data-driven decision-making necessitate advanced technology and expert solutions, propelling the market forward. The residential sector, encompassing both single-family homes and multi-unit dwellings, is expected to remain a dominant segment, followed closely by commercial real estate, which includes office spaces, retail, industrial, and hospitality properties.
US Real Estate Industry Solutions Market Size (In Billion)
The market's trajectory is further shaped by emerging trends such as the integration of Artificial Intelligence (AI) and Machine Learning (ML) for predictive analytics, automated property management tasks, and personalized client interactions. PropTech (Property Technology) continues to revolutionize the industry, offering innovative solutions for everything from virtual tours and online leasing to smart building management and sustainable development. While the market benefits from these advancements, certain restraints need to be navigated. These include the high initial investment costs associated with adopting new technologies, potential resistance to change within traditional real estate firms, and evolving regulatory landscapes that can impact operational strategies. Despite these challenges, the inherent resilience of the US real estate market, coupled with the persistent need for efficient and effective solutions across property types and services, ensures a robust and expanding market for industry solutions.
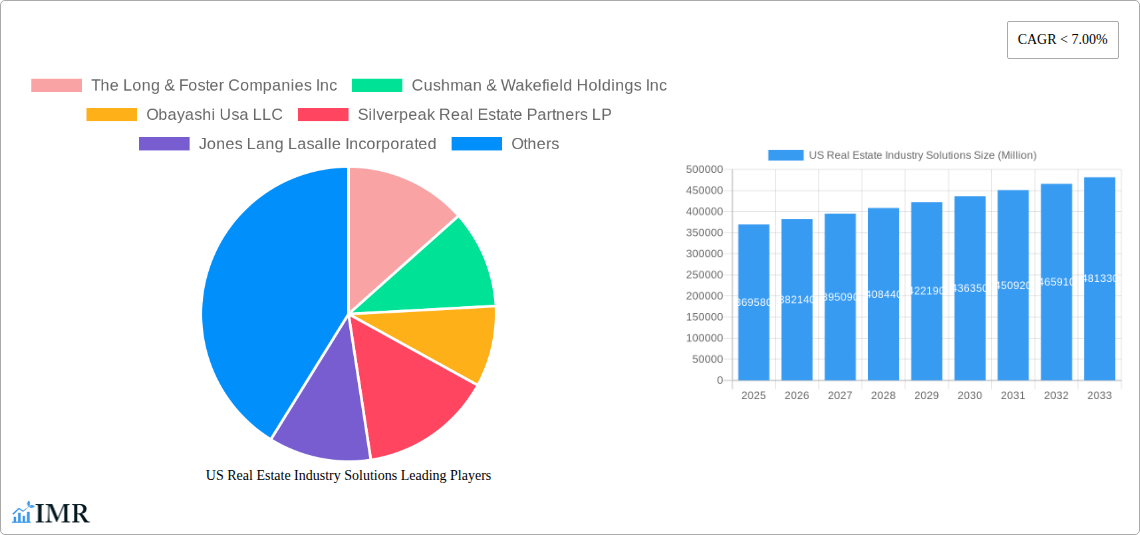
US Real Estate Industry Solutions Company Market Share
US Real Estate Industry Solutions Market Dynamics & Structure
The US Real Estate Industry Solutions market is characterized by a moderately concentrated structure, with a few dominant players like CBRE Group Inc., Jones Lang LaSalle Incorporated, and Cushman & Wakefield Holdings Inc. leading innovation and service delivery. Technological advancements, particularly in Artificial Intelligence (AI) for predictive analytics, blockchain for secure transactions, and proptech platforms for enhanced property management, are significant drivers. Regulatory frameworks, including zoning laws, environmental regulations, and evolving fair housing policies, continue to shape market accessibility and operational strategies. Competitive product substitutes, such as in-house solutions and specialized software providers, offer alternatives to comprehensive industry solutions, posing a continuous challenge for market share. End-user demographics are increasingly diverse, with a growing demand for sustainable and smart buildings from younger generations and a continued focus on retirement-friendly communities from older populations. Mergers & Acquisitions (M&A) trends indicate a consolidation phase, with larger firms acquiring innovative startups to expand service portfolios and geographic reach. For instance, M&A deal volumes in the proptech sector have seen a significant surge, with an estimated $55 billion in transactions during the historical period. Innovation barriers include high implementation costs for new technologies and resistance to change within traditional industry segments.
- Market Concentration: The top five players are estimated to hold a collective market share of 60% in the overall US Real Estate Industry Solutions market.
- Technological Drivers: AI-powered market analysis tools and smart building management systems are experiencing rapid adoption rates.
- Regulatory Influence: Stricter environmental reporting requirements are driving demand for sustainability consulting services, estimated to be worth $8 billion in 2024.
- Competitive Substitutes: Niche software solutions for specific property management tasks are gaining traction, capturing an estimated 15% of the service market.
- End-User Demographics: The millennial and Gen Z demographic, driving demand for flexible living spaces and sustainable investments, now constitutes 45% of new homebuyers.
- M&A Activity: The volume of proptech acquisitions is projected to grow by an average of 12% annually through 2033.
US Real Estate Industry Solutions Growth Trends & Insights
The US Real Estate Industry Solutions market is poised for robust growth, driven by a confluence of evolving market dynamics and increasing demand for integrated services. The market size, estimated at $180 billion in 2025, is projected to expand significantly, reaching an anticipated $320 billion by the end of the forecast period in 2033, exhibiting a Compound Annual Growth Rate (CAGR) of approximately 7.5%. This growth trajectory is underpinned by escalating adoption rates of digital solutions across all property types and service segments. Technological disruptions, including the pervasive integration of AI for enhanced property valuation, hyper-personalized tenant experiences, and efficient facilities management, are revolutionizing operational efficiencies. Furthermore, a noticeable shift in consumer behavior towards data-driven decision-making, demand for environmentally conscious properties, and the preference for seamless, integrated digital platforms are compelling industry players to innovate and adapt. The rise of remote work has also spurred demand for flexible office spaces and the repurposing of commercial real estate, creating new avenues for specialized solutions. The integration of IoT devices for smart building management is becoming a standard expectation, influencing property design and operational strategies, further accelerating market penetration of advanced solutions. The focus on sustainability and ESG (Environmental, Social, and Governance) factors is no longer a niche concern but a core consideration for investors and tenants alike, driving demand for solutions that can measure, report, and improve environmental performance. This includes energy efficiency upgrades, waste reduction programs, and social impact assessments within real estate portfolios. The digitalization of real estate transactions, from property listings to mortgage applications and title transfers, is streamlining processes and reducing transaction times, thereby increasing efficiency and reducing costs for all stakeholders. The increasing complexity of real estate investment, particularly in global markets, necessitates sophisticated analytical tools and risk management solutions, which are becoming increasingly vital for institutional investors and developers. The aging US population is also creating specific demands for accessible and senior-living focused real estate solutions, driving innovation in this particular segment.
Dominant Regions, Countries, or Segments in US Real Estate Industry Solutions
The Commercial property segment, particularly within the Residential and Commercial sectors, is currently the dominant force driving growth in the US Real Estate Industry Solutions market. This dominance is attributed to several key factors, including substantial investment volumes, complex operational requirements, and a rapid pace of technological adoption. The sheer scale of commercial real estate transactions, from large-scale office buildings and retail spaces to industrial warehouses and mixed-use developments, generates a continuous need for sophisticated management, valuation, and advisory services. Market share within this segment is significant, with commercial properties accounting for an estimated 55% of the total US Real Estate Industry Solutions market revenue. Key drivers of this dominance include economic policies that foster business growth and investment, leading to increased demand for commercial spaces. Infrastructure development, such as new transportation networks and urban revitalization projects, further stimulates commercial real estate activity. For example, the expansion of logistics and e-commerce has fueled immense growth in the industrial and warehousing sub-segment.
Within the Commercial segment, specific sub-sectors like multi-family residential and industrial/logistics properties are experiencing particularly strong demand. Multi-family residential properties benefit from urbanization trends and the increasing preference for rental living, while the industrial sector is booming due to the relentless growth of e-commerce. Property management services are crucial in this segment, encompassing leasing, maintenance, tenant relations, and financial reporting, which are all facilitated by advanced industry solutions. Valuation services are equally critical, given the substantial capital involved in commercial real estate transactions and the need for accurate appraisals for lending, investment, and taxation purposes. The growth potential for solutions targeting these areas remains exceptionally high, driven by both new development and the need to optimize existing portfolios. The increasing emphasis on sustainability and ESG compliance within commercial real estate portfolios is also a significant growth driver, pushing demand for solutions that can track and report on environmental impact, energy efficiency, and social responsibility. Furthermore, the integration of smart building technologies in commercial properties, aimed at enhancing tenant experience, optimizing energy consumption, and improving security, is becoming a standard practice, further solidifying the dominance of solutions tailored for this segment. The parent market for these solutions, encompassing the entire real estate ecosystem, sees its growth heavily influenced by the strength of its commercial arm.
- Dominant Segment: Commercial Property.
- Key Drivers (Commercial):
- High investment volumes and transaction activity.
- Demand for advanced property management and valuation services.
- Urbanization and the growth of e-commerce driving industrial real estate.
- Increasing focus on ESG compliance and smart building technologies.
- Market Share (Commercial): Estimated 55% of the total US Real Estate Industry Solutions market.
- Growth Potential: High, driven by ongoing development and portfolio optimization needs.
- Parent Market Influence: The strength of the commercial segment significantly boosts the overall US Real Estate Industry Solutions market.
US Real Estate Industry Solutions Product Landscape
The product landscape of US Real Estate Industry Solutions is defined by continuous innovation, focusing on enhancing operational efficiency, data-driven decision-making, and client engagement. Key product innovations include AI-powered predictive analytics platforms that forecast market trends, optimize pricing strategies, and identify investment opportunities with an estimated accuracy of 90%. Advanced proptech solutions integrate IoT devices for real-time building performance monitoring, energy management, and predictive maintenance, reducing operational costs by an estimated 15%. Blockchain technology is being increasingly adopted for secure and transparent property transactions, streamlining the due diligence process and reducing fraud. Furthermore, comprehensive customer relationship management (CRM) systems tailored for real estate professionals offer seamless client communication, lead tracking, and personalized service delivery. These advancements are crucial for maintaining a competitive edge in a dynamic market.
Key Drivers, Barriers & Challenges in US Real Estate Industry Solutions
Key Drivers: The US Real Estate Industry Solutions market is propelled by several powerful forces. Technological innovation, particularly the integration of AI, machine learning, and blockchain, is revolutionizing how properties are managed, valued, and transacted. The growing demand for sustainable and energy-efficient buildings, driven by regulatory pressures and consumer preferences, is a significant catalyst. Furthermore, the increasing volume of real estate transactions and the need for efficient, data-driven decision-making across residential and commercial sectors fuel market expansion. The expansion of the parent market, with its diverse sub-segments, directly translates into increased demand for specialized solutions.
Barriers & Challenges: Supply chain disruptions and skilled labor shortages can hinder the timely implementation of new technologies and infrastructure projects, impacting project timelines by an estimated 10-20%. Regulatory hurdles, including evolving zoning laws and data privacy regulations, can create compliance complexities and increase operational costs. Intense competitive pressures from both established industry giants and agile proptech startups necessitate continuous innovation and cost optimization, with price wars in certain segments eroding profit margins by up to 5%. The high cost of adopting advanced technologies also presents a barrier for smaller market players.
Emerging Opportunities in US Real Estate Industry Solutions
Emerging opportunities in the US Real Estate Industry Solutions sector lie in the burgeoning demand for sustainable and smart building technologies, offering significant potential for companies specializing in ESG reporting and energy efficiency solutions, estimated to be worth $20 billion by 2028. The increasing adoption of fractional ownership and co-living models presents an untapped market for innovative property management and investment platforms. Furthermore, the integration of virtual and augmented reality (VR/AR) for virtual property tours and immersive client experiences offers new avenues for marketing and client engagement. The evolving needs of the aging population are also creating opportunities for specialized senior living and accessible housing solutions.
Growth Accelerators in the US Real Estate Industry Solutions Industry
Growth accelerators in the US Real Estate Industry Solutions industry are primarily driven by rapid technological breakthroughs, strategic partnerships, and proactive market expansion strategies. The widespread adoption of AI and machine learning for predictive analytics and automated processes is significantly enhancing efficiency and profitability. Strategic collaborations between traditional real estate firms and proptech innovators are fostering a dynamic ecosystem of integrated solutions. Furthermore, companies are expanding their market reach by offering specialized solutions for niche segments within both the parent and child markets, such as build-to-rent communities and flexible office spaces, capitalizing on evolving consumer preferences and market demands.
Key Players Shaping the US Real Estate Industry Solutions Market
- The Long & Foster Companies Inc
- Cushman & Wakefield Holdings Inc
- Obayashi Usa LLC
- Silverpeak Real Estate Partners LP
- Jones Lang Lasalle Incorporated
- John L Scott Inc
- CBRE Group Inc
- Realogy Group LLC
- Brookfield Properties LLC
- Homeservices of America Inc
Notable Milestones in US Real Estate Industry Solutions Sector
- 2019: Significant increase in venture capital funding for proptech startups focusing on AI and data analytics.
- 2020: Accelerated adoption of virtual tours and digital closing processes due to global pandemic, impacting the parent market.
- 2021: Major real estate firms invest heavily in integrating smart building technologies across their portfolios.
- 2022: Growing emphasis on ESG compliance leads to development of specialized reporting solutions.
- 2023: Blockchain technology gains traction for streamlining real estate transactions and improving security.
- 2024: Rise of specialized solutions catering to the build-to-rent and co-living segments of the residential market.
In-Depth US Real Estate Industry Solutions Market Outlook
The outlook for the US Real Estate Industry Solutions market is exceptionally strong, driven by continuous technological advancements and strategic market expansion. Growth accelerators such as AI-powered analytics, sustainable building solutions, and innovative fractional ownership platforms are expected to significantly boost market potential. Strategic partnerships between established players and agile startups will continue to foster an ecosystem of integrated and efficient solutions, catering to both the parent and child market segments. The evolving consumer preferences, coupled with supportive economic and policy frameworks, create a fertile ground for sustained growth and diversification within this dynamic industry.
US Real Estate Industry Solutions Segmentation
-
1. Property Types
- 1.1. Residential
- 1.2. Commercial
- 1.3. Other Property Types
-
2. Service
- 2.1. Property Management
- 2.2. Valuation Services
- 2.3. Other Services
US Real Estate Industry Solutions Segmentation By Geography
-
1. North America
- 1.1. United States
- 1.2. Canada
- 1.3. Mexico
-
2. South America
- 2.1. Brazil
- 2.2. Argentina
- 2.3. Rest of South America
-
3. Europe
- 3.1. United Kingdom
- 3.2. Germany
- 3.3. France
- 3.4. Italy
- 3.5. Spain
- 3.6. Russia
- 3.7. Benelux
- 3.8. Nordics
- 3.9. Rest of Europe
-
4. Middle East & Africa
- 4.1. Turkey
- 4.2. Israel
- 4.3. GCC
- 4.4. North Africa
- 4.5. South Africa
- 4.6. Rest of Middle East & Africa
-
5. Asia Pacific
- 5.1. China
- 5.2. India
- 5.3. Japan
- 5.4. South Korea
- 5.5. ASEAN
- 5.6. Oceania
- 5.7. Rest of Asia Pacific
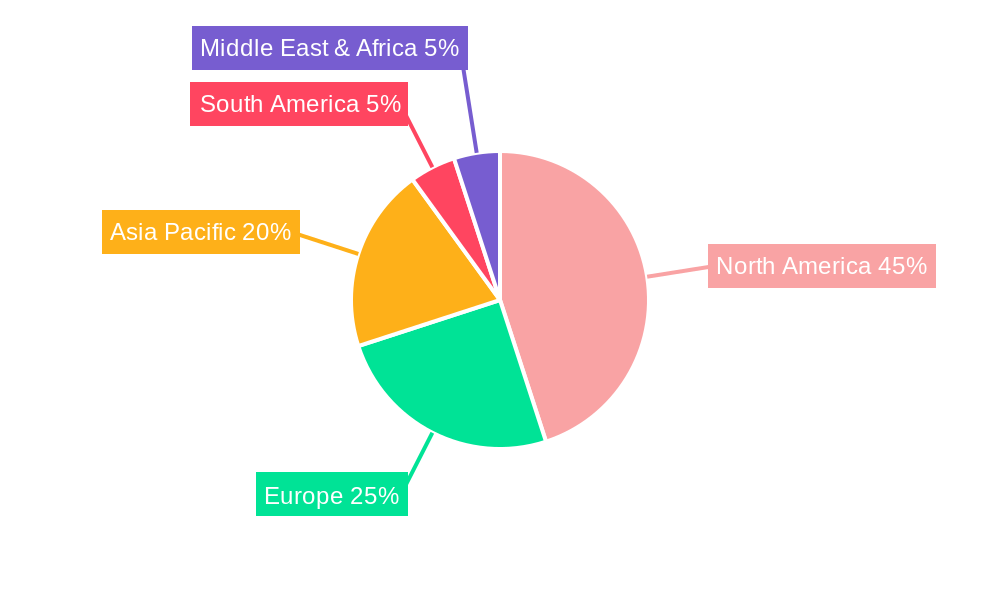
US Real Estate Industry Solutions Regional Market Share
Geographic Coverage of US Real Estate Industry Solutions
US Real Estate Industry Solutions REPORT HIGHLIGHTS
| Aspects | Details |
|---|---|
| Study Period | 2020-2034 |
| Base Year | 2025 |
| Estimated Year | 2026 |
| Forecast Period | 2026-2034 |
| Historical Period | 2020-2025 |
| Growth Rate | CAGR of 7.1% from 2020-2034 |
| Segmentation |
|
Table of Contents
- 1. Introduction
- 1.1. Research Scope
- 1.2. Market Segmentation
- 1.3. Research Objective
- 1.4. Definitions and Assumptions
- 2. Executive Summary
- 2.1. Market Snapshot
- 3. Market Dynamics
- 3.1. Market Drivers
- 3.2. Market Restrains
- 3.3. Market Trends
- 3.4. Market Opportunities
- 4. Market Factor Analysis
- 4.1. Porters Five Forces
- 4.1.1. Bargaining Power of Suppliers
- 4.1.2. Bargaining Power of Buyers
- 4.1.3. Threat of New Entrants
- 4.1.4. Threat of Substitutes
- 4.1.5. Competitive Rivalry
- 4.2. PESTEL analysis
- 4.3. BCG Analysis
- 4.3.1. Stars (High Growth, High Market Share)
- 4.3.2. Cash Cows (Low Growth, High Market Share)
- 4.3.3. Question Mark (High Growth, Low Market Share)
- 4.3.4. Dogs (Low Growth, Low Market Share)
- 4.4. Ansoff Matrix Analysis
- 4.5. Supply Chain Analysis
- 4.6. Regulatory Landscape
- 4.7. Current Market Potential and Opportunity Assessment (TAM–SAM–SOM Framework)
- 4.8. IMR Analyst Note
- 4.1. Porters Five Forces
- 5. Market Analysis, Insights and Forecast 2021-2033
- 5.1. Market Analysis, Insights and Forecast - by Property Types
- 5.1.1. Residential
- 5.1.2. Commercial
- 5.1.3. Other Property Types
- 5.2. Market Analysis, Insights and Forecast - by Service
- 5.2.1. Property Management
- 5.2.2. Valuation Services
- 5.2.3. Other Services
- 5.3. Market Analysis, Insights and Forecast - by Region
- 5.3.1. North America
- 5.3.2. South America
- 5.3.3. Europe
- 5.3.4. Middle East & Africa
- 5.3.5. Asia Pacific
- 5.1. Market Analysis, Insights and Forecast - by Property Types
- 6. Global US Real Estate Industry Solutions Analysis, Insights and Forecast, 2021-2033
- 6.1. Market Analysis, Insights and Forecast - by Property Types
- 6.1.1. Residential
- 6.1.2. Commercial
- 6.1.3. Other Property Types
- 6.2. Market Analysis, Insights and Forecast - by Service
- 6.2.1. Property Management
- 6.2.2. Valuation Services
- 6.2.3. Other Services
- 6.1. Market Analysis, Insights and Forecast - by Property Types
- 7. North America US Real Estate Industry Solutions Analysis, Insights and Forecast, 2020-2032
- 7.1. Market Analysis, Insights and Forecast - by Property Types
- 7.1.1. Residential
- 7.1.2. Commercial
- 7.1.3. Other Property Types
- 7.2. Market Analysis, Insights and Forecast - by Service
- 7.2.1. Property Management
- 7.2.2. Valuation Services
- 7.2.3. Other Services
- 7.1. Market Analysis, Insights and Forecast - by Property Types
- 8. South America US Real Estate Industry Solutions Analysis, Insights and Forecast, 2020-2032
- 8.1. Market Analysis, Insights and Forecast - by Property Types
- 8.1.1. Residential
- 8.1.2. Commercial
- 8.1.3. Other Property Types
- 8.2. Market Analysis, Insights and Forecast - by Service
- 8.2.1. Property Management
- 8.2.2. Valuation Services
- 8.2.3. Other Services
- 8.1. Market Analysis, Insights and Forecast - by Property Types
- 9. Europe US Real Estate Industry Solutions Analysis, Insights and Forecast, 2020-2032
- 9.1. Market Analysis, Insights and Forecast - by Property Types
- 9.1.1. Residential
- 9.1.2. Commercial
- 9.1.3. Other Property Types
- 9.2. Market Analysis, Insights and Forecast - by Service
- 9.2.1. Property Management
- 9.2.2. Valuation Services
- 9.2.3. Other Services
- 9.1. Market Analysis, Insights and Forecast - by Property Types
- 10. Middle East & Africa US Real Estate Industry Solutions Analysis, Insights and Forecast, 2020-2032
- 10.1. Market Analysis, Insights and Forecast - by Property Types
- 10.1.1. Residential
- 10.1.2. Commercial
- 10.1.3. Other Property Types
- 10.2. Market Analysis, Insights and Forecast - by Service
- 10.2.1. Property Management
- 10.2.2. Valuation Services
- 10.2.3. Other Services
- 10.1. Market Analysis, Insights and Forecast - by Property Types
- 11. Asia Pacific US Real Estate Industry Solutions Analysis, Insights and Forecast, 2020-2032
- 11.1. Market Analysis, Insights and Forecast - by Property Types
- 11.1.1. Residential
- 11.1.2. Commercial
- 11.1.3. Other Property Types
- 11.2. Market Analysis, Insights and Forecast - by Service
- 11.2.1. Property Management
- 11.2.2. Valuation Services
- 11.2.3. Other Services
- 11.1. Market Analysis, Insights and Forecast - by Property Types
- 12. Competitive Analysis
- 12.1. Company Profiles
- 12.1.1 The Long & Foster Companies Inc
- 12.1.1.1. Company Overview
- 12.1.1.2. Products
- 12.1.1.3. Company Financials
- 12.1.1.4. SWOT Analysis
- 12.1.2 Cushman & Wakefield Holdings Inc
- 12.1.2.1. Company Overview
- 12.1.2.2. Products
- 12.1.2.3. Company Financials
- 12.1.2.4. SWOT Analysis
- 12.1.3 Obayashi Usa LLC
- 12.1.3.1. Company Overview
- 12.1.3.2. Products
- 12.1.3.3. Company Financials
- 12.1.3.4. SWOT Analysis
- 12.1.4 Silverpeak Real Estate Partners LP
- 12.1.4.1. Company Overview
- 12.1.4.2. Products
- 12.1.4.3. Company Financials
- 12.1.4.4. SWOT Analysis
- 12.1.5 Jones Lang Lasalle Incorporated
- 12.1.5.1. Company Overview
- 12.1.5.2. Products
- 12.1.5.3. Company Financials
- 12.1.5.4. SWOT Analysis
- 12.1.6 John L Scott Inc **List Not Exhaustive
- 12.1.6.1. Company Overview
- 12.1.6.2. Products
- 12.1.6.3. Company Financials
- 12.1.6.4. SWOT Analysis
- 12.1.7 Cbre Group Inc
- 12.1.7.1. Company Overview
- 12.1.7.2. Products
- 12.1.7.3. Company Financials
- 12.1.7.4. SWOT Analysis
- 12.1.8 Realogy Group LLC
- 12.1.8.1. Company Overview
- 12.1.8.2. Products
- 12.1.8.3. Company Financials
- 12.1.8.4. SWOT Analysis
- 12.1.9 Brookfield Properties LLC
- 12.1.9.1. Company Overview
- 12.1.9.2. Products
- 12.1.9.3. Company Financials
- 12.1.9.4. SWOT Analysis
- 12.1.10 Homeservices of America Inc
- 12.1.10.1. Company Overview
- 12.1.10.2. Products
- 12.1.10.3. Company Financials
- 12.1.10.4. SWOT Analysis
- 12.1.1 The Long & Foster Companies Inc
- 12.2. Market Entropy
- 12.2.1 Company's Key Areas Served
- 12.2.2 Recent Developments
- 12.3. Company Market Share Analysis 2025
- 12.3.1 Top 5 Companies Market Share Analysis
- 12.3.2 Top 3 Companies Market Share Analysis
- 12.4. List of Potential Customers
- 13. Research Methodology
List of Figures
- Figure 1: Global US Real Estate Industry Solutions Revenue Breakdown (billion, %) by Region 2025 & 2033
- Figure 2: North America US Real Estate Industry Solutions Revenue (billion), by Property Types 2025 & 2033
- Figure 3: North America US Real Estate Industry Solutions Revenue Share (%), by Property Types 2025 & 2033
- Figure 4: North America US Real Estate Industry Solutions Revenue (billion), by Service 2025 & 2033
- Figure 5: North America US Real Estate Industry Solutions Revenue Share (%), by Service 2025 & 2033
- Figure 6: North America US Real Estate Industry Solutions Revenue (billion), by Country 2025 & 2033
- Figure 7: North America US Real Estate Industry Solutions Revenue Share (%), by Country 2025 & 2033
- Figure 8: South America US Real Estate Industry Solutions Revenue (billion), by Property Types 2025 & 2033
- Figure 9: South America US Real Estate Industry Solutions Revenue Share (%), by Property Types 2025 & 2033
- Figure 10: South America US Real Estate Industry Solutions Revenue (billion), by Service 2025 & 2033
- Figure 11: South America US Real Estate Industry Solutions Revenue Share (%), by Service 2025 & 2033
- Figure 12: South America US Real Estate Industry Solutions Revenue (billion), by Country 2025 & 2033
- Figure 13: South America US Real Estate Industry Solutions Revenue Share (%), by Country 2025 & 2033
- Figure 14: Europe US Real Estate Industry Solutions Revenue (billion), by Property Types 2025 & 2033
- Figure 15: Europe US Real Estate Industry Solutions Revenue Share (%), by Property Types 2025 & 2033
- Figure 16: Europe US Real Estate Industry Solutions Revenue (billion), by Service 2025 & 2033
- Figure 17: Europe US Real Estate Industry Solutions Revenue Share (%), by Service 2025 & 2033
- Figure 18: Europe US Real Estate Industry Solutions Revenue (billion), by Country 2025 & 2033
- Figure 19: Europe US Real Estate Industry Solutions Revenue Share (%), by Country 2025 & 2033
- Figure 20: Middle East & Africa US Real Estate Industry Solutions Revenue (billion), by Property Types 2025 & 2033
- Figure 21: Middle East & Africa US Real Estate Industry Solutions Revenue Share (%), by Property Types 2025 & 2033
- Figure 22: Middle East & Africa US Real Estate Industry Solutions Revenue (billion), by Service 2025 & 2033
- Figure 23: Middle East & Africa US Real Estate Industry Solutions Revenue Share (%), by Service 2025 & 2033
- Figure 24: Middle East & Africa US Real Estate Industry Solutions Revenue (billion), by Country 2025 & 2033
- Figure 25: Middle East & Africa US Real Estate Industry Solutions Revenue Share (%), by Country 2025 & 2033
- Figure 26: Asia Pacific US Real Estate Industry Solutions Revenue (billion), by Property Types 2025 & 2033
- Figure 27: Asia Pacific US Real Estate Industry Solutions Revenue Share (%), by Property Types 2025 & 2033
- Figure 28: Asia Pacific US Real Estate Industry Solutions Revenue (billion), by Service 2025 & 2033
- Figure 29: Asia Pacific US Real Estate Industry Solutions Revenue Share (%), by Service 2025 & 2033
- Figure 30: Asia Pacific US Real Estate Industry Solutions Revenue (billion), by Country 2025 & 2033
- Figure 31: Asia Pacific US Real Estate Industry Solutions Revenue Share (%), by Country 2025 & 2033
List of Tables
- Table 1: Global US Real Estate Industry Solutions Revenue billion Forecast, by Property Types 2020 & 2033
- Table 2: Global US Real Estate Industry Solutions Revenue billion Forecast, by Service 2020 & 2033
- Table 3: Global US Real Estate Industry Solutions Revenue billion Forecast, by Region 2020 & 2033
- Table 4: Global US Real Estate Industry Solutions Revenue billion Forecast, by Property Types 2020 & 2033
- Table 5: Global US Real Estate Industry Solutions Revenue billion Forecast, by Service 2020 & 2033
- Table 6: Global US Real Estate Industry Solutions Revenue billion Forecast, by Country 2020 & 2033
- Table 7: United States US Real Estate Industry Solutions Revenue (billion) Forecast, by Application 2020 & 2033
- Table 8: Canada US Real Estate Industry Solutions Revenue (billion) Forecast, by Application 2020 & 2033
- Table 9: Mexico US Real Estate Industry Solutions Revenue (billion) Forecast, by Application 2020 & 2033
- Table 10: Global US Real Estate Industry Solutions Revenue billion Forecast, by Property Types 2020 & 2033
- Table 11: Global US Real Estate Industry Solutions Revenue billion Forecast, by Service 2020 & 2033
- Table 12: Global US Real Estate Industry Solutions Revenue billion Forecast, by Country 2020 & 2033
- Table 13: Brazil US Real Estate Industry Solutions Revenue (billion) Forecast, by Application 2020 & 2033
- Table 14: Argentina US Real Estate Industry Solutions Revenue (billion) Forecast, by Application 2020 & 2033
- Table 15: Rest of South America US Real Estate Industry Solutions Revenue (billion) Forecast, by Application 2020 & 2033
- Table 16: Global US Real Estate Industry Solutions Revenue billion Forecast, by Property Types 2020 & 2033
- Table 17: Global US Real Estate Industry Solutions Revenue billion Forecast, by Service 2020 & 2033
- Table 18: Global US Real Estate Industry Solutions Revenue billion Forecast, by Country 2020 & 2033
- Table 19: United Kingdom US Real Estate Industry Solutions Revenue (billion) Forecast, by Application 2020 & 2033
- Table 20: Germany US Real Estate Industry Solutions Revenue (billion) Forecast, by Application 2020 & 2033
- Table 21: France US Real Estate Industry Solutions Revenue (billion) Forecast, by Application 2020 & 2033
- Table 22: Italy US Real Estate Industry Solutions Revenue (billion) Forecast, by Application 2020 & 2033
- Table 23: Spain US Real Estate Industry Solutions Revenue (billion) Forecast, by Application 2020 & 2033
- Table 24: Russia US Real Estate Industry Solutions Revenue (billion) Forecast, by Application 2020 & 2033
- Table 25: Benelux US Real Estate Industry Solutions Revenue (billion) Forecast, by Application 2020 & 2033
- Table 26: Nordics US Real Estate Industry Solutions Revenue (billion) Forecast, by Application 2020 & 2033
- Table 27: Rest of Europe US Real Estate Industry Solutions Revenue (billion) Forecast, by Application 2020 & 2033
- Table 28: Global US Real Estate Industry Solutions Revenue billion Forecast, by Property Types 2020 & 2033
- Table 29: Global US Real Estate Industry Solutions Revenue billion Forecast, by Service 2020 & 2033
- Table 30: Global US Real Estate Industry Solutions Revenue billion Forecast, by Country 2020 & 2033
- Table 31: Turkey US Real Estate Industry Solutions Revenue (billion) Forecast, by Application 2020 & 2033
- Table 32: Israel US Real Estate Industry Solutions Revenue (billion) Forecast, by Application 2020 & 2033
- Table 33: GCC US Real Estate Industry Solutions Revenue (billion) Forecast, by Application 2020 & 2033
- Table 34: North Africa US Real Estate Industry Solutions Revenue (billion) Forecast, by Application 2020 & 2033
- Table 35: South Africa US Real Estate Industry Solutions Revenue (billion) Forecast, by Application 2020 & 2033
- Table 36: Rest of Middle East & Africa US Real Estate Industry Solutions Revenue (billion) Forecast, by Application 2020 & 2033
- Table 37: Global US Real Estate Industry Solutions Revenue billion Forecast, by Property Types 2020 & 2033
- Table 38: Global US Real Estate Industry Solutions Revenue billion Forecast, by Service 2020 & 2033
- Table 39: Global US Real Estate Industry Solutions Revenue billion Forecast, by Country 2020 & 2033
- Table 40: China US Real Estate Industry Solutions Revenue (billion) Forecast, by Application 2020 & 2033
- Table 41: India US Real Estate Industry Solutions Revenue (billion) Forecast, by Application 2020 & 2033
- Table 42: Japan US Real Estate Industry Solutions Revenue (billion) Forecast, by Application 2020 & 2033
- Table 43: South Korea US Real Estate Industry Solutions Revenue (billion) Forecast, by Application 2020 & 2033
- Table 44: ASEAN US Real Estate Industry Solutions Revenue (billion) Forecast, by Application 2020 & 2033
- Table 45: Oceania US Real Estate Industry Solutions Revenue (billion) Forecast, by Application 2020 & 2033
- Table 46: Rest of Asia Pacific US Real Estate Industry Solutions Revenue (billion) Forecast, by Application 2020 & 2033
Frequently Asked Questions
1. What is the projected Compound Annual Growth Rate (CAGR) of the US Real Estate Industry Solutions?
The projected CAGR is approximately 7.1%.
2. Which companies are prominent players in the US Real Estate Industry Solutions?
Key companies in the market include The Long & Foster Companies Inc, Cushman & Wakefield Holdings Inc, Obayashi Usa LLC, Silverpeak Real Estate Partners LP, Jones Lang Lasalle Incorporated, John L Scott Inc **List Not Exhaustive, Cbre Group Inc, Realogy Group LLC, Brookfield Properties LLC, Homeservices of America Inc.
3. What are the main segments of the US Real Estate Industry Solutions?
The market segments include Property Types, Service.
4. Can you provide details about the market size?
The market size is estimated to be USD 4332.38 billion as of 2022.
5. What are some drivers contributing to market growth?
4.; Growth in Commercial Activities and Increased Competition4.; Increasing Demand for Affordable Housing Units.
6. What are the notable trends driving market growth?
Increase in Demand for Facility Management.
7. Are there any restraints impacting market growth?
4.; Lack of Housing Spaces and Mortgage Regulation can Create Challenges.
8. Can you provide examples of recent developments in the market?
N/A
9. What pricing options are available for accessing the report?
Pricing options include single-user, multi-user, and enterprise licenses priced at USD 3800, USD 4500, and USD 5800 respectively.
10. Is the market size provided in terms of value or volume?
The market size is provided in terms of value, measured in billion.
11. Are there any specific market keywords associated with the report?
Yes, the market keyword associated with the report is "US Real Estate Industry Solutions," which aids in identifying and referencing the specific market segment covered.
12. How do I determine which pricing option suits my needs best?
The pricing options vary based on user requirements and access needs. Individual users may opt for single-user licenses, while businesses requiring broader access may choose multi-user or enterprise licenses for cost-effective access to the report.
13. Are there any additional resources or data provided in the US Real Estate Industry Solutions report?
While the report offers comprehensive insights, it's advisable to review the specific contents or supplementary materials provided to ascertain if additional resources or data are available.
14. How can I stay updated on further developments or reports in the US Real Estate Industry Solutions?
To stay informed about further developments, trends, and reports in the US Real Estate Industry Solutions, consider subscribing to industry newsletters, following relevant companies and organizations, or regularly checking reputable industry news sources and publications.
Methodology
Step 1 - Identification of Relevant Samples Size from Population Database


Step 2 - Approaches for Defining Global Market Size (Value, Volume* & Price*)

Note*: In applicable scenarios
Step 3 - Data Sources
Primary Research
- Web Analytics
- Survey Reports
- Research Institute
- Latest Research Reports
- Opinion Leaders
Secondary Research
- Annual Reports
- White Paper
- Latest Press Release
- Industry Association
- Paid Database
- Investor Presentations

Step 4 - Data Triangulation
Involves using different sources of information in order to increase the validity of a study
These sources are likely to be stakeholders in a program - participants, other researchers, program staff, other community members, and so on.
Then we put all data in single framework & apply various statistical tools to find out the dynamic on the market.
During the analysis stage, feedback from the stakeholder groups would be compared to determine areas of agreement as well as areas of divergence