

Key Insights
The Norway Transportation Infrastructure Construction market is experiencing robust growth, driven by significant government investments in upgrading and expanding its transportation networks. A CAGR exceeding 4% from 2019 to 2033 indicates a healthy and expanding market, fueled by increasing urbanization, rising tourism, and the need to improve connectivity across the country. Key drivers include the modernization of existing road and rail infrastructure, ambitious projects to enhance port and airport capacities, and a growing focus on sustainable transportation solutions. The market is segmented geographically, with Oslo, Stavanger, and Bergen representing major hubs for construction activity. Different modes of transportation, including roadways, railways, airports, ports, and inland waterways, contribute to the overall market size. Leading players such as WSP, Webuild, NCC, Ramboll Group, AF Gruppen, ACCIONA, Bane NOR, and Skanska are actively engaged in these projects, shaping the competitive landscape. While specific market size figures are unavailable, considering a CAGR of >4% and a typical market size for similar developed nations, a reasonable estimate for the 2025 market value could be in the range of $10-15 billion USD, given the country's size and economic strength. Future growth will likely be influenced by factors like government policy changes, technological advancements in construction methods, and the overall economic performance of Norway.
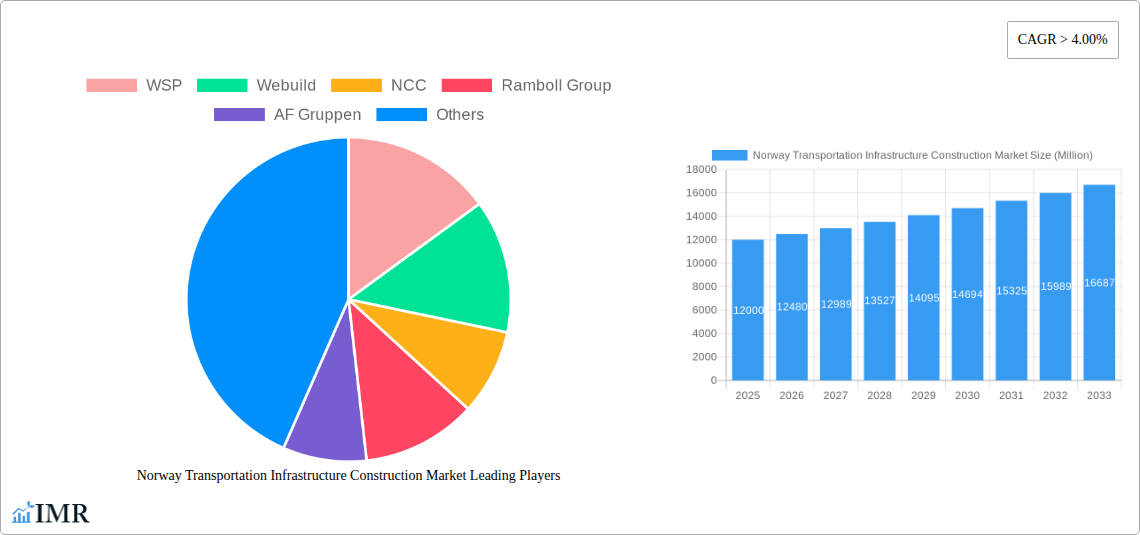
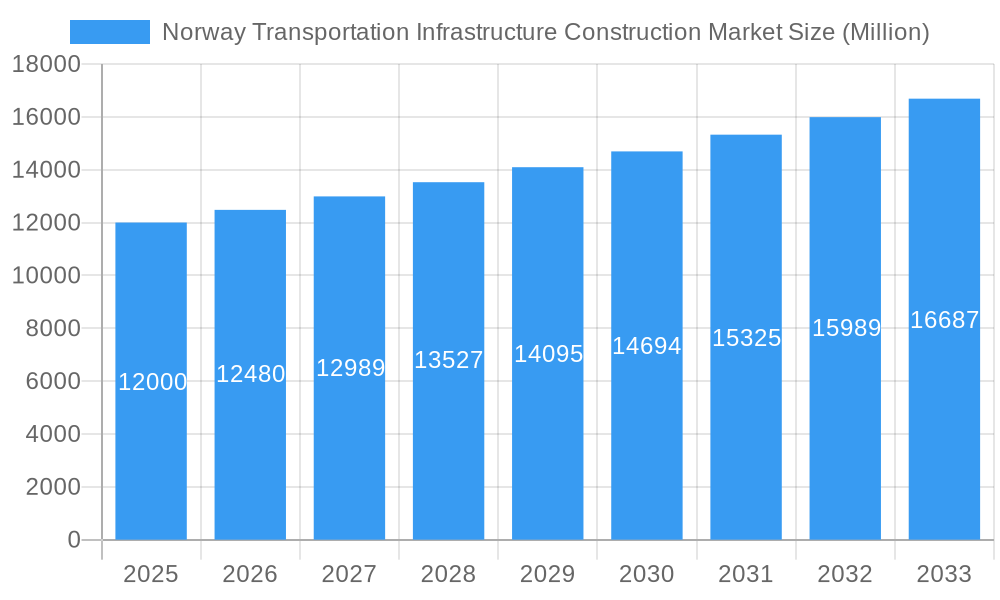
Norway Transportation Infrastructure Construction Market Market Size (In Billion)
The market’s segmentation provides opportunities for specialized firms to focus their efforts. Roadway construction remains a significant portion of the market, owing to the need for maintenance, expansion and improvements across the country's road network. Railway upgrades are another key driver, with projects focused on improving efficiency and capacity. The expansion of airports and ports in Norway, necessary to accommodate growing passenger and cargo traffic, is creating substantial demand for construction services. Challenges include securing funding for large-scale projects, managing environmental impact assessments, and navigating the complexities of Norwegian regulations. Despite these hurdles, the long-term outlook for the Norway Transportation Infrastructure Construction market remains positive, driven by sustained government support and a commitment to improving the country’s infrastructure.
Norway Transportation Infrastructure Construction Market Company Market Share
This comprehensive report provides an in-depth analysis of the Norway transportation infrastructure construction market, offering valuable insights for industry professionals, investors, and policymakers. The study covers the period from 2019 to 2033, with a base year of 2025 and a forecast period from 2025 to 2033. The market is segmented by key cities (Oslo, Stavanger, Bergen) and mode of transportation (roadways, railways, airports, ports, and inland waterways). The report features detailed analysis of market dynamics, growth trends, dominant segments, key players, and emerging opportunities. The market size is presented in million units.
Norway Transportation Infrastructure Construction Market Dynamics & Structure
The Norwegian transportation infrastructure construction market exhibits a moderately concentrated structure, with several large multinational and domestic players holding significant market share. The market is characterized by a high level of technological innovation, driven by the government's commitment to sustainable and efficient transportation systems. Stringent environmental regulations and safety standards shape the competitive landscape, influencing material selection and construction techniques. Competitive product substitutes are limited, with the focus mainly on enhancing the efficiency and durability of existing infrastructure. The market also witnesses a significant level of mergers and acquisitions (M&A) activity, particularly amongst larger firms seeking expansion and diversification.
- Market Concentration: The top 5 players hold approximately xx% of the market share in 2025 (estimated).
- Technological Innovation: Focus on sustainable materials (e.g., recycled concrete, bio-based asphalt), digitalization (e.g., BIM, IoT sensors), and automation in construction.
- Regulatory Framework: Strict environmental regulations, safety standards, and procurement processes significantly impact project timelines and costs.
- M&A Activity: An average of xx M&A deals per year were recorded between 2019 and 2024, with a projected increase to xx deals annually during the forecast period.
- End-User Demographics: The market is driven by increasing urbanization, rising population, and the government's focus on improving connectivity and reducing congestion.
- Innovation Barriers: High initial investment costs for new technologies and a lack of skilled labor can hinder innovation adoption.
Norway Transportation Infrastructure Construction Market Growth Trends & Insights
The Norwegian transportation infrastructure construction market experienced a Compound Annual Growth Rate (CAGR) of xx% during the historical period (2019-2024). This growth is projected to continue at a CAGR of xx% during the forecast period (2025-2033), driven by sustained government investments in infrastructure development, increasing tourism, and the expansion of logistics networks. Technological advancements, particularly in digitalization and sustainable materials, are expected to further accelerate market growth. Shifts in consumer behavior, including increased preference for public transportation and sustainable travel options, are also influencing market dynamics. Market penetration of sustainable construction materials is expected to increase from xx% in 2025 to xx% by 2033. The market size in 2025 is estimated at 6000 Million units, and is projected to reach 11000 Million units by 2033.
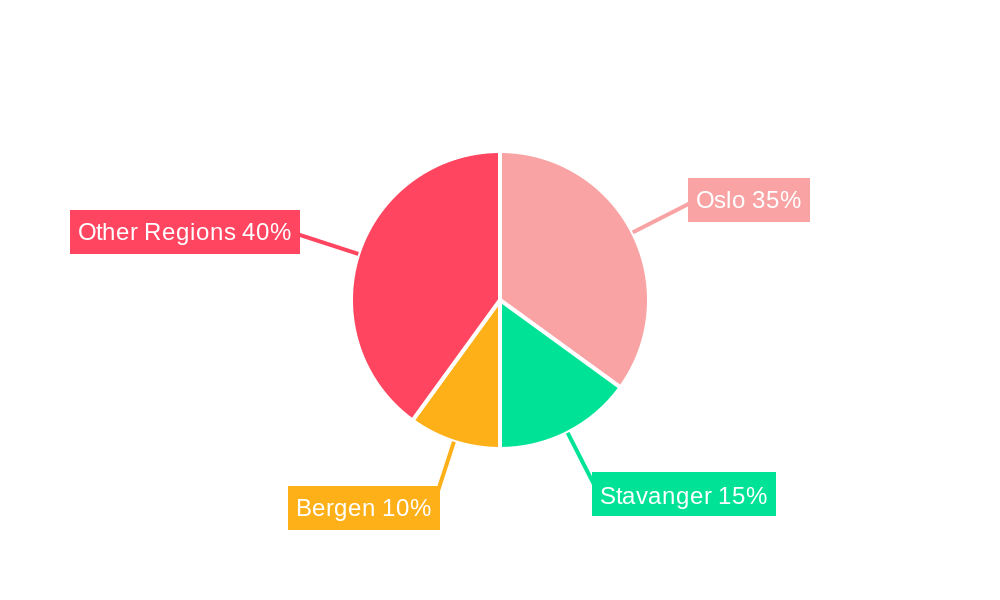
Dominant Regions, Countries, or Segments in Norway Transportation Infrastructure Construction Market
Oslo remains the dominant region, accounting for xx% of the total market share in 2025, followed by Stavanger (xx%) and Bergen (xx%). This dominance is driven by higher population density, economic activity, and a concentration of large-scale infrastructure projects. Roadways constitute the largest segment by mode, holding xx% of the market share, due to extensive road networks and continuous maintenance requirements. The railways segment is also experiencing substantial growth, driven by government initiatives to enhance rail connectivity across the country.
- Key Drivers (Oslo): High population density, significant economic activity, government investment in urban infrastructure projects.
- Key Drivers (Roadways): Extensive road networks, continuous maintenance and upgrading needs, increasing traffic volume.
- Key Drivers (Railways): Government investments in high-speed rail and regional connectivity projects, increasing passenger and freight transport demands.
Norway Transportation Infrastructure Construction Market Product Landscape
The market offers a wide range of products and services, including construction of roadways, railways, airports, ports, and inland waterways. Recent innovations include the use of sustainable construction materials, advanced construction technologies (BIM, 3D printing), and smart infrastructure solutions. These innovations offer improved performance, enhanced durability, reduced environmental impact, and increased efficiency. Unique selling propositions include faster construction times, reduced costs, and improved infrastructure resilience.
Key Drivers, Barriers & Challenges in Norway Transportation Infrastructure Construction Market
Key Drivers: Government investments in infrastructure development, rising population and urbanization, need for improved connectivity, and increasing tourism. The government's commitment to sustainable transportation is also a major driver.
Challenges: High labor costs, stringent environmental regulations, potential supply chain disruptions, and competition from international contractors can pose challenges. The fluctuating price of construction materials also impacts project profitability.
Emerging Opportunities in Norway Transportation Infrastructure Construction Market
Opportunities exist in sustainable infrastructure development, the adoption of advanced technologies (e.g., BIM, IoT sensors), and the development of smart city solutions. The expanding tourism sector creates further opportunities for improving airport and port infrastructure. Untapped markets include the modernization of existing infrastructure and the development of specialized transportation systems (e.g., light rail).
Growth Accelerators in the Norway Transportation Infrastructure Construction Market Industry
Long-term growth will be driven by continued government investment in infrastructure projects, advancements in construction technologies, and the increasing adoption of sustainable practices. Strategic partnerships between public and private sectors will play a crucial role in fostering innovation and efficient project delivery. Expanding into new markets and diversification of services will also contribute to growth.
Key Players Shaping the Norway Transportation Infrastructure Construction Market Market
- WSP
- Webuild
- NCC
- Ramboll Group
- AF Gruppen
- ACCIONA
- Bane NOR
- Iterina
- FCC Construccion
- Veidekke
- Skanska
- Implenia AG
Notable Milestones in Norway Transportation Infrastructure Construction Market Sector
- 2021: Launch of the national plan for sustainable transportation infrastructure.
- 2022: Completion of the Follo Line, a new high-speed railway line connecting Oslo Airport to Oslo Central Station.
- 2023: Initiation of major port expansion projects in several key cities. (Specific examples would require further research).
In-Depth Norway Transportation Infrastructure Construction Market Market Outlook
The Norwegian transportation infrastructure construction market holds significant potential for growth over the next decade. Continued government support for infrastructure development, coupled with technological advancements and a focus on sustainability, will drive market expansion. Strategic partnerships, innovation in construction methodologies, and the successful implementation of large-scale projects will be crucial factors determining the market's future trajectory. The market is poised for substantial growth, offering significant opportunities for both domestic and international players.
Norway Transportation Infrastructure Construction Market Segmentation
-
1. Mode
- 1.1. Roadways
- 1.2. Railways
- 1.3. Airports
- 1.4. Ports and Inland Waterways
-
2. Key Cities
- 2.1. Oslo
- 2.2. Stavanger
- 2.3. Bergen
Norway Transportation Infrastructure Construction Market Segmentation By Geography
- 1. Norway
Norway Transportation Infrastructure Construction Market Regional Market Share
Geographic Coverage of Norway Transportation Infrastructure Construction Market
Norway Transportation Infrastructure Construction Market REPORT HIGHLIGHTS
| Aspects | Details |
|---|---|
| Study Period | 2020-2034 |
| Base Year | 2025 |
| Estimated Year | 2026 |
| Forecast Period | 2026-2034 |
| Historical Period | 2020-2025 |
| Growth Rate | CAGR of > 4.00% from 2020-2034 |
| Segmentation |
|
Table of Contents
- 1. Introduction
- 1.1. Research Scope
- 1.2. Market Segmentation
- 1.3. Research Objective
- 1.4. Definitions and Assumptions
- 2. Executive Summary
- 2.1. Market Snapshot
- 3. Market Dynamics
- 3.1. Market Drivers
- 3.2. Market Restrains
- 3.3. Market Trends
- 3.4. Market Opportunities
- 4. Market Factor Analysis
- 4.1. Porters Five Forces
- 4.1.1. Bargaining Power of Suppliers
- 4.1.2. Bargaining Power of Buyers
- 4.1.3. Threat of New Entrants
- 4.1.4. Threat of Substitutes
- 4.1.5. Competitive Rivalry
- 4.2. PESTEL analysis
- 4.3. BCG Analysis
- 4.3.1. Stars (High Growth, High Market Share)
- 4.3.2. Cash Cows (Low Growth, High Market Share)
- 4.3.3. Question Mark (High Growth, Low Market Share)
- 4.3.4. Dogs (Low Growth, Low Market Share)
- 4.4. Ansoff Matrix Analysis
- 4.5. Supply Chain Analysis
- 4.6. Regulatory Landscape
- 4.7. Current Market Potential and Opportunity Assessment (TAM–SAM–SOM Framework)
- 4.8. IMR Analyst Note
- 4.1. Porters Five Forces
- 5. Market Analysis, Insights and Forecast 2021-2033
- 5.1. Market Analysis, Insights and Forecast - by Mode
- 5.1.1. Roadways
- 5.1.2. Railways
- 5.1.3. Airports
- 5.1.4. Ports and Inland Waterways
- 5.2. Market Analysis, Insights and Forecast - by Key Cities
- 5.2.1. Oslo
- 5.2.2. Stavanger
- 5.2.3. Bergen
- 5.3. Market Analysis, Insights and Forecast - by Region
- 5.3.1. Norway
- 5.1. Market Analysis, Insights and Forecast - by Mode
- 6. Norway Transportation Infrastructure Construction Market Analysis, Insights and Forecast, 2021-2033
- 6.1. Market Analysis, Insights and Forecast - by Mode
- 6.1.1. Roadways
- 6.1.2. Railways
- 6.1.3. Airports
- 6.1.4. Ports and Inland Waterways
- 6.2. Market Analysis, Insights and Forecast - by Key Cities
- 6.2.1. Oslo
- 6.2.2. Stavanger
- 6.2.3. Bergen
- 6.1. Market Analysis, Insights and Forecast - by Mode
- 7. Competitive Analysis
- 7.1. Company Profiles
- 7.1.1 WSP
- 7.1.1.1. Company Overview
- 7.1.1.2. Products
- 7.1.1.3. Company Financials
- 7.1.1.4. SWOT Analysis
- 7.1.2 Webuild
- 7.1.2.1. Company Overview
- 7.1.2.2. Products
- 7.1.2.3. Company Financials
- 7.1.2.4. SWOT Analysis
- 7.1.3 NCC
- 7.1.3.1. Company Overview
- 7.1.3.2. Products
- 7.1.3.3. Company Financials
- 7.1.3.4. SWOT Analysis
- 7.1.4 Ramboll Group
- 7.1.4.1. Company Overview
- 7.1.4.2. Products
- 7.1.4.3. Company Financials
- 7.1.4.4. SWOT Analysis
- 7.1.5 AF Gruppen
- 7.1.5.1. Company Overview
- 7.1.5.2. Products
- 7.1.5.3. Company Financials
- 7.1.5.4. SWOT Analysis
- 7.1.6 ACCIONA
- 7.1.6.1. Company Overview
- 7.1.6.2. Products
- 7.1.6.3. Company Financials
- 7.1.6.4. SWOT Analysis
- 7.1.7 Bane NOR
- 7.1.7.1. Company Overview
- 7.1.7.2. Products
- 7.1.7.3. Company Financials
- 7.1.7.4. SWOT Analysis
- 7.1.8 Iterina**List Not Exhaustive
- 7.1.8.1. Company Overview
- 7.1.8.2. Products
- 7.1.8.3. Company Financials
- 7.1.8.4. SWOT Analysis
- 7.1.9 FCC Construccion
- 7.1.9.1. Company Overview
- 7.1.9.2. Products
- 7.1.9.3. Company Financials
- 7.1.9.4. SWOT Analysis
- 7.1.10 Veidekke
- 7.1.10.1. Company Overview
- 7.1.10.2. Products
- 7.1.10.3. Company Financials
- 7.1.10.4. SWOT Analysis
- 7.1.11 Skanska
- 7.1.11.1. Company Overview
- 7.1.11.2. Products
- 7.1.11.3. Company Financials
- 7.1.11.4. SWOT Analysis
- 7.1.12 Implenia AG
- 7.1.12.1. Company Overview
- 7.1.12.2. Products
- 7.1.12.3. Company Financials
- 7.1.12.4. SWOT Analysis
- 7.1.1 WSP
- 7.2. Market Entropy
- 7.2.1 Company's Key Areas Served
- 7.2.2 Recent Developments
- 7.3. Company Market Share Analysis 2025
- 7.3.1 Top 5 Companies Market Share Analysis
- 7.3.2 Top 3 Companies Market Share Analysis
- 7.4. List of Potential Customers
- 8. Research Methodology
List of Figures
- Figure 1: Norway Transportation Infrastructure Construction Market Revenue Breakdown (Million, %) by Product 2025 & 2033
- Figure 2: Norway Transportation Infrastructure Construction Market Share (%) by Company 2025
List of Tables
- Table 1: Norway Transportation Infrastructure Construction Market Revenue Million Forecast, by Mode 2020 & 2033
- Table 2: Norway Transportation Infrastructure Construction Market Revenue Million Forecast, by Key Cities 2020 & 2033
- Table 3: Norway Transportation Infrastructure Construction Market Revenue Million Forecast, by Region 2020 & 2033
- Table 4: Norway Transportation Infrastructure Construction Market Revenue Million Forecast, by Mode 2020 & 2033
- Table 5: Norway Transportation Infrastructure Construction Market Revenue Million Forecast, by Key Cities 2020 & 2033
- Table 6: Norway Transportation Infrastructure Construction Market Revenue Million Forecast, by Country 2020 & 2033
Frequently Asked Questions
1. What is the projected Compound Annual Growth Rate (CAGR) of the Norway Transportation Infrastructure Construction Market?
The projected CAGR is approximately > 4.00%.
2. Which companies are prominent players in the Norway Transportation Infrastructure Construction Market?
Key companies in the market include WSP, Webuild, NCC, Ramboll Group, AF Gruppen, ACCIONA, Bane NOR, Iterina**List Not Exhaustive, FCC Construccion, Veidekke, Skanska, Implenia AG.
3. What are the main segments of the Norway Transportation Infrastructure Construction Market?
The market segments include Mode, Key Cities.
4. Can you provide details about the market size?
The market size is estimated to be USD XX Million as of 2022.
5. What are some drivers contributing to market growth?
Increasing Adoption of Remote and Hybrid Work Model.
6. What are the notable trends driving market growth?
Increasing Construction of Large-Scale Projects.
7. Are there any restraints impacting market growth?
Lack of Privacy.
8. Can you provide examples of recent developments in the market?
N/A
9. What pricing options are available for accessing the report?
Pricing options include single-user, multi-user, and enterprise licenses priced at USD 3800, USD 4500, and USD 5800 respectively.
10. Is the market size provided in terms of value or volume?
The market size is provided in terms of value, measured in Million.
11. Are there any specific market keywords associated with the report?
Yes, the market keyword associated with the report is "Norway Transportation Infrastructure Construction Market," which aids in identifying and referencing the specific market segment covered.
12. How do I determine which pricing option suits my needs best?
The pricing options vary based on user requirements and access needs. Individual users may opt for single-user licenses, while businesses requiring broader access may choose multi-user or enterprise licenses for cost-effective access to the report.
13. Are there any additional resources or data provided in the Norway Transportation Infrastructure Construction Market report?
While the report offers comprehensive insights, it's advisable to review the specific contents or supplementary materials provided to ascertain if additional resources or data are available.
14. How can I stay updated on further developments or reports in the Norway Transportation Infrastructure Construction Market?
To stay informed about further developments, trends, and reports in the Norway Transportation Infrastructure Construction Market, consider subscribing to industry newsletters, following relevant companies and organizations, or regularly checking reputable industry news sources and publications.
Methodology
Step 1 - Identification of Relevant Samples Size from Population Database


Step 2 - Approaches for Defining Global Market Size (Value, Volume* & Price*)

Note*: In applicable scenarios
Step 3 - Data Sources
Primary Research
- Web Analytics
- Survey Reports
- Research Institute
- Latest Research Reports
- Opinion Leaders
Secondary Research
- Annual Reports
- White Paper
- Latest Press Release
- Industry Association
- Paid Database
- Investor Presentations

Step 4 - Data Triangulation
Involves using different sources of information in order to increase the validity of a study
These sources are likely to be stakeholders in a program - participants, other researchers, program staff, other community members, and so on.
Then we put all data in single framework & apply various statistical tools to find out the dynamic on the market.
During the analysis stage, feedback from the stakeholder groups would be compared to determine areas of agreement as well as areas of divergence