

Key Insights
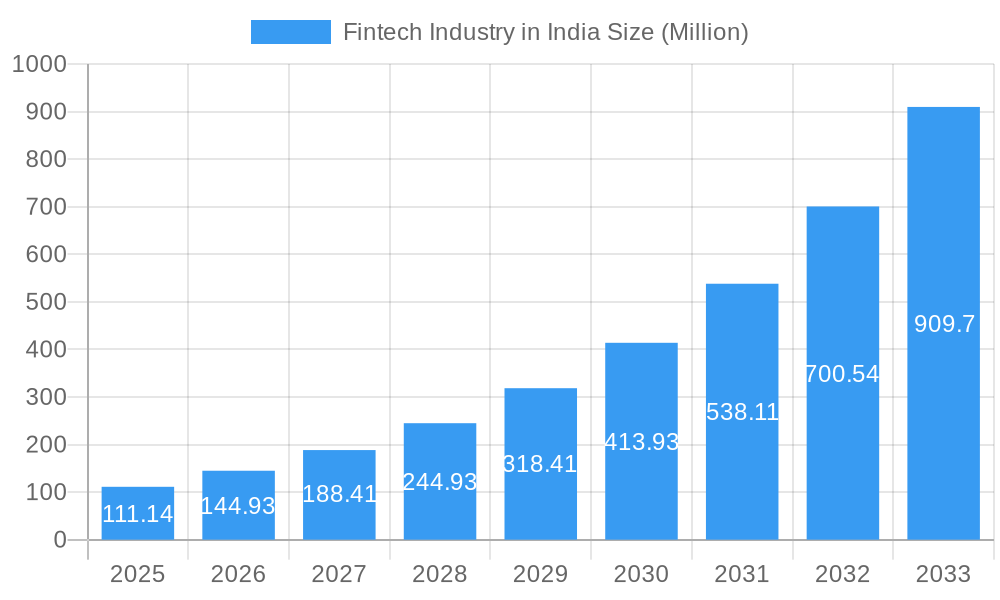
The Indian Fintech market, valued at $111.14 million in 2025, is experiencing explosive growth, projected to expand significantly over the forecast period (2025-2033) with a Compound Annual Growth Rate (CAGR) of 30.55%. This rapid expansion is fueled by several key drivers. Increased smartphone penetration and internet access have democratized financial services, allowing millions of previously unbanked individuals to access digital payment systems, lending platforms, and investment tools. Government initiatives promoting digitalization and financial inclusion, such as the push for digital transactions and UPI adoption, have further accelerated market growth. The burgeoning startup ecosystem in India has fostered innovation, leading to the development of diverse and user-friendly Fintech solutions catering to a wide range of needs. Furthermore, evolving consumer preferences towards convenient and seamless digital experiences continue to drive adoption.
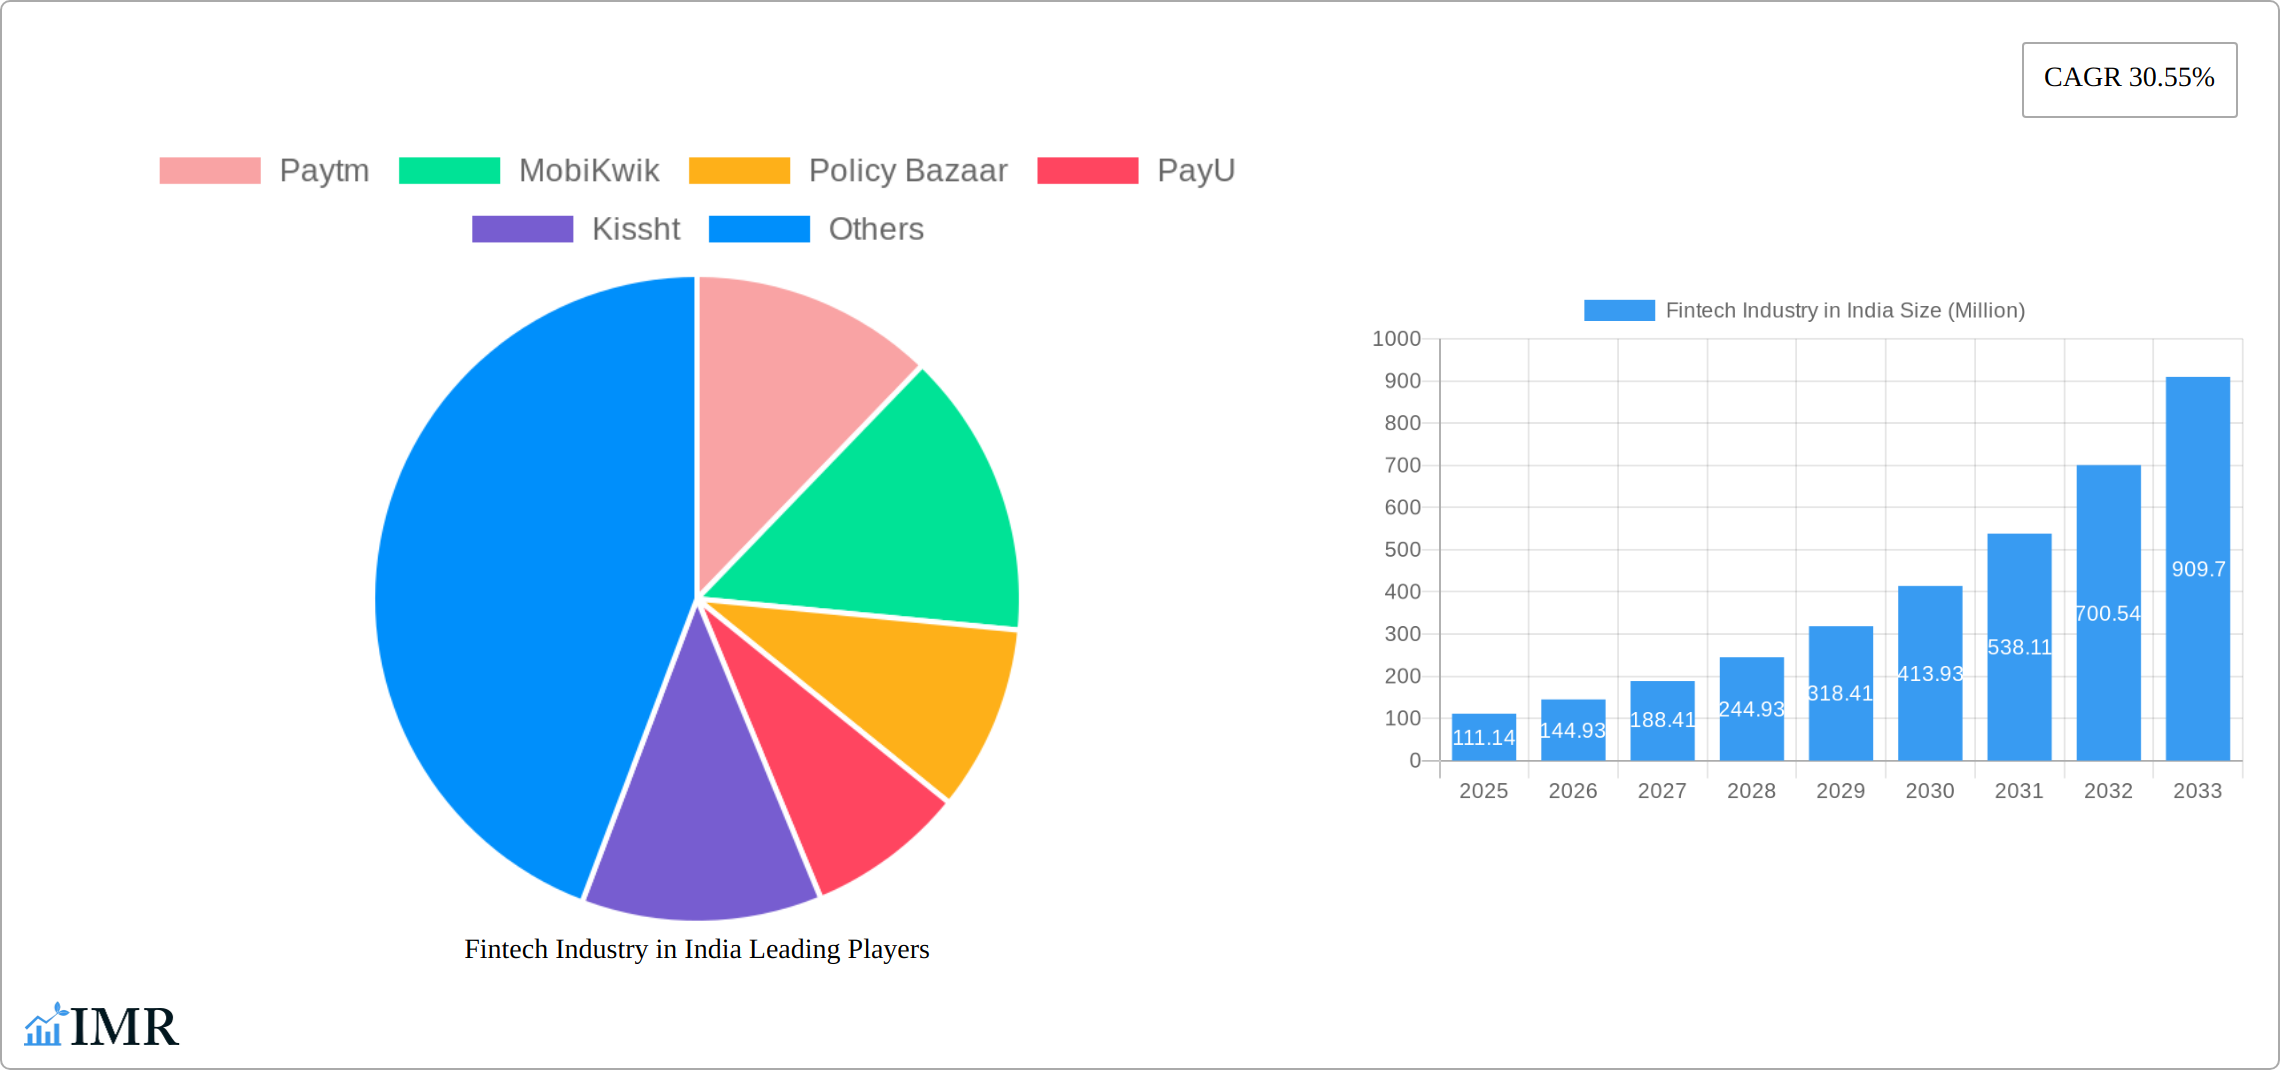
Fintech Industry in India Market Size (In Million)
However, challenges remain. While the market presents immense potential, regulatory hurdles, cybersecurity concerns, and the need for financial literacy among the population pose restraints on its growth. The competitive landscape is intense, with established players like Paytm, PhonePe, and PolicyBazaar competing alongside newer entrants and specialized platforms. To maintain its trajectory, the industry must focus on enhancing security measures, promoting financial inclusion through targeted educational programs, and navigating the evolving regulatory framework. Segmentation within the market is diverse, encompassing digital payments, lending, insurance technology (Insurtech), wealth management, and more. The ongoing evolution of these segments will shape the future trajectory of the Indian Fintech industry, promising continued high growth and significant disruption within the financial services sector. Data suggests a strong potential for sustained expansion over the next decade.
Fintech Industry in India Company Market Share
Fintech Industry in India: Market Dynamics, Growth, and Future Outlook (2019-2033)
This comprehensive report provides an in-depth analysis of the burgeoning Fintech industry in India, encompassing market dynamics, growth trends, key players, and future prospects. With a study period spanning 2019-2033, a base year of 2025, and an estimated and forecast period of 2025-2033, this report is an invaluable resource for industry professionals, investors, and policymakers seeking to understand and capitalize on this rapidly evolving sector. The historical period covered is 2019-2024. The Indian Fintech market, segmented into payments, lending, and investment, is expected to reach XX Million by 2033.
Fintech Industry in India Market Dynamics & Structure
The Indian Fintech market is characterized by intense competition, rapid technological advancements, and a dynamic regulatory landscape. Market concentration is relatively high, with a few dominant players capturing significant market share. However, numerous smaller players and startups are continually emerging, creating a vibrant and competitive ecosystem. Technological innovation, particularly in areas like AI, blockchain, and mobile payments, is a key driver of growth. The regulatory framework, while evolving, plays a crucial role in shaping market dynamics. M&A activity is significant, reflecting the industry's consolidation and expansion trends.
- Market Concentration: Top 5 players hold approximately 60% market share (Estimated 2025).
- Technological Innovation: AI-powered lending, blockchain-based security, and open banking are key areas of innovation.
- Regulatory Framework: RBI guidelines and data privacy regulations significantly impact operations.
- Competitive Product Substitutes: Traditional banking services pose some competition, but Fintech offers convenience and accessibility.
- End-User Demographics: Primarily driven by the young, tech-savvy population in urban and semi-urban areas. Significant growth potential in rural areas.
- M&A Trends: A rising number of acquisitions and mergers signal consolidation and expansion (XX deals in 2024).
Fintech Industry in India Growth Trends & Insights
The Indian Fintech market has witnessed a monumental surge in recent years, propelled by a confluence of factors including widespread smartphone adoption, escalating internet accessibility, and a burgeoning demographic of young, digitally proficient individuals. The market has expanded exponentially from an estimated **XX Million in 2019 to a projected XX Million in 2024**, showcasing a robust Compound Annual Growth Rate (CAGR) of **XX%**. This upward trajectory is anticipated to persist, with projections indicating the market could reach an impressive **XX Million by 2033**. The uptake of Fintech services is accelerating rapidly, particularly within pivotal segments like mobile payments and digital lending. Transformative technological advancements, notably the revolutionary UPI (Unified Payments Interface) and other seamless mobile payment ecosystems, have profoundly reshaped consumer behavior. This has cultivated a pronounced preference for digital financial solutions over conventional methods, with consumers actively seeking out intuitive mobile applications, unparalleled convenience, and fortified security features.
Dominant Regions, Countries, or Segments in Fintech Industry in India
India's major metropolitan hubs, including Mumbai, Delhi, Bengaluru, and Hyderabad, stand as the primary engines driving the Fintech market's expansion. These urban centers benefit from superior smartphone penetration, widespread internet connectivity, and a concentrated population of tech-savvy individuals. While urban areas lead, the vast and largely untapped rural landscape represents a significant frontier for future growth over the coming decade. Currently, the payments segment reigns supreme as both the largest and most rapidly expanding sector, closely followed by the lending and investment categories.
- Key Growth Catalysts:
- Ubiquitous smartphone and internet access.
- Proactive government initiatives fostering digital financial inclusion.
- Accelerated adoption of digital payment methods.
- An increasingly supportive and progressive regulatory framework.
- Factors Driving Dominance:
- A rich ecosystem of technical talent and burgeoning startups.
- Well-established infrastructure that underpins secure digital transactions.
- The presence of leading Fintech enterprises and influential investors.
- Higher disposable incomes and evolving consumer spending patterns.
Fintech Industry in India Product Landscape
The Indian Fintech arena boasts an expansive and dynamic spectrum of products and services. This includes an array of innovative offerings such as sophisticated mobile wallets, versatile digital payment platforms, efficient peer-to-peer lending solutions, intelligent robo-advisors, and cutting-edge insurance technology (Insurtech) services. These offerings are distinguished by their intuitive user interfaces, robust security architectures, and seamless integration capabilities across a multitude of platforms and devices. A key differentiator and a growing focus is the development of personalized financial management tools and AI-powered solutions designed to cater to individual user needs.
Key Drivers, Barriers & Challenges in Fintech Industry in India
Key Drivers: The growth of the Indian Fintech industry is fueled by factors such as increasing smartphone penetration, rising internet usage, government initiatives promoting digital financial inclusion, and the expanding adoption of digital payments. Technological advancements such as AI and machine learning, coupled with favorable regulatory environments, are further accelerating growth.
Challenges: The industry faces challenges such as cybersecurity threats, data privacy concerns, regulatory complexities, and a lack of financial literacy among certain segments of the population. Competition is intense, and scalability challenges can impact growth for smaller firms. Supply chain disruption for technology related to Fintech could also negatively impact the industry. These issues could potentially decrease growth by XX% within the next 5 years if not addressed effectively.
Emerging Opportunities in Fintech Industry in India
The horizon of opportunities within India's Fintech sector is brimming with potential. Prominent emerging areas include the integration of embedded finance into non-financial platforms, the development of specialized Fintech solutions tailored to the needs of the underserved rural population, and the strategic application of blockchain technology to fortify security and enhance transparency in financial transactions. The escalating demand for highly personalized financial management tools and AI-driven insights presents a significant avenue for growth. Furthermore, the expansion into specialized and niche markets, such as agri-fintech (financial services for agriculture) and health-tech (financial services for healthcare), is forging novel pathways for innovation and market penetration.
Growth Accelerators in the Fintech Industry in India Industry
Long-term growth will be driven by continuous technological innovation, strategic partnerships between Fintech companies and traditional financial institutions, and the expansion of financial services into underserved markets. Government initiatives supporting digital financial inclusion and favorable regulatory changes will further accelerate growth.
Notable Milestones in Fintech Industry in India Sector
- September 2023: PayU partnered with WhatsApp to enhance the Indian purchasing experience.
- November 2022: CRED acquired CreditVidya, a Hyderabad-based SaaS business.
In-Depth Fintech Industry in India Market Outlook
The Indian Fintech market is firmly positioned for sustained and robust expansion. This optimistic outlook is underpinned by favorable demographic trends, continuous technological advancements, and a supportive policy landscape championed by the government. Success in this dynamic and evolving sector will hinge on cultivating strategic partnerships, extending reach into underserved and untapped markets, and consistently driving innovative product development. The inherent potential for disruption and groundbreaking innovation remains exceptionally high, promising substantial growth and a wealth of opportunities for both established industry leaders and agile new entrants alike.
Fintech Industry in India Segmentation
-
1. Service Proposition
- 1.1. Money Transfer and Payments
- 1.2. Savings and Investments
- 1.3. Digital Lending and Lending Marketplaces
- 1.4. Online Insurance and Insurance Marketplaces
-
2. Application
- 2.1. E-Commerce
- 2.2. Utilities
- 2.3. Travel
Fintech Industry in India Segmentation By Geography
-
1. North America
- 1.1. United States
- 1.2. Canada
- 1.3. Mexico
-
2. South America
- 2.1. Brazil
- 2.2. Argentina
- 2.3. Rest of South America
-
3. Europe
- 3.1. United Kingdom
- 3.2. Germany
- 3.3. France
- 3.4. Italy
- 3.5. Spain
- 3.6. Russia
- 3.7. Benelux
- 3.8. Nordics
- 3.9. Rest of Europe
-
4. Middle East & Africa
- 4.1. Turkey
- 4.2. Israel
- 4.3. GCC
- 4.4. North Africa
- 4.5. South Africa
- 4.6. Rest of Middle East & Africa
-
5. Asia Pacific
- 5.1. China
- 5.2. India
- 5.3. Japan
- 5.4. South Korea
- 5.5. ASEAN
- 5.6. Oceania
- 5.7. Rest of Asia Pacific
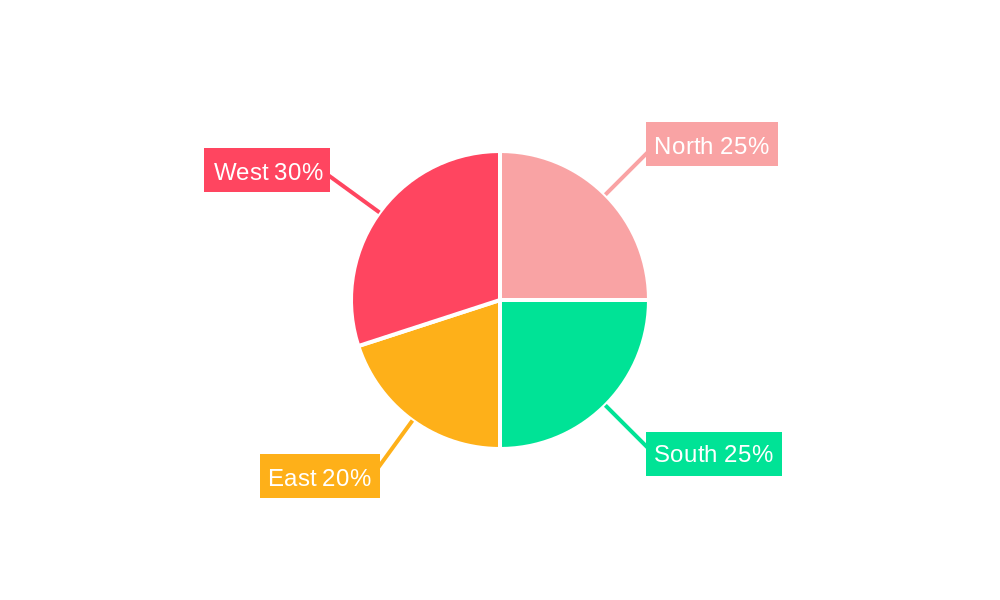
Fintech Industry in India Regional Market Share
Geographic Coverage of Fintech Industry in India
Fintech Industry in India REPORT HIGHLIGHTS
| Aspects | Details |
|---|---|
| Study Period | 2020-2034 |
| Base Year | 2025 |
| Estimated Year | 2026 |
| Forecast Period | 2026-2034 |
| Historical Period | 2020-2025 |
| Growth Rate | CAGR of 30.55% from 2020-2034 |
| Segmentation |
|
Table of Contents
- 1. Introduction
- 1.1. Research Scope
- 1.2. Market Segmentation
- 1.3. Research Objective
- 1.4. Definitions and Assumptions
- 2. Executive Summary
- 2.1. Market Snapshot
- 3. Market Dynamics
- 3.1. Market Drivers
- 3.2. Market Restrains
- 3.3. Market Trends
- 3.4. Market Opportunities
- 4. Market Factor Analysis
- 4.1. Porters Five Forces
- 4.1.1. Bargaining Power of Suppliers
- 4.1.2. Bargaining Power of Buyers
- 4.1.3. Threat of New Entrants
- 4.1.4. Threat of Substitutes
- 4.1.5. Competitive Rivalry
- 4.2. PESTEL analysis
- 4.3. BCG Analysis
- 4.3.1. Stars (High Growth, High Market Share)
- 4.3.2. Cash Cows (Low Growth, High Market Share)
- 4.3.3. Question Mark (High Growth, Low Market Share)
- 4.3.4. Dogs (Low Growth, Low Market Share)
- 4.4. Ansoff Matrix Analysis
- 4.5. Supply Chain Analysis
- 4.6. Regulatory Landscape
- 4.7. Current Market Potential and Opportunity Assessment (TAM–SAM–SOM Framework)
- 4.8. IMR Analyst Note
- 4.1. Porters Five Forces
- 5. Market Analysis, Insights and Forecast 2021-2033
- 5.1. Market Analysis, Insights and Forecast - by Service Proposition
- 5.1.1. Money Transfer and Payments
- 5.1.2. Savings and Investments
- 5.1.3. Digital Lending and Lending Marketplaces
- 5.1.4. Online Insurance and Insurance Marketplaces
- 5.2. Market Analysis, Insights and Forecast - by Application
- 5.2.1. E-Commerce
- 5.2.2. Utilities
- 5.2.3. Travel
- 5.3. Market Analysis, Insights and Forecast - by Region
- 5.3.1. North America
- 5.3.2. South America
- 5.3.3. Europe
- 5.3.4. Middle East & Africa
- 5.3.5. Asia Pacific
- 5.1. Market Analysis, Insights and Forecast - by Service Proposition
- 6. Global Fintech Industry in India Analysis, Insights and Forecast, 2021-2033
- 6.1. Market Analysis, Insights and Forecast - by Service Proposition
- 6.1.1. Money Transfer and Payments
- 6.1.2. Savings and Investments
- 6.1.3. Digital Lending and Lending Marketplaces
- 6.1.4. Online Insurance and Insurance Marketplaces
- 6.2. Market Analysis, Insights and Forecast - by Application
- 6.2.1. E-Commerce
- 6.2.2. Utilities
- 6.2.3. Travel
- 6.1. Market Analysis, Insights and Forecast - by Service Proposition
- 7. North America Fintech Industry in India Analysis, Insights and Forecast, 2020-2032
- 7.1. Market Analysis, Insights and Forecast - by Service Proposition
- 7.1.1. Money Transfer and Payments
- 7.1.2. Savings and Investments
- 7.1.3. Digital Lending and Lending Marketplaces
- 7.1.4. Online Insurance and Insurance Marketplaces
- 7.2. Market Analysis, Insights and Forecast - by Application
- 7.2.1. E-Commerce
- 7.2.2. Utilities
- 7.2.3. Travel
- 7.1. Market Analysis, Insights and Forecast - by Service Proposition
- 8. South America Fintech Industry in India Analysis, Insights and Forecast, 2020-2032
- 8.1. Market Analysis, Insights and Forecast - by Service Proposition
- 8.1.1. Money Transfer and Payments
- 8.1.2. Savings and Investments
- 8.1.3. Digital Lending and Lending Marketplaces
- 8.1.4. Online Insurance and Insurance Marketplaces
- 8.2. Market Analysis, Insights and Forecast - by Application
- 8.2.1. E-Commerce
- 8.2.2. Utilities
- 8.2.3. Travel
- 8.1. Market Analysis, Insights and Forecast - by Service Proposition
- 9. Europe Fintech Industry in India Analysis, Insights and Forecast, 2020-2032
- 9.1. Market Analysis, Insights and Forecast - by Service Proposition
- 9.1.1. Money Transfer and Payments
- 9.1.2. Savings and Investments
- 9.1.3. Digital Lending and Lending Marketplaces
- 9.1.4. Online Insurance and Insurance Marketplaces
- 9.2. Market Analysis, Insights and Forecast - by Application
- 9.2.1. E-Commerce
- 9.2.2. Utilities
- 9.2.3. Travel
- 9.1. Market Analysis, Insights and Forecast - by Service Proposition
- 10. Middle East & Africa Fintech Industry in India Analysis, Insights and Forecast, 2020-2032
- 10.1. Market Analysis, Insights and Forecast - by Service Proposition
- 10.1.1. Money Transfer and Payments
- 10.1.2. Savings and Investments
- 10.1.3. Digital Lending and Lending Marketplaces
- 10.1.4. Online Insurance and Insurance Marketplaces
- 10.2. Market Analysis, Insights and Forecast - by Application
- 10.2.1. E-Commerce
- 10.2.2. Utilities
- 10.2.3. Travel
- 10.1. Market Analysis, Insights and Forecast - by Service Proposition
- 11. Asia Pacific Fintech Industry in India Analysis, Insights and Forecast, 2020-2032
- 11.1. Market Analysis, Insights and Forecast - by Service Proposition
- 11.1.1. Money Transfer and Payments
- 11.1.2. Savings and Investments
- 11.1.3. Digital Lending and Lending Marketplaces
- 11.1.4. Online Insurance and Insurance Marketplaces
- 11.2. Market Analysis, Insights and Forecast - by Application
- 11.2.1. E-Commerce
- 11.2.2. Utilities
- 11.2.3. Travel
- 11.1. Market Analysis, Insights and Forecast - by Service Proposition
- 12. Competitive Analysis
- 12.1. Company Profiles
- 12.1.1 Paytm
- 12.1.1.1. Company Overview
- 12.1.1.2. Products
- 12.1.1.3. Company Financials
- 12.1.1.4. SWOT Analysis
- 12.1.2 MobiKwik
- 12.1.2.1. Company Overview
- 12.1.2.2. Products
- 12.1.2.3. Company Financials
- 12.1.2.4. SWOT Analysis
- 12.1.3 Policy Bazaar
- 12.1.3.1. Company Overview
- 12.1.3.2. Products
- 12.1.3.3. Company Financials
- 12.1.3.4. SWOT Analysis
- 12.1.4 PayU
- 12.1.4.1. Company Overview
- 12.1.4.2. Products
- 12.1.4.3. Company Financials
- 12.1.4.4. SWOT Analysis
- 12.1.5 Kissht
- 12.1.5.1. Company Overview
- 12.1.5.2. Products
- 12.1.5.3. Company Financials
- 12.1.5.4. SWOT Analysis
- 12.1.6 Shubh Loans
- 12.1.6.1. Company Overview
- 12.1.6.2. Products
- 12.1.6.3. Company Financials
- 12.1.6.4. SWOT Analysis
- 12.1.7 Lending Kart
- 12.1.7.1. Company Overview
- 12.1.7.2. Products
- 12.1.7.3. Company Financials
- 12.1.7.4. SWOT Analysis
- 12.1.8 Phonepe
- 12.1.8.1. Company Overview
- 12.1.8.2. Products
- 12.1.8.3. Company Financials
- 12.1.8.4. SWOT Analysis
- 12.1.9 Faircent
- 12.1.9.1. Company Overview
- 12.1.9.2. Products
- 12.1.9.3. Company Financials
- 12.1.9.4. SWOT Analysis
- 12.1.10 ET money**List Not Exhaustive
- 12.1.10.1. Company Overview
- 12.1.10.2. Products
- 12.1.10.3. Company Financials
- 12.1.10.4. SWOT Analysis
- 12.1.1 Paytm
- 12.2. Market Entropy
- 12.2.1 Company's Key Areas Served
- 12.2.2 Recent Developments
- 12.3. Company Market Share Analysis 2025
- 12.3.1 Top 5 Companies Market Share Analysis
- 12.3.2 Top 3 Companies Market Share Analysis
- 12.4. List of Potential Customers
- 13. Research Methodology
List of Figures
- Figure 1: Global Fintech Industry in India Revenue Breakdown (Million, %) by Region 2025 & 2033
- Figure 2: Global Fintech Industry in India Volume Breakdown (Billion, %) by Region 2025 & 2033
- Figure 3: North America Fintech Industry in India Revenue (Million), by Service Proposition 2025 & 2033
- Figure 4: North America Fintech Industry in India Volume (Billion), by Service Proposition 2025 & 2033
- Figure 5: North America Fintech Industry in India Revenue Share (%), by Service Proposition 2025 & 2033
- Figure 6: North America Fintech Industry in India Volume Share (%), by Service Proposition 2025 & 2033
- Figure 7: North America Fintech Industry in India Revenue (Million), by Application 2025 & 2033
- Figure 8: North America Fintech Industry in India Volume (Billion), by Application 2025 & 2033
- Figure 9: North America Fintech Industry in India Revenue Share (%), by Application 2025 & 2033
- Figure 10: North America Fintech Industry in India Volume Share (%), by Application 2025 & 2033
- Figure 11: North America Fintech Industry in India Revenue (Million), by Country 2025 & 2033
- Figure 12: North America Fintech Industry in India Volume (Billion), by Country 2025 & 2033
- Figure 13: North America Fintech Industry in India Revenue Share (%), by Country 2025 & 2033
- Figure 14: North America Fintech Industry in India Volume Share (%), by Country 2025 & 2033
- Figure 15: South America Fintech Industry in India Revenue (Million), by Service Proposition 2025 & 2033
- Figure 16: South America Fintech Industry in India Volume (Billion), by Service Proposition 2025 & 2033
- Figure 17: South America Fintech Industry in India Revenue Share (%), by Service Proposition 2025 & 2033
- Figure 18: South America Fintech Industry in India Volume Share (%), by Service Proposition 2025 & 2033
- Figure 19: South America Fintech Industry in India Revenue (Million), by Application 2025 & 2033
- Figure 20: South America Fintech Industry in India Volume (Billion), by Application 2025 & 2033
- Figure 21: South America Fintech Industry in India Revenue Share (%), by Application 2025 & 2033
- Figure 22: South America Fintech Industry in India Volume Share (%), by Application 2025 & 2033
- Figure 23: South America Fintech Industry in India Revenue (Million), by Country 2025 & 2033
- Figure 24: South America Fintech Industry in India Volume (Billion), by Country 2025 & 2033
- Figure 25: South America Fintech Industry in India Revenue Share (%), by Country 2025 & 2033
- Figure 26: South America Fintech Industry in India Volume Share (%), by Country 2025 & 2033
- Figure 27: Europe Fintech Industry in India Revenue (Million), by Service Proposition 2025 & 2033
- Figure 28: Europe Fintech Industry in India Volume (Billion), by Service Proposition 2025 & 2033
- Figure 29: Europe Fintech Industry in India Revenue Share (%), by Service Proposition 2025 & 2033
- Figure 30: Europe Fintech Industry in India Volume Share (%), by Service Proposition 2025 & 2033
- Figure 31: Europe Fintech Industry in India Revenue (Million), by Application 2025 & 2033
- Figure 32: Europe Fintech Industry in India Volume (Billion), by Application 2025 & 2033
- Figure 33: Europe Fintech Industry in India Revenue Share (%), by Application 2025 & 2033
- Figure 34: Europe Fintech Industry in India Volume Share (%), by Application 2025 & 2033
- Figure 35: Europe Fintech Industry in India Revenue (Million), by Country 2025 & 2033
- Figure 36: Europe Fintech Industry in India Volume (Billion), by Country 2025 & 2033
- Figure 37: Europe Fintech Industry in India Revenue Share (%), by Country 2025 & 2033
- Figure 38: Europe Fintech Industry in India Volume Share (%), by Country 2025 & 2033
- Figure 39: Middle East & Africa Fintech Industry in India Revenue (Million), by Service Proposition 2025 & 2033
- Figure 40: Middle East & Africa Fintech Industry in India Volume (Billion), by Service Proposition 2025 & 2033
- Figure 41: Middle East & Africa Fintech Industry in India Revenue Share (%), by Service Proposition 2025 & 2033
- Figure 42: Middle East & Africa Fintech Industry in India Volume Share (%), by Service Proposition 2025 & 2033
- Figure 43: Middle East & Africa Fintech Industry in India Revenue (Million), by Application 2025 & 2033
- Figure 44: Middle East & Africa Fintech Industry in India Volume (Billion), by Application 2025 & 2033
- Figure 45: Middle East & Africa Fintech Industry in India Revenue Share (%), by Application 2025 & 2033
- Figure 46: Middle East & Africa Fintech Industry in India Volume Share (%), by Application 2025 & 2033
- Figure 47: Middle East & Africa Fintech Industry in India Revenue (Million), by Country 2025 & 2033
- Figure 48: Middle East & Africa Fintech Industry in India Volume (Billion), by Country 2025 & 2033
- Figure 49: Middle East & Africa Fintech Industry in India Revenue Share (%), by Country 2025 & 2033
- Figure 50: Middle East & Africa Fintech Industry in India Volume Share (%), by Country 2025 & 2033
- Figure 51: Asia Pacific Fintech Industry in India Revenue (Million), by Service Proposition 2025 & 2033
- Figure 52: Asia Pacific Fintech Industry in India Volume (Billion), by Service Proposition 2025 & 2033
- Figure 53: Asia Pacific Fintech Industry in India Revenue Share (%), by Service Proposition 2025 & 2033
- Figure 54: Asia Pacific Fintech Industry in India Volume Share (%), by Service Proposition 2025 & 2033
- Figure 55: Asia Pacific Fintech Industry in India Revenue (Million), by Application 2025 & 2033
- Figure 56: Asia Pacific Fintech Industry in India Volume (Billion), by Application 2025 & 2033
- Figure 57: Asia Pacific Fintech Industry in India Revenue Share (%), by Application 2025 & 2033
- Figure 58: Asia Pacific Fintech Industry in India Volume Share (%), by Application 2025 & 2033
- Figure 59: Asia Pacific Fintech Industry in India Revenue (Million), by Country 2025 & 2033
- Figure 60: Asia Pacific Fintech Industry in India Volume (Billion), by Country 2025 & 2033
- Figure 61: Asia Pacific Fintech Industry in India Revenue Share (%), by Country 2025 & 2033
- Figure 62: Asia Pacific Fintech Industry in India Volume Share (%), by Country 2025 & 2033
List of Tables
- Table 1: Global Fintech Industry in India Revenue Million Forecast, by Service Proposition 2020 & 2033
- Table 2: Global Fintech Industry in India Volume Billion Forecast, by Service Proposition 2020 & 2033
- Table 3: Global Fintech Industry in India Revenue Million Forecast, by Application 2020 & 2033
- Table 4: Global Fintech Industry in India Volume Billion Forecast, by Application 2020 & 2033
- Table 5: Global Fintech Industry in India Revenue Million Forecast, by Region 2020 & 2033
- Table 6: Global Fintech Industry in India Volume Billion Forecast, by Region 2020 & 2033
- Table 7: Global Fintech Industry in India Revenue Million Forecast, by Service Proposition 2020 & 2033
- Table 8: Global Fintech Industry in India Volume Billion Forecast, by Service Proposition 2020 & 2033
- Table 9: Global Fintech Industry in India Revenue Million Forecast, by Application 2020 & 2033
- Table 10: Global Fintech Industry in India Volume Billion Forecast, by Application 2020 & 2033
- Table 11: Global Fintech Industry in India Revenue Million Forecast, by Country 2020 & 2033
- Table 12: Global Fintech Industry in India Volume Billion Forecast, by Country 2020 & 2033
- Table 13: United States Fintech Industry in India Revenue (Million) Forecast, by Application 2020 & 2033
- Table 14: United States Fintech Industry in India Volume (Billion) Forecast, by Application 2020 & 2033
- Table 15: Canada Fintech Industry in India Revenue (Million) Forecast, by Application 2020 & 2033
- Table 16: Canada Fintech Industry in India Volume (Billion) Forecast, by Application 2020 & 2033
- Table 17: Mexico Fintech Industry in India Revenue (Million) Forecast, by Application 2020 & 2033
- Table 18: Mexico Fintech Industry in India Volume (Billion) Forecast, by Application 2020 & 2033
- Table 19: Global Fintech Industry in India Revenue Million Forecast, by Service Proposition 2020 & 2033
- Table 20: Global Fintech Industry in India Volume Billion Forecast, by Service Proposition 2020 & 2033
- Table 21: Global Fintech Industry in India Revenue Million Forecast, by Application 2020 & 2033
- Table 22: Global Fintech Industry in India Volume Billion Forecast, by Application 2020 & 2033
- Table 23: Global Fintech Industry in India Revenue Million Forecast, by Country 2020 & 2033
- Table 24: Global Fintech Industry in India Volume Billion Forecast, by Country 2020 & 2033
- Table 25: Brazil Fintech Industry in India Revenue (Million) Forecast, by Application 2020 & 2033
- Table 26: Brazil Fintech Industry in India Volume (Billion) Forecast, by Application 2020 & 2033
- Table 27: Argentina Fintech Industry in India Revenue (Million) Forecast, by Application 2020 & 2033
- Table 28: Argentina Fintech Industry in India Volume (Billion) Forecast, by Application 2020 & 2033
- Table 29: Rest of South America Fintech Industry in India Revenue (Million) Forecast, by Application 2020 & 2033
- Table 30: Rest of South America Fintech Industry in India Volume (Billion) Forecast, by Application 2020 & 2033
- Table 31: Global Fintech Industry in India Revenue Million Forecast, by Service Proposition 2020 & 2033
- Table 32: Global Fintech Industry in India Volume Billion Forecast, by Service Proposition 2020 & 2033
- Table 33: Global Fintech Industry in India Revenue Million Forecast, by Application 2020 & 2033
- Table 34: Global Fintech Industry in India Volume Billion Forecast, by Application 2020 & 2033
- Table 35: Global Fintech Industry in India Revenue Million Forecast, by Country 2020 & 2033
- Table 36: Global Fintech Industry in India Volume Billion Forecast, by Country 2020 & 2033
- Table 37: United Kingdom Fintech Industry in India Revenue (Million) Forecast, by Application 2020 & 2033
- Table 38: United Kingdom Fintech Industry in India Volume (Billion) Forecast, by Application 2020 & 2033
- Table 39: Germany Fintech Industry in India Revenue (Million) Forecast, by Application 2020 & 2033
- Table 40: Germany Fintech Industry in India Volume (Billion) Forecast, by Application 2020 & 2033
- Table 41: France Fintech Industry in India Revenue (Million) Forecast, by Application 2020 & 2033
- Table 42: France Fintech Industry in India Volume (Billion) Forecast, by Application 2020 & 2033
- Table 43: Italy Fintech Industry in India Revenue (Million) Forecast, by Application 2020 & 2033
- Table 44: Italy Fintech Industry in India Volume (Billion) Forecast, by Application 2020 & 2033
- Table 45: Spain Fintech Industry in India Revenue (Million) Forecast, by Application 2020 & 2033
- Table 46: Spain Fintech Industry in India Volume (Billion) Forecast, by Application 2020 & 2033
- Table 47: Russia Fintech Industry in India Revenue (Million) Forecast, by Application 2020 & 2033
- Table 48: Russia Fintech Industry in India Volume (Billion) Forecast, by Application 2020 & 2033
- Table 49: Benelux Fintech Industry in India Revenue (Million) Forecast, by Application 2020 & 2033
- Table 50: Benelux Fintech Industry in India Volume (Billion) Forecast, by Application 2020 & 2033
- Table 51: Nordics Fintech Industry in India Revenue (Million) Forecast, by Application 2020 & 2033
- Table 52: Nordics Fintech Industry in India Volume (Billion) Forecast, by Application 2020 & 2033
- Table 53: Rest of Europe Fintech Industry in India Revenue (Million) Forecast, by Application 2020 & 2033
- Table 54: Rest of Europe Fintech Industry in India Volume (Billion) Forecast, by Application 2020 & 2033
- Table 55: Global Fintech Industry in India Revenue Million Forecast, by Service Proposition 2020 & 2033
- Table 56: Global Fintech Industry in India Volume Billion Forecast, by Service Proposition 2020 & 2033
- Table 57: Global Fintech Industry in India Revenue Million Forecast, by Application 2020 & 2033
- Table 58: Global Fintech Industry in India Volume Billion Forecast, by Application 2020 & 2033
- Table 59: Global Fintech Industry in India Revenue Million Forecast, by Country 2020 & 2033
- Table 60: Global Fintech Industry in India Volume Billion Forecast, by Country 2020 & 2033
- Table 61: Turkey Fintech Industry in India Revenue (Million) Forecast, by Application 2020 & 2033
- Table 62: Turkey Fintech Industry in India Volume (Billion) Forecast, by Application 2020 & 2033
- Table 63: Israel Fintech Industry in India Revenue (Million) Forecast, by Application 2020 & 2033
- Table 64: Israel Fintech Industry in India Volume (Billion) Forecast, by Application 2020 & 2033
- Table 65: GCC Fintech Industry in India Revenue (Million) Forecast, by Application 2020 & 2033
- Table 66: GCC Fintech Industry in India Volume (Billion) Forecast, by Application 2020 & 2033
- Table 67: North Africa Fintech Industry in India Revenue (Million) Forecast, by Application 2020 & 2033
- Table 68: North Africa Fintech Industry in India Volume (Billion) Forecast, by Application 2020 & 2033
- Table 69: South Africa Fintech Industry in India Revenue (Million) Forecast, by Application 2020 & 2033
- Table 70: South Africa Fintech Industry in India Volume (Billion) Forecast, by Application 2020 & 2033
- Table 71: Rest of Middle East & Africa Fintech Industry in India Revenue (Million) Forecast, by Application 2020 & 2033
- Table 72: Rest of Middle East & Africa Fintech Industry in India Volume (Billion) Forecast, by Application 2020 & 2033
- Table 73: Global Fintech Industry in India Revenue Million Forecast, by Service Proposition 2020 & 2033
- Table 74: Global Fintech Industry in India Volume Billion Forecast, by Service Proposition 2020 & 2033
- Table 75: Global Fintech Industry in India Revenue Million Forecast, by Application 2020 & 2033
- Table 76: Global Fintech Industry in India Volume Billion Forecast, by Application 2020 & 2033
- Table 77: Global Fintech Industry in India Revenue Million Forecast, by Country 2020 & 2033
- Table 78: Global Fintech Industry in India Volume Billion Forecast, by Country 2020 & 2033
- Table 79: China Fintech Industry in India Revenue (Million) Forecast, by Application 2020 & 2033
- Table 80: China Fintech Industry in India Volume (Billion) Forecast, by Application 2020 & 2033
- Table 81: India Fintech Industry in India Revenue (Million) Forecast, by Application 2020 & 2033
- Table 82: India Fintech Industry in India Volume (Billion) Forecast, by Application 2020 & 2033
- Table 83: Japan Fintech Industry in India Revenue (Million) Forecast, by Application 2020 & 2033
- Table 84: Japan Fintech Industry in India Volume (Billion) Forecast, by Application 2020 & 2033
- Table 85: South Korea Fintech Industry in India Revenue (Million) Forecast, by Application 2020 & 2033
- Table 86: South Korea Fintech Industry in India Volume (Billion) Forecast, by Application 2020 & 2033
- Table 87: ASEAN Fintech Industry in India Revenue (Million) Forecast, by Application 2020 & 2033
- Table 88: ASEAN Fintech Industry in India Volume (Billion) Forecast, by Application 2020 & 2033
- Table 89: Oceania Fintech Industry in India Revenue (Million) Forecast, by Application 2020 & 2033
- Table 90: Oceania Fintech Industry in India Volume (Billion) Forecast, by Application 2020 & 2033
- Table 91: Rest of Asia Pacific Fintech Industry in India Revenue (Million) Forecast, by Application 2020 & 2033
- Table 92: Rest of Asia Pacific Fintech Industry in India Volume (Billion) Forecast, by Application 2020 & 2033
Frequently Asked Questions
1. What is the projected Compound Annual Growth Rate (CAGR) of the Fintech Industry in India?
The projected CAGR is approximately 30.55%.
2. Which companies are prominent players in the Fintech Industry in India?
Key companies in the market include Paytm, MobiKwik, Policy Bazaar, PayU, Kissht, Shubh Loans, Lending Kart, Phonepe, Faircent, ET money**List Not Exhaustive.
3. What are the main segments of the Fintech Industry in India?
The market segments include Service Proposition, Application.
4. Can you provide details about the market size?
The market size is estimated to be USD 111.14 Million as of 2022.
5. What are some drivers contributing to market growth?
Increasing Demand for Digital Services; Rapid Advancement in Technology is Driving the Market.
6. What are the notable trends driving market growth?
Increase in Mobile Banking Payments is Surging the Growth of the Market.
7. Are there any restraints impacting market growth?
Increasing Demand for Digital Services; Rapid Advancement in Technology is Driving the Market.
8. Can you provide examples of recent developments in the market?
September 2023: PayU, an Indian payments company, partnered with WhatsApp to considerably improve Indians' purchasing experience.
9. What pricing options are available for accessing the report?
Pricing options include single-user, multi-user, and enterprise licenses priced at USD 3800, USD 4500, and USD 5800 respectively.
10. Is the market size provided in terms of value or volume?
The market size is provided in terms of value, measured in Million and volume, measured in Billion.
11. Are there any specific market keywords associated with the report?
Yes, the market keyword associated with the report is "Fintech Industry in India," which aids in identifying and referencing the specific market segment covered.
12. How do I determine which pricing option suits my needs best?
The pricing options vary based on user requirements and access needs. Individual users may opt for single-user licenses, while businesses requiring broader access may choose multi-user or enterprise licenses for cost-effective access to the report.
13. Are there any additional resources or data provided in the Fintech Industry in India report?
While the report offers comprehensive insights, it's advisable to review the specific contents or supplementary materials provided to ascertain if additional resources or data are available.
14. How can I stay updated on further developments or reports in the Fintech Industry in India?
To stay informed about further developments, trends, and reports in the Fintech Industry in India, consider subscribing to industry newsletters, following relevant companies and organizations, or regularly checking reputable industry news sources and publications.
Methodology
Step 1 - Identification of Relevant Samples Size from Population Database


Step 2 - Approaches for Defining Global Market Size (Value, Volume* & Price*)

Note*: In applicable scenarios
Step 3 - Data Sources
Primary Research
- Web Analytics
- Survey Reports
- Research Institute
- Latest Research Reports
- Opinion Leaders
Secondary Research
- Annual Reports
- White Paper
- Latest Press Release
- Industry Association
- Paid Database
- Investor Presentations

Step 4 - Data Triangulation
Involves using different sources of information in order to increase the validity of a study
These sources are likely to be stakeholders in a program - participants, other researchers, program staff, other community members, and so on.
Then we put all data in single framework & apply various statistical tools to find out the dynamic on the market.
During the analysis stage, feedback from the stakeholder groups would be compared to determine areas of agreement as well as areas of divergence