

Key Insights
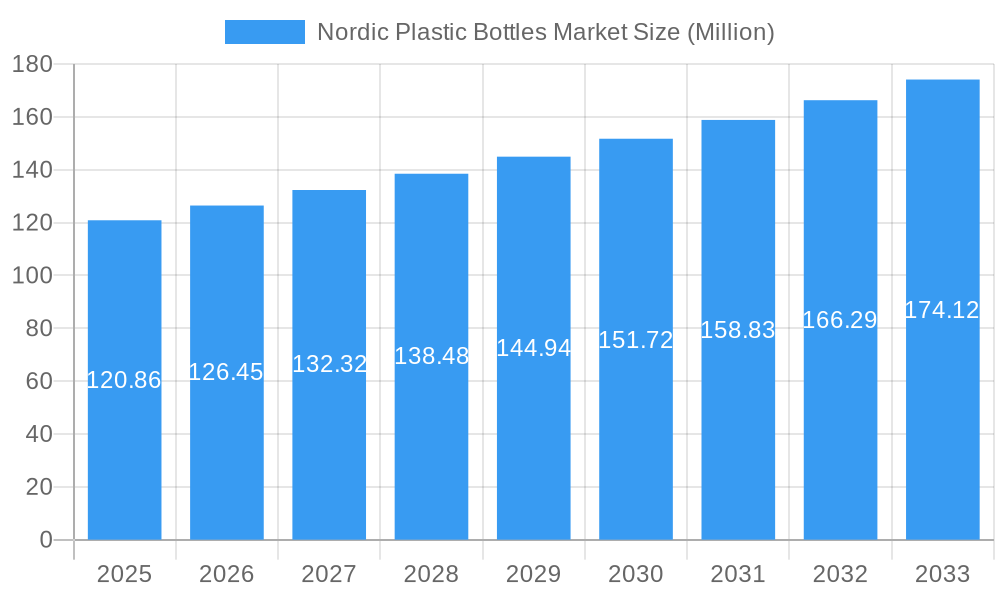
The Nordic plastic bottles market, valued at $120.86 million in 2025, is projected to experience robust growth, driven by increasing demand from the food and beverage, pharmaceutical, and personal care sectors across Denmark, Sweden, Norway, Finland, and Iceland. A compound annual growth rate (CAGR) of 4.57% is anticipated from 2025 to 2033, indicating a steady expansion. This growth is fueled by several key factors. The region's strong focus on sustainability is leading to increased adoption of recyclable and lightweight plastic bottles, while advancements in packaging technology are creating more efficient and appealing options. Furthermore, the rising popularity of bottled beverages and convenient packaging formats continues to bolster market demand. However, increasing concerns about plastic waste and environmental regulations pose a significant restraint, prompting manufacturers to innovate and adopt eco-friendly solutions, such as biodegradable plastics and improved recycling infrastructure. Competitive landscape analysis reveals a mix of established multinational corporations and smaller, agile regional players, each vying for market share through product differentiation, price competitiveness, and innovative solutions addressing sustainability concerns. The market's segmentation, while not explicitly provided, is likely stratified by bottle type (PET, HDPE, etc.), end-use industry, and packaging features (e.g., closures, labels). This fragmentation offers opportunities for specialized players to carve out niche markets.
Nordic Plastic Bottles Market Market Size (In Million)
The forecast period (2025-2033) anticipates consistent market expansion, though potential fluctuations may arise from economic conditions, raw material price volatility, and evolving consumer preferences. Key players are expected to invest heavily in research and development to introduce innovative, eco-friendly packaging solutions that comply with increasingly stringent environmental regulations. Strategic partnerships and mergers and acquisitions are also likely to shape the competitive dynamics, leading to further consolidation in the market. Companies like Berry Global Inc. and Nordic Pack are likely to maintain their leading positions, while smaller players will focus on specialized niches to compete effectively. The market's future hinges on the delicate balance between consumer demand for convenient packaging, industry initiatives to improve sustainability, and the imposition of environmental regulations.
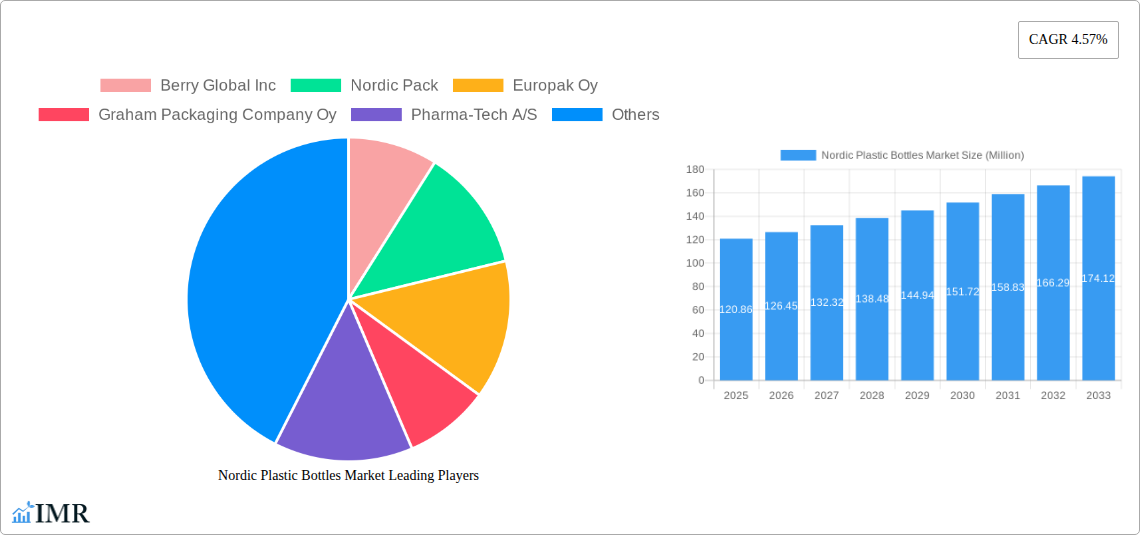
Nordic Plastic Bottles Market Company Market Share
Nordic Plastic Bottles Market: A Comprehensive Market Report (2019-2033)
This in-depth report provides a comprehensive analysis of the Nordic plastic bottles market, encompassing market dynamics, growth trends, competitive landscape, and future outlook. The report covers the parent market of packaging and the child market of plastic bottles specifically within the Nordic region, offering invaluable insights for industry professionals, investors, and strategic decision-makers. The study period spans from 2019 to 2033, with 2025 serving as both the base and estimated year. The forecast period extends from 2025 to 2033, while the historical period covers 2019-2024. Market values are presented in million units.
Nordic Plastic Bottles Market Dynamics & Structure
The Nordic plastic bottles market exhibits a moderately concentrated structure, with key players like Berry Global Inc, Nordic Pack, and Europak Oy holding significant market share. Technological innovation, particularly in sustainable and recyclable materials (e.g., rPET), is a major driver. Stringent environmental regulations within the Nordic countries are shaping market trends, pushing for reduced plastic consumption and increased recycling rates. Competitive pressure from alternative packaging materials like glass and aluminum also influences market dynamics. The end-user demographics are diverse, encompassing the food and beverage, pharmaceutical, and personal care industries. M&A activity in the sector has been moderate in recent years, with approximately xx deals recorded between 2019 and 2024, resulting in a xx% shift in market share among the top 5 players.
- Market Concentration: Moderately concentrated, with top 5 players holding approximately xx% market share.
- Technological Innovation: Focus on sustainable materials (rPET, bioplastics), lightweighting, and improved barrier properties.
- Regulatory Framework: Stringent environmental regulations driving demand for recyclable and sustainable packaging.
- Competitive Substitutes: Glass, aluminum, and alternative packaging materials pose a competitive threat.
- End-User Demographics: Food & beverage, pharmaceuticals, personal care, and chemical industries are key end-users.
- M&A Trends: Moderate M&A activity, with xx deals recorded between 2019 and 2024 leading to a xx% market share shift.
- Innovation Barriers: High R&D costs, regulatory approvals, and consumer adoption of new materials pose challenges.
Nordic Plastic Bottles Market Growth Trends & Insights
The Nordic plastic bottles market experienced a CAGR of xx% during the historical period (2019-2024), reaching a market size of xx million units in 2024. Growth is projected to continue at a CAGR of xx% during the forecast period (2025-2033), driven by increasing consumer demand, expanding end-use industries, and technological advancements. The adoption rate of sustainable packaging solutions is accelerating, with a projected xx% market penetration by 2033. Shifting consumer preferences towards convenience and sustainability are influencing packaging choices. Technological disruptions, particularly in recycling and material science, are further shaping market growth.
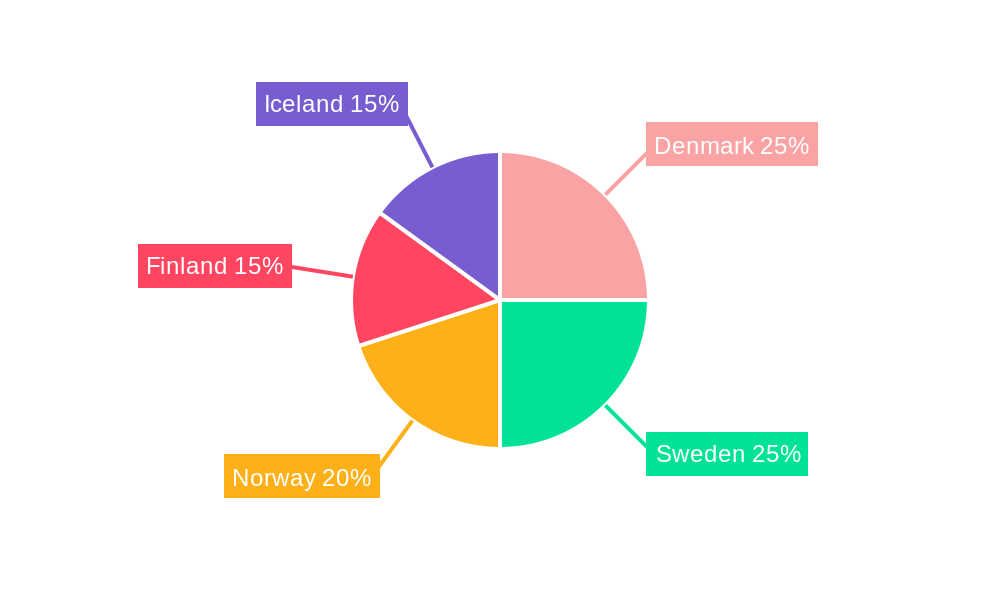
Dominant Regions, Countries, or Segments in Nordic Plastic Bottles Market
Sweden and Denmark are currently the dominant markets within the Nordic region, accounting for approximately xx% and xx% of the total market share, respectively. This dominance is attributed to factors like higher per capita consumption, robust economic growth, and well-established infrastructure. The food and beverage segment holds the largest market share, driven by strong demand for bottled beverages and packaged food products.
- Key Drivers:
- Strong economic growth in Sweden and Denmark.
- High per capita consumption of packaged goods.
- Developed infrastructure supporting efficient distribution.
- Government initiatives promoting sustainable packaging.
- Dominance Factors:
- Higher consumer spending power.
- Large retail networks and established distribution channels.
- Presence of major packaging manufacturers.
- Growth Potential: Significant growth potential exists in smaller Nordic countries and segments like pharmaceuticals and personal care.
Nordic Plastic Bottles Market Product Landscape
The Nordic plastic bottles market offers a diverse range of products, including PET, HDPE, and other specialized plastic bottles. Innovations focus on lightweighting for reduced material consumption, improved barrier properties for extended shelf life, and incorporating recycled content to enhance sustainability. Unique selling propositions (USPs) include enhanced recyclability, improved design aesthetics, and specialized functionalities (e.g., tamper-evident closures). Technological advancements in barrier coatings and smart packaging are emerging trends.
Key Drivers, Barriers & Challenges in Nordic Plastic Bottles Market
Key Drivers: Growing demand for convenient packaging, expansion of food and beverage industries, and the increasing adoption of sustainable and recyclable plastics are key drivers. Government support for circular economy initiatives further accelerates market growth.
Challenges & Restraints: Fluctuating raw material prices, stringent environmental regulations, and the competitive pressure from alternative packaging materials pose challenges. Supply chain disruptions and difficulties in sourcing sustainable materials can also impact market growth. The cost associated with recycling and the lack of advanced recycling infrastructure remain significant obstacles.
Emerging Opportunities in Nordic Plastic Bottles Market
Emerging opportunities lie in the increasing demand for lightweight, reusable, and recyclable bottles. The growing popularity of on-the-go consumption and the focus on health and wellness further fuels market growth. Innovative applications like smart packaging incorporating sensors and RFID technology also present exciting opportunities. Untapped potential exists within the pharmaceuticals and personal care sectors.
Growth Accelerators in the Nordic Plastic Bottles Market Industry
Strategic partnerships like the one between Plast Nordic and Norner are significantly accelerating market growth by fostering innovation in recycling and sustainable materials. Technological breakthroughs in recycling technologies, along with the adoption of new sustainable materials and lightweighting techniques, create opportunities for significant growth. Expansion strategies focused on sustainable and innovative packaging solutions are key for long-term success.
Key Players Shaping the Nordic Plastic Bottles Market Market
- Berry Global Inc
- Nordic Pack
- Europak Oy
- Graham Packaging Company Oy
- Pharma-Tech A/S
- Novapck A/S
- Nolato AB
- Berlin Packaging Denmark A/S
- Embaco A/S
- Promens Oy
Notable Milestones in Nordic Plastic Bottles Market Sector
- June 2024: Plast Nordic and Norner forge a strategic partnership to improve PET recycling. This highlights the growing focus on sustainability in the industry and potentially accelerates the adoption of rPET in plastic bottles.
- May 2024: Petainer's partnership with Saturnus expands PET bottle solutions for spirit producers, indicating growth in specialized packaging applications.
In-Depth Nordic Plastic Bottles Market Market Outlook
The Nordic plastic bottles market is poised for strong growth in the coming years, driven by the focus on sustainability, technological advancements, and the increasing demand for convenient packaging. Strategic partnerships and investments in innovative recycling solutions will further accelerate market expansion. Companies focusing on sustainable and innovative product offerings will be well-positioned to capture significant market share.
Nordic Plastic Bottles Market Segmentation
-
1. Resin
- 1.1. Polyethylene (PE)
- 1.2. Polyethylene Terephthalate (PET)
- 1.3. Polypropylene (PP)
- 1.4. Other Re
-
2. End-use Industries
- 2.1. Food
-
2.2. Beverage**
- 2.2.1. Bottled Water
- 2.2.2. Carbonated Soft Drinks
- 2.2.3. Alcoholic Beverages
- 2.2.4. Juices & Energy Drinks
- 2.2.5. Other Beverages
- 2.3. Pharmaceuticals
- 2.4. Personal Care & Toiletries
- 2.5. Industrial
- 2.6. Household Chemicals
- 2.7. Paints & Coatings
- 2.8. Other End-use Industries
Nordic Plastic Bottles Market Segmentation By Geography
-
1. North America
- 1.1. United States
- 1.2. Canada
- 1.3. Mexico
-
2. South America
- 2.1. Brazil
- 2.2. Argentina
- 2.3. Rest of South America
-
3. Europe
- 3.1. United Kingdom
- 3.2. Germany
- 3.3. France
- 3.4. Italy
- 3.5. Spain
- 3.6. Russia
- 3.7. Benelux
- 3.8. Nordics
- 3.9. Rest of Europe
-
4. Middle East & Africa
- 4.1. Turkey
- 4.2. Israel
- 4.3. GCC
- 4.4. North Africa
- 4.5. South Africa
- 4.6. Rest of Middle East & Africa
-
5. Asia Pacific
- 5.1. China
- 5.2. India
- 5.3. Japan
- 5.4. South Korea
- 5.5. ASEAN
- 5.6. Oceania
- 5.7. Rest of Asia Pacific
Nordic Plastic Bottles Market Regional Market Share
Geographic Coverage of Nordic Plastic Bottles Market
Nordic Plastic Bottles Market REPORT HIGHLIGHTS
| Aspects | Details |
|---|---|
| Study Period | 2020-2034 |
| Base Year | 2025 |
| Estimated Year | 2026 |
| Forecast Period | 2026-2034 |
| Historical Period | 2020-2025 |
| Growth Rate | CAGR of 4.57% from 2020-2034 |
| Segmentation |
|
Table of Contents
- 1. Introduction
- 1.1. Research Scope
- 1.2. Market Segmentation
- 1.3. Research Objective
- 1.4. Definitions and Assumptions
- 2. Executive Summary
- 2.1. Market Snapshot
- 3. Market Dynamics
- 3.1. Market Drivers
- 3.2. Market Restrains
- 3.3. Market Trends
- 3.4. Market Opportunities
- 4. Market Factor Analysis
- 4.1. Porters Five Forces
- 4.1.1. Bargaining Power of Suppliers
- 4.1.2. Bargaining Power of Buyers
- 4.1.3. Threat of New Entrants
- 4.1.4. Threat of Substitutes
- 4.1.5. Competitive Rivalry
- 4.2. PESTEL analysis
- 4.3. BCG Analysis
- 4.3.1. Stars (High Growth, High Market Share)
- 4.3.2. Cash Cows (Low Growth, High Market Share)
- 4.3.3. Question Mark (High Growth, Low Market Share)
- 4.3.4. Dogs (Low Growth, Low Market Share)
- 4.4. Ansoff Matrix Analysis
- 4.5. Supply Chain Analysis
- 4.6. Regulatory Landscape
- 4.7. Current Market Potential and Opportunity Assessment (TAM–SAM–SOM Framework)
- 4.8. IMR Analyst Note
- 4.1. Porters Five Forces
- 5. Market Analysis, Insights and Forecast 2021-2033
- 5.1. Market Analysis, Insights and Forecast - by Resin
- 5.1.1. Polyethylene (PE)
- 5.1.2. Polyethylene Terephthalate (PET)
- 5.1.3. Polypropylene (PP)
- 5.1.4. Other Re
- 5.2. Market Analysis, Insights and Forecast - by End-use Industries
- 5.2.1. Food
- 5.2.2. Beverage**
- 5.2.2.1. Bottled Water
- 5.2.2.2. Carbonated Soft Drinks
- 5.2.2.3. Alcoholic Beverages
- 5.2.2.4. Juices & Energy Drinks
- 5.2.2.5. Other Beverages
- 5.2.3. Pharmaceuticals
- 5.2.4. Personal Care & Toiletries
- 5.2.5. Industrial
- 5.2.6. Household Chemicals
- 5.2.7. Paints & Coatings
- 5.2.8. Other End-use Industries
- 5.3. Market Analysis, Insights and Forecast - by Region
- 5.3.1. North America
- 5.3.2. South America
- 5.3.3. Europe
- 5.3.4. Middle East & Africa
- 5.3.5. Asia Pacific
- 5.1. Market Analysis, Insights and Forecast - by Resin
- 6. Global Nordic Plastic Bottles Market Analysis, Insights and Forecast, 2021-2033
- 6.1. Market Analysis, Insights and Forecast - by Resin
- 6.1.1. Polyethylene (PE)
- 6.1.2. Polyethylene Terephthalate (PET)
- 6.1.3. Polypropylene (PP)
- 6.1.4. Other Re
- 6.2. Market Analysis, Insights and Forecast - by End-use Industries
- 6.2.1. Food
- 6.2.2. Beverage**
- 6.2.2.1. Bottled Water
- 6.2.2.2. Carbonated Soft Drinks
- 6.2.2.3. Alcoholic Beverages
- 6.2.2.4. Juices & Energy Drinks
- 6.2.2.5. Other Beverages
- 6.2.3. Pharmaceuticals
- 6.2.4. Personal Care & Toiletries
- 6.2.5. Industrial
- 6.2.6. Household Chemicals
- 6.2.7. Paints & Coatings
- 6.2.8. Other End-use Industries
- 6.1. Market Analysis, Insights and Forecast - by Resin
- 7. North America Nordic Plastic Bottles Market Analysis, Insights and Forecast, 2020-2032
- 7.1. Market Analysis, Insights and Forecast - by Resin
- 7.1.1. Polyethylene (PE)
- 7.1.2. Polyethylene Terephthalate (PET)
- 7.1.3. Polypropylene (PP)
- 7.1.4. Other Re
- 7.2. Market Analysis, Insights and Forecast - by End-use Industries
- 7.2.1. Food
- 7.2.2. Beverage**
- 7.2.2.1. Bottled Water
- 7.2.2.2. Carbonated Soft Drinks
- 7.2.2.3. Alcoholic Beverages
- 7.2.2.4. Juices & Energy Drinks
- 7.2.2.5. Other Beverages
- 7.2.3. Pharmaceuticals
- 7.2.4. Personal Care & Toiletries
- 7.2.5. Industrial
- 7.2.6. Household Chemicals
- 7.2.7. Paints & Coatings
- 7.2.8. Other End-use Industries
- 7.1. Market Analysis, Insights and Forecast - by Resin
- 8. South America Nordic Plastic Bottles Market Analysis, Insights and Forecast, 2020-2032
- 8.1. Market Analysis, Insights and Forecast - by Resin
- 8.1.1. Polyethylene (PE)
- 8.1.2. Polyethylene Terephthalate (PET)
- 8.1.3. Polypropylene (PP)
- 8.1.4. Other Re
- 8.2. Market Analysis, Insights and Forecast - by End-use Industries
- 8.2.1. Food
- 8.2.2. Beverage**
- 8.2.2.1. Bottled Water
- 8.2.2.2. Carbonated Soft Drinks
- 8.2.2.3. Alcoholic Beverages
- 8.2.2.4. Juices & Energy Drinks
- 8.2.2.5. Other Beverages
- 8.2.3. Pharmaceuticals
- 8.2.4. Personal Care & Toiletries
- 8.2.5. Industrial
- 8.2.6. Household Chemicals
- 8.2.7. Paints & Coatings
- 8.2.8. Other End-use Industries
- 8.1. Market Analysis, Insights and Forecast - by Resin
- 9. Europe Nordic Plastic Bottles Market Analysis, Insights and Forecast, 2020-2032
- 9.1. Market Analysis, Insights and Forecast - by Resin
- 9.1.1. Polyethylene (PE)
- 9.1.2. Polyethylene Terephthalate (PET)
- 9.1.3. Polypropylene (PP)
- 9.1.4. Other Re
- 9.2. Market Analysis, Insights and Forecast - by End-use Industries
- 9.2.1. Food
- 9.2.2. Beverage**
- 9.2.2.1. Bottled Water
- 9.2.2.2. Carbonated Soft Drinks
- 9.2.2.3. Alcoholic Beverages
- 9.2.2.4. Juices & Energy Drinks
- 9.2.2.5. Other Beverages
- 9.2.3. Pharmaceuticals
- 9.2.4. Personal Care & Toiletries
- 9.2.5. Industrial
- 9.2.6. Household Chemicals
- 9.2.7. Paints & Coatings
- 9.2.8. Other End-use Industries
- 9.1. Market Analysis, Insights and Forecast - by Resin
- 10. Middle East & Africa Nordic Plastic Bottles Market Analysis, Insights and Forecast, 2020-2032
- 10.1. Market Analysis, Insights and Forecast - by Resin
- 10.1.1. Polyethylene (PE)
- 10.1.2. Polyethylene Terephthalate (PET)
- 10.1.3. Polypropylene (PP)
- 10.1.4. Other Re
- 10.2. Market Analysis, Insights and Forecast - by End-use Industries
- 10.2.1. Food
- 10.2.2. Beverage**
- 10.2.2.1. Bottled Water
- 10.2.2.2. Carbonated Soft Drinks
- 10.2.2.3. Alcoholic Beverages
- 10.2.2.4. Juices & Energy Drinks
- 10.2.2.5. Other Beverages
- 10.2.3. Pharmaceuticals
- 10.2.4. Personal Care & Toiletries
- 10.2.5. Industrial
- 10.2.6. Household Chemicals
- 10.2.7. Paints & Coatings
- 10.2.8. Other End-use Industries
- 10.1. Market Analysis, Insights and Forecast - by Resin
- 11. Asia Pacific Nordic Plastic Bottles Market Analysis, Insights and Forecast, 2020-2032
- 11.1. Market Analysis, Insights and Forecast - by Resin
- 11.1.1. Polyethylene (PE)
- 11.1.2. Polyethylene Terephthalate (PET)
- 11.1.3. Polypropylene (PP)
- 11.1.4. Other Re
- 11.2. Market Analysis, Insights and Forecast - by End-use Industries
- 11.2.1. Food
- 11.2.2. Beverage**
- 11.2.2.1. Bottled Water
- 11.2.2.2. Carbonated Soft Drinks
- 11.2.2.3. Alcoholic Beverages
- 11.2.2.4. Juices & Energy Drinks
- 11.2.2.5. Other Beverages
- 11.2.3. Pharmaceuticals
- 11.2.4. Personal Care & Toiletries
- 11.2.5. Industrial
- 11.2.6. Household Chemicals
- 11.2.7. Paints & Coatings
- 11.2.8. Other End-use Industries
- 11.1. Market Analysis, Insights and Forecast - by Resin
- 12. Competitive Analysis
- 12.1. Company Profiles
- 12.1.1 Berry Global Inc
- 12.1.1.1. Company Overview
- 12.1.1.2. Products
- 12.1.1.3. Company Financials
- 12.1.1.4. SWOT Analysis
- 12.1.2 Nordic Pack
- 12.1.2.1. Company Overview
- 12.1.2.2. Products
- 12.1.2.3. Company Financials
- 12.1.2.4. SWOT Analysis
- 12.1.3 Europak Oy
- 12.1.3.1. Company Overview
- 12.1.3.2. Products
- 12.1.3.3. Company Financials
- 12.1.3.4. SWOT Analysis
- 12.1.4 Graham Packaging Company Oy
- 12.1.4.1. Company Overview
- 12.1.4.2. Products
- 12.1.4.3. Company Financials
- 12.1.4.4. SWOT Analysis
- 12.1.5 Pharma-Tech A/S
- 12.1.5.1. Company Overview
- 12.1.5.2. Products
- 12.1.5.3. Company Financials
- 12.1.5.4. SWOT Analysis
- 12.1.6 Novapck A/S
- 12.1.6.1. Company Overview
- 12.1.6.2. Products
- 12.1.6.3. Company Financials
- 12.1.6.4. SWOT Analysis
- 12.1.7 Nolato AB
- 12.1.7.1. Company Overview
- 12.1.7.2. Products
- 12.1.7.3. Company Financials
- 12.1.7.4. SWOT Analysis
- 12.1.8 Berlin Packaging Denmark A/S
- 12.1.8.1. Company Overview
- 12.1.8.2. Products
- 12.1.8.3. Company Financials
- 12.1.8.4. SWOT Analysis
- 12.1.9 Embaco A/S
- 12.1.9.1. Company Overview
- 12.1.9.2. Products
- 12.1.9.3. Company Financials
- 12.1.9.4. SWOT Analysis
- 12.1.10 Promens Oy7 2 Heat Map Analysis7 3 Competitor Analysis - Emerging vs Established Player
- 12.1.10.1. Company Overview
- 12.1.10.2. Products
- 12.1.10.3. Company Financials
- 12.1.10.4. SWOT Analysis
- 12.1.1 Berry Global Inc
- 12.2. Market Entropy
- 12.2.1 Company's Key Areas Served
- 12.2.2 Recent Developments
- 12.3. Company Market Share Analysis 2025
- 12.3.1 Top 5 Companies Market Share Analysis
- 12.3.2 Top 3 Companies Market Share Analysis
- 12.4. List of Potential Customers
- 13. Research Methodology
List of Figures
- Figure 1: Global Nordic Plastic Bottles Market Revenue Breakdown (Million, %) by Region 2025 & 2033
- Figure 2: Global Nordic Plastic Bottles Market Volume Breakdown (Million, %) by Region 2025 & 2033
- Figure 3: North America Nordic Plastic Bottles Market Revenue (Million), by Resin 2025 & 2033
- Figure 4: North America Nordic Plastic Bottles Market Volume (Million), by Resin 2025 & 2033
- Figure 5: North America Nordic Plastic Bottles Market Revenue Share (%), by Resin 2025 & 2033
- Figure 6: North America Nordic Plastic Bottles Market Volume Share (%), by Resin 2025 & 2033
- Figure 7: North America Nordic Plastic Bottles Market Revenue (Million), by End-use Industries 2025 & 2033
- Figure 8: North America Nordic Plastic Bottles Market Volume (Million), by End-use Industries 2025 & 2033
- Figure 9: North America Nordic Plastic Bottles Market Revenue Share (%), by End-use Industries 2025 & 2033
- Figure 10: North America Nordic Plastic Bottles Market Volume Share (%), by End-use Industries 2025 & 2033
- Figure 11: North America Nordic Plastic Bottles Market Revenue (Million), by Country 2025 & 2033
- Figure 12: North America Nordic Plastic Bottles Market Volume (Million), by Country 2025 & 2033
- Figure 13: North America Nordic Plastic Bottles Market Revenue Share (%), by Country 2025 & 2033
- Figure 14: North America Nordic Plastic Bottles Market Volume Share (%), by Country 2025 & 2033
- Figure 15: South America Nordic Plastic Bottles Market Revenue (Million), by Resin 2025 & 2033
- Figure 16: South America Nordic Plastic Bottles Market Volume (Million), by Resin 2025 & 2033
- Figure 17: South America Nordic Plastic Bottles Market Revenue Share (%), by Resin 2025 & 2033
- Figure 18: South America Nordic Plastic Bottles Market Volume Share (%), by Resin 2025 & 2033
- Figure 19: South America Nordic Plastic Bottles Market Revenue (Million), by End-use Industries 2025 & 2033
- Figure 20: South America Nordic Plastic Bottles Market Volume (Million), by End-use Industries 2025 & 2033
- Figure 21: South America Nordic Plastic Bottles Market Revenue Share (%), by End-use Industries 2025 & 2033
- Figure 22: South America Nordic Plastic Bottles Market Volume Share (%), by End-use Industries 2025 & 2033
- Figure 23: South America Nordic Plastic Bottles Market Revenue (Million), by Country 2025 & 2033
- Figure 24: South America Nordic Plastic Bottles Market Volume (Million), by Country 2025 & 2033
- Figure 25: South America Nordic Plastic Bottles Market Revenue Share (%), by Country 2025 & 2033
- Figure 26: South America Nordic Plastic Bottles Market Volume Share (%), by Country 2025 & 2033
- Figure 27: Europe Nordic Plastic Bottles Market Revenue (Million), by Resin 2025 & 2033
- Figure 28: Europe Nordic Plastic Bottles Market Volume (Million), by Resin 2025 & 2033
- Figure 29: Europe Nordic Plastic Bottles Market Revenue Share (%), by Resin 2025 & 2033
- Figure 30: Europe Nordic Plastic Bottles Market Volume Share (%), by Resin 2025 & 2033
- Figure 31: Europe Nordic Plastic Bottles Market Revenue (Million), by End-use Industries 2025 & 2033
- Figure 32: Europe Nordic Plastic Bottles Market Volume (Million), by End-use Industries 2025 & 2033
- Figure 33: Europe Nordic Plastic Bottles Market Revenue Share (%), by End-use Industries 2025 & 2033
- Figure 34: Europe Nordic Plastic Bottles Market Volume Share (%), by End-use Industries 2025 & 2033
- Figure 35: Europe Nordic Plastic Bottles Market Revenue (Million), by Country 2025 & 2033
- Figure 36: Europe Nordic Plastic Bottles Market Volume (Million), by Country 2025 & 2033
- Figure 37: Europe Nordic Plastic Bottles Market Revenue Share (%), by Country 2025 & 2033
- Figure 38: Europe Nordic Plastic Bottles Market Volume Share (%), by Country 2025 & 2033
- Figure 39: Middle East & Africa Nordic Plastic Bottles Market Revenue (Million), by Resin 2025 & 2033
- Figure 40: Middle East & Africa Nordic Plastic Bottles Market Volume (Million), by Resin 2025 & 2033
- Figure 41: Middle East & Africa Nordic Plastic Bottles Market Revenue Share (%), by Resin 2025 & 2033
- Figure 42: Middle East & Africa Nordic Plastic Bottles Market Volume Share (%), by Resin 2025 & 2033
- Figure 43: Middle East & Africa Nordic Plastic Bottles Market Revenue (Million), by End-use Industries 2025 & 2033
- Figure 44: Middle East & Africa Nordic Plastic Bottles Market Volume (Million), by End-use Industries 2025 & 2033
- Figure 45: Middle East & Africa Nordic Plastic Bottles Market Revenue Share (%), by End-use Industries 2025 & 2033
- Figure 46: Middle East & Africa Nordic Plastic Bottles Market Volume Share (%), by End-use Industries 2025 & 2033
- Figure 47: Middle East & Africa Nordic Plastic Bottles Market Revenue (Million), by Country 2025 & 2033
- Figure 48: Middle East & Africa Nordic Plastic Bottles Market Volume (Million), by Country 2025 & 2033
- Figure 49: Middle East & Africa Nordic Plastic Bottles Market Revenue Share (%), by Country 2025 & 2033
- Figure 50: Middle East & Africa Nordic Plastic Bottles Market Volume Share (%), by Country 2025 & 2033
- Figure 51: Asia Pacific Nordic Plastic Bottles Market Revenue (Million), by Resin 2025 & 2033
- Figure 52: Asia Pacific Nordic Plastic Bottles Market Volume (Million), by Resin 2025 & 2033
- Figure 53: Asia Pacific Nordic Plastic Bottles Market Revenue Share (%), by Resin 2025 & 2033
- Figure 54: Asia Pacific Nordic Plastic Bottles Market Volume Share (%), by Resin 2025 & 2033
- Figure 55: Asia Pacific Nordic Plastic Bottles Market Revenue (Million), by End-use Industries 2025 & 2033
- Figure 56: Asia Pacific Nordic Plastic Bottles Market Volume (Million), by End-use Industries 2025 & 2033
- Figure 57: Asia Pacific Nordic Plastic Bottles Market Revenue Share (%), by End-use Industries 2025 & 2033
- Figure 58: Asia Pacific Nordic Plastic Bottles Market Volume Share (%), by End-use Industries 2025 & 2033
- Figure 59: Asia Pacific Nordic Plastic Bottles Market Revenue (Million), by Country 2025 & 2033
- Figure 60: Asia Pacific Nordic Plastic Bottles Market Volume (Million), by Country 2025 & 2033
- Figure 61: Asia Pacific Nordic Plastic Bottles Market Revenue Share (%), by Country 2025 & 2033
- Figure 62: Asia Pacific Nordic Plastic Bottles Market Volume Share (%), by Country 2025 & 2033
List of Tables
- Table 1: Global Nordic Plastic Bottles Market Revenue Million Forecast, by Resin 2020 & 2033
- Table 2: Global Nordic Plastic Bottles Market Volume Million Forecast, by Resin 2020 & 2033
- Table 3: Global Nordic Plastic Bottles Market Revenue Million Forecast, by End-use Industries 2020 & 2033
- Table 4: Global Nordic Plastic Bottles Market Volume Million Forecast, by End-use Industries 2020 & 2033
- Table 5: Global Nordic Plastic Bottles Market Revenue Million Forecast, by Region 2020 & 2033
- Table 6: Global Nordic Plastic Bottles Market Volume Million Forecast, by Region 2020 & 2033
- Table 7: Global Nordic Plastic Bottles Market Revenue Million Forecast, by Resin 2020 & 2033
- Table 8: Global Nordic Plastic Bottles Market Volume Million Forecast, by Resin 2020 & 2033
- Table 9: Global Nordic Plastic Bottles Market Revenue Million Forecast, by End-use Industries 2020 & 2033
- Table 10: Global Nordic Plastic Bottles Market Volume Million Forecast, by End-use Industries 2020 & 2033
- Table 11: Global Nordic Plastic Bottles Market Revenue Million Forecast, by Country 2020 & 2033
- Table 12: Global Nordic Plastic Bottles Market Volume Million Forecast, by Country 2020 & 2033
- Table 13: United States Nordic Plastic Bottles Market Revenue (Million) Forecast, by Application 2020 & 2033
- Table 14: United States Nordic Plastic Bottles Market Volume (Million) Forecast, by Application 2020 & 2033
- Table 15: Canada Nordic Plastic Bottles Market Revenue (Million) Forecast, by Application 2020 & 2033
- Table 16: Canada Nordic Plastic Bottles Market Volume (Million) Forecast, by Application 2020 & 2033
- Table 17: Mexico Nordic Plastic Bottles Market Revenue (Million) Forecast, by Application 2020 & 2033
- Table 18: Mexico Nordic Plastic Bottles Market Volume (Million) Forecast, by Application 2020 & 2033
- Table 19: Global Nordic Plastic Bottles Market Revenue Million Forecast, by Resin 2020 & 2033
- Table 20: Global Nordic Plastic Bottles Market Volume Million Forecast, by Resin 2020 & 2033
- Table 21: Global Nordic Plastic Bottles Market Revenue Million Forecast, by End-use Industries 2020 & 2033
- Table 22: Global Nordic Plastic Bottles Market Volume Million Forecast, by End-use Industries 2020 & 2033
- Table 23: Global Nordic Plastic Bottles Market Revenue Million Forecast, by Country 2020 & 2033
- Table 24: Global Nordic Plastic Bottles Market Volume Million Forecast, by Country 2020 & 2033
- Table 25: Brazil Nordic Plastic Bottles Market Revenue (Million) Forecast, by Application 2020 & 2033
- Table 26: Brazil Nordic Plastic Bottles Market Volume (Million) Forecast, by Application 2020 & 2033
- Table 27: Argentina Nordic Plastic Bottles Market Revenue (Million) Forecast, by Application 2020 & 2033
- Table 28: Argentina Nordic Plastic Bottles Market Volume (Million) Forecast, by Application 2020 & 2033
- Table 29: Rest of South America Nordic Plastic Bottles Market Revenue (Million) Forecast, by Application 2020 & 2033
- Table 30: Rest of South America Nordic Plastic Bottles Market Volume (Million) Forecast, by Application 2020 & 2033
- Table 31: Global Nordic Plastic Bottles Market Revenue Million Forecast, by Resin 2020 & 2033
- Table 32: Global Nordic Plastic Bottles Market Volume Million Forecast, by Resin 2020 & 2033
- Table 33: Global Nordic Plastic Bottles Market Revenue Million Forecast, by End-use Industries 2020 & 2033
- Table 34: Global Nordic Plastic Bottles Market Volume Million Forecast, by End-use Industries 2020 & 2033
- Table 35: Global Nordic Plastic Bottles Market Revenue Million Forecast, by Country 2020 & 2033
- Table 36: Global Nordic Plastic Bottles Market Volume Million Forecast, by Country 2020 & 2033
- Table 37: United Kingdom Nordic Plastic Bottles Market Revenue (Million) Forecast, by Application 2020 & 2033
- Table 38: United Kingdom Nordic Plastic Bottles Market Volume (Million) Forecast, by Application 2020 & 2033
- Table 39: Germany Nordic Plastic Bottles Market Revenue (Million) Forecast, by Application 2020 & 2033
- Table 40: Germany Nordic Plastic Bottles Market Volume (Million) Forecast, by Application 2020 & 2033
- Table 41: France Nordic Plastic Bottles Market Revenue (Million) Forecast, by Application 2020 & 2033
- Table 42: France Nordic Plastic Bottles Market Volume (Million) Forecast, by Application 2020 & 2033
- Table 43: Italy Nordic Plastic Bottles Market Revenue (Million) Forecast, by Application 2020 & 2033
- Table 44: Italy Nordic Plastic Bottles Market Volume (Million) Forecast, by Application 2020 & 2033
- Table 45: Spain Nordic Plastic Bottles Market Revenue (Million) Forecast, by Application 2020 & 2033
- Table 46: Spain Nordic Plastic Bottles Market Volume (Million) Forecast, by Application 2020 & 2033
- Table 47: Russia Nordic Plastic Bottles Market Revenue (Million) Forecast, by Application 2020 & 2033
- Table 48: Russia Nordic Plastic Bottles Market Volume (Million) Forecast, by Application 2020 & 2033
- Table 49: Benelux Nordic Plastic Bottles Market Revenue (Million) Forecast, by Application 2020 & 2033
- Table 50: Benelux Nordic Plastic Bottles Market Volume (Million) Forecast, by Application 2020 & 2033
- Table 51: Nordics Nordic Plastic Bottles Market Revenue (Million) Forecast, by Application 2020 & 2033
- Table 52: Nordics Nordic Plastic Bottles Market Volume (Million) Forecast, by Application 2020 & 2033
- Table 53: Rest of Europe Nordic Plastic Bottles Market Revenue (Million) Forecast, by Application 2020 & 2033
- Table 54: Rest of Europe Nordic Plastic Bottles Market Volume (Million) Forecast, by Application 2020 & 2033
- Table 55: Global Nordic Plastic Bottles Market Revenue Million Forecast, by Resin 2020 & 2033
- Table 56: Global Nordic Plastic Bottles Market Volume Million Forecast, by Resin 2020 & 2033
- Table 57: Global Nordic Plastic Bottles Market Revenue Million Forecast, by End-use Industries 2020 & 2033
- Table 58: Global Nordic Plastic Bottles Market Volume Million Forecast, by End-use Industries 2020 & 2033
- Table 59: Global Nordic Plastic Bottles Market Revenue Million Forecast, by Country 2020 & 2033
- Table 60: Global Nordic Plastic Bottles Market Volume Million Forecast, by Country 2020 & 2033
- Table 61: Turkey Nordic Plastic Bottles Market Revenue (Million) Forecast, by Application 2020 & 2033
- Table 62: Turkey Nordic Plastic Bottles Market Volume (Million) Forecast, by Application 2020 & 2033
- Table 63: Israel Nordic Plastic Bottles Market Revenue (Million) Forecast, by Application 2020 & 2033
- Table 64: Israel Nordic Plastic Bottles Market Volume (Million) Forecast, by Application 2020 & 2033
- Table 65: GCC Nordic Plastic Bottles Market Revenue (Million) Forecast, by Application 2020 & 2033
- Table 66: GCC Nordic Plastic Bottles Market Volume (Million) Forecast, by Application 2020 & 2033
- Table 67: North Africa Nordic Plastic Bottles Market Revenue (Million) Forecast, by Application 2020 & 2033
- Table 68: North Africa Nordic Plastic Bottles Market Volume (Million) Forecast, by Application 2020 & 2033
- Table 69: South Africa Nordic Plastic Bottles Market Revenue (Million) Forecast, by Application 2020 & 2033
- Table 70: South Africa Nordic Plastic Bottles Market Volume (Million) Forecast, by Application 2020 & 2033
- Table 71: Rest of Middle East & Africa Nordic Plastic Bottles Market Revenue (Million) Forecast, by Application 2020 & 2033
- Table 72: Rest of Middle East & Africa Nordic Plastic Bottles Market Volume (Million) Forecast, by Application 2020 & 2033
- Table 73: Global Nordic Plastic Bottles Market Revenue Million Forecast, by Resin 2020 & 2033
- Table 74: Global Nordic Plastic Bottles Market Volume Million Forecast, by Resin 2020 & 2033
- Table 75: Global Nordic Plastic Bottles Market Revenue Million Forecast, by End-use Industries 2020 & 2033
- Table 76: Global Nordic Plastic Bottles Market Volume Million Forecast, by End-use Industries 2020 & 2033
- Table 77: Global Nordic Plastic Bottles Market Revenue Million Forecast, by Country 2020 & 2033
- Table 78: Global Nordic Plastic Bottles Market Volume Million Forecast, by Country 2020 & 2033
- Table 79: China Nordic Plastic Bottles Market Revenue (Million) Forecast, by Application 2020 & 2033
- Table 80: China Nordic Plastic Bottles Market Volume (Million) Forecast, by Application 2020 & 2033
- Table 81: India Nordic Plastic Bottles Market Revenue (Million) Forecast, by Application 2020 & 2033
- Table 82: India Nordic Plastic Bottles Market Volume (Million) Forecast, by Application 2020 & 2033
- Table 83: Japan Nordic Plastic Bottles Market Revenue (Million) Forecast, by Application 2020 & 2033
- Table 84: Japan Nordic Plastic Bottles Market Volume (Million) Forecast, by Application 2020 & 2033
- Table 85: South Korea Nordic Plastic Bottles Market Revenue (Million) Forecast, by Application 2020 & 2033
- Table 86: South Korea Nordic Plastic Bottles Market Volume (Million) Forecast, by Application 2020 & 2033
- Table 87: ASEAN Nordic Plastic Bottles Market Revenue (Million) Forecast, by Application 2020 & 2033
- Table 88: ASEAN Nordic Plastic Bottles Market Volume (Million) Forecast, by Application 2020 & 2033
- Table 89: Oceania Nordic Plastic Bottles Market Revenue (Million) Forecast, by Application 2020 & 2033
- Table 90: Oceania Nordic Plastic Bottles Market Volume (Million) Forecast, by Application 2020 & 2033
- Table 91: Rest of Asia Pacific Nordic Plastic Bottles Market Revenue (Million) Forecast, by Application 2020 & 2033
- Table 92: Rest of Asia Pacific Nordic Plastic Bottles Market Volume (Million) Forecast, by Application 2020 & 2033
Frequently Asked Questions
1. What is the projected Compound Annual Growth Rate (CAGR) of the Nordic Plastic Bottles Market?
The projected CAGR is approximately 4.57%.
2. Which companies are prominent players in the Nordic Plastic Bottles Market?
Key companies in the market include Berry Global Inc, Nordic Pack, Europak Oy, Graham Packaging Company Oy, Pharma-Tech A/S, Novapck A/S, Nolato AB, Berlin Packaging Denmark A/S, Embaco A/S, Promens Oy7 2 Heat Map Analysis7 3 Competitor Analysis - Emerging vs Established Player.
3. What are the main segments of the Nordic Plastic Bottles Market?
The market segments include Resin, End-use Industries.
4. Can you provide details about the market size?
The market size is estimated to be USD 120.86 Million as of 2022.
5. What are some drivers contributing to market growth?
Increasing Adoption of Lightweight Packaging Methods; Changing Demographic and Lifestyle Factors.
6. What are the notable trends driving market growth?
Growing Demand From Food And Beverage Sector.
7. Are there any restraints impacting market growth?
Increasing Adoption of Lightweight Packaging Methods; Changing Demographic and Lifestyle Factors.
8. Can you provide examples of recent developments in the market?
June 2024: Plast Nordic forged a strategic partnership with Norner, a polymer industry expert boasting over 40 years of experience. Norner, located in Porsgrunn, Norway, operates state-of-the-art laboratories, polymerization units, and industrial-scale process pilot plants. After years of discussions, Plast Nordic and Norner have formalized their collaboration. Their partnership, framed through a Memorandum of Understanding (MOU), delineates a strategy for achieving Plast Nordic's strategic and commercial goals. A joint press release highlighted that the Nordic region grapples with over 400,000 tons of PET waste. However, with their innovative industrial solution, they can chemically recycle about 97% of this waste back into its original raw materials.
9. What pricing options are available for accessing the report?
Pricing options include single-user, multi-user, and enterprise licenses priced at USD 3800, USD 4500, and USD 5800 respectively.
10. Is the market size provided in terms of value or volume?
The market size is provided in terms of value, measured in Million and volume, measured in Million.
11. Are there any specific market keywords associated with the report?
Yes, the market keyword associated with the report is "Nordic Plastic Bottles Market," which aids in identifying and referencing the specific market segment covered.
12. How do I determine which pricing option suits my needs best?
The pricing options vary based on user requirements and access needs. Individual users may opt for single-user licenses, while businesses requiring broader access may choose multi-user or enterprise licenses for cost-effective access to the report.
13. Are there any additional resources or data provided in the Nordic Plastic Bottles Market report?
While the report offers comprehensive insights, it's advisable to review the specific contents or supplementary materials provided to ascertain if additional resources or data are available.
14. How can I stay updated on further developments or reports in the Nordic Plastic Bottles Market?
To stay informed about further developments, trends, and reports in the Nordic Plastic Bottles Market, consider subscribing to industry newsletters, following relevant companies and organizations, or regularly checking reputable industry news sources and publications.
Methodology
Step 1 - Identification of Relevant Samples Size from Population Database


Step 2 - Approaches for Defining Global Market Size (Value, Volume* & Price*)

Note*: In applicable scenarios
Step 3 - Data Sources
Primary Research
- Web Analytics
- Survey Reports
- Research Institute
- Latest Research Reports
- Opinion Leaders
Secondary Research
- Annual Reports
- White Paper
- Latest Press Release
- Industry Association
- Paid Database
- Investor Presentations

Step 4 - Data Triangulation
Involves using different sources of information in order to increase the validity of a study
These sources are likely to be stakeholders in a program - participants, other researchers, program staff, other community members, and so on.
Then we put all data in single framework & apply various statistical tools to find out the dynamic on the market.
During the analysis stage, feedback from the stakeholder groups would be compared to determine areas of agreement as well as areas of divergence