

Key Insights
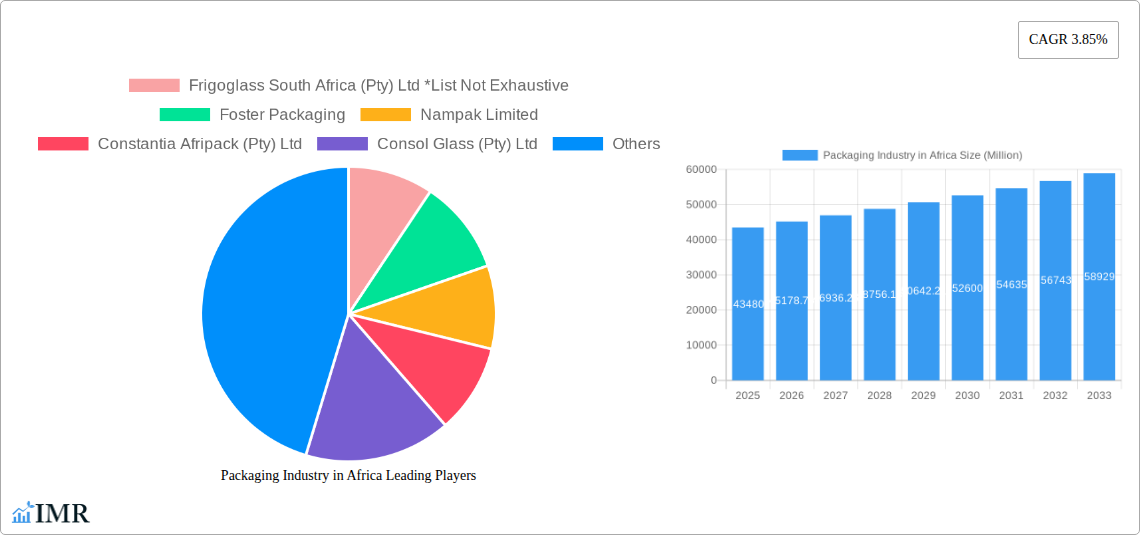
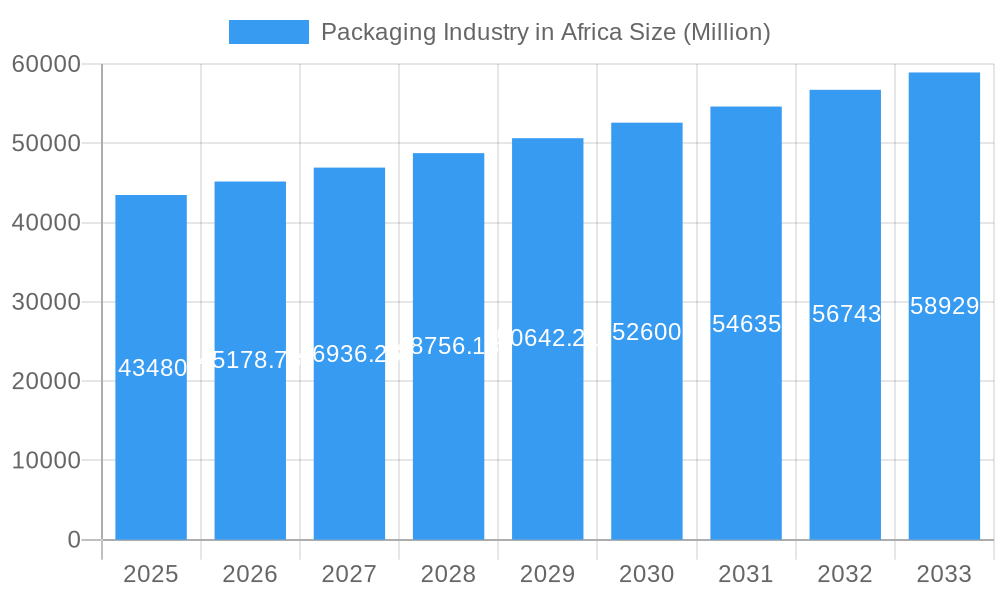
The African packaging industry, valued at $43.48 billion in 2025, is experiencing robust growth, projected to expand at a compound annual growth rate (CAGR) of 3.85% from 2025 to 2033. This growth is fueled by several key factors. The burgeoning food and beverage sector, driven by a rising population and increasing urbanization, is a significant driver, demanding innovative and efficient packaging solutions. The expanding pharmaceutical and household/personal care industries also contribute to market expansion. Furthermore, a shift towards sustainable packaging materials, driven by growing environmental awareness and stricter regulations, is creating opportunities for eco-friendly alternatives like biodegradable plastics and recycled paperboard. Increased investment in manufacturing infrastructure and a developing e-commerce sector further stimulate demand. However, challenges remain. Infrastructure limitations in certain regions, fluctuating raw material prices, and the need to overcome existing informal packaging practices pose restraints to accelerated growth.
Packaging Industry in Africa Market Size (In Billion)
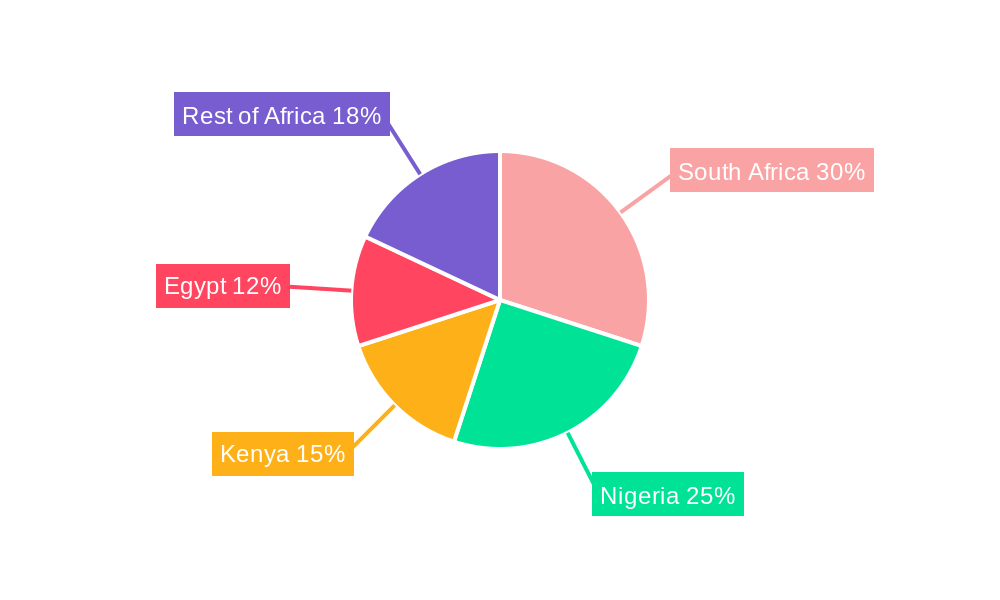
South Africa, Nigeria, Kenya, and Egypt represent the largest national markets, accounting for a significant portion of the overall regional demand. The industry is segmented by material (paper & paperboard, plastic, metal, glass), product type (bottles, boxes, cans), end-user industry (beverage, food, pharmaceuticals, etc.), and country. Leading players such as Nampak Limited, Mondi Group, and Tetra Pak SA are actively shaping the market, through both organic growth and strategic acquisitions. The dominance of plastic packaging is expected to gradually decline as consumers and businesses prioritize sustainability, leading to an increased market share for alternative materials. The forecast period suggests continued growth, with opportunities for both established multinational corporations and local businesses to capitalize on the expanding market. Further research into specific material and product segment growth, alongside regional variations, will be crucial for targeted market entry strategies.
Packaging Industry in Africa Company Market Share
Packaging Industry in Africa: A Comprehensive Market Report (2019-2033)
This comprehensive report provides an in-depth analysis of the dynamic Packaging Industry in Africa, covering the period from 2019 to 2033. It offers invaluable insights into market size, growth trends, key players, and future opportunities across various segments and geographies, empowering businesses to make informed strategic decisions. The report leverages extensive data analysis and expert insights to present a clear picture of the African packaging landscape, encompassing crucial aspects from material types to end-user industries and major market players.
Packaging Industry in Africa Market Dynamics & Structure
The African packaging market, valued at xx million units in 2024, is characterized by a moderately fragmented structure, with several major players and numerous smaller, regional companies competing for market share. Technological innovation, while present, faces hurdles such as infrastructure limitations and access to capital. Regulatory frameworks vary across countries, posing challenges for consistent standards and operations. The industry experiences competition from alternative packaging materials and a growing emphasis on sustainable solutions. Mergers and acquisitions (M&A) are increasingly common, reflecting consolidation efforts and expansion strategies.
- Market Concentration: Moderately fragmented, with a few dominant players controlling xx% of the market in 2024.
- Technological Innovation: Driven by demand for sustainable and efficient packaging, but hindered by infrastructure and access to advanced technologies.
- Regulatory Frameworks: Varied across countries, leading to inconsistencies in regulations and standards.
- Competitive Product Substitutes: Growing competition from biodegradable and eco-friendly packaging alternatives.
- End-User Demographics: Shifting demographics and rising consumer disposable income drive demand for diverse packaging solutions.
- M&A Trends: Increasing M&A activity indicates consolidation and expansion strategies among major players. xx M&A deals were recorded between 2019 and 2024.
Packaging Industry in Africa Growth Trends & Insights
The African packaging market exhibits robust growth, driven by expanding economies, rising population, urbanization, and increased consumer spending. The market experienced a CAGR of xx% during the historical period (2019-2024) and is projected to maintain a CAGR of xx% during the forecast period (2025-2033). Technological disruptions, particularly in sustainable packaging solutions, are significantly impacting adoption rates. Shifting consumer preferences towards convenience, safety, and eco-friendly packaging further fuel market expansion. Market penetration varies across segments and regions, with higher penetration rates observed in urban areas and developed economies within Africa. The report provides detailed analysis of these trends, including segment-wise CAGR and market penetration data, to offer a comprehensive understanding of the growth drivers.
Dominant Regions, Countries, or Segments in Packaging Industry in Africa
South Africa holds the largest market share in the African packaging industry in 2025, followed by Nigeria and Egypt. Within segments:
- By Material: Plastic packaging dominates, accounting for xx million units in 2025, followed by paper and paperboard at xx million units. Growth in both segments is driven by demand from the food and beverage sector.
- By Product Type: Plastic bottles and corrugated boxes represent the largest segments, showing strong growth due to rising demand for packaged goods.
- By End-user Industry: The food and beverage sector is the primary driver of market growth, followed by pharmaceuticals and household/personal care products.
Key Drivers:
- Economic Growth: Expanding economies drive increased consumption and demand for packaged goods.
- Rising Population: A rapidly growing population fuels the demand for diverse packaging solutions.
- Urbanization: Urbanization accelerates the demand for convenient and readily available packaged products.
- Infrastructure Development: Improved infrastructure facilitates the distribution and supply of packaging materials and products.
Packaging Industry in Africa Product Landscape
The African packaging market showcases continuous innovation in product design, materials, and functionality. Sustainable packaging solutions, such as biodegradable and recyclable materials, are gaining traction, driven by environmental concerns and regulatory changes. Product advancements include lightweight packaging to reduce transportation costs and improve efficiency. Innovations focus on enhancing product protection, shelf life, and consumer appeal. These advancements are changing the overall performance metrics and gaining market acceptance due to their unique selling propositions that address consumer demands and environmental concerns.
Key Drivers, Barriers & Challenges in Packaging Industry in Africa
Key Drivers:
- Increased Consumer Spending: Rising disposable incomes boost demand for packaged goods.
- Growth of E-commerce: E-commerce expansion requires robust packaging solutions for safe and efficient delivery.
- Government Initiatives: Policy support for local manufacturing and sustainable packaging encourages market growth.
Key Challenges:
- Supply Chain Disruptions: Logistical challenges and infrastructure limitations impact efficient supply chain management.
- Regulatory Hurdles: Inconsistent regulatory frameworks across countries create complexities.
- Competition: Intense competition, especially from international players, can impact profitability.
Emerging Opportunities in Packaging Industry in Africa
Untapped markets in rural areas present significant growth potential. The increasing popularity of online shopping creates demand for specialized e-commerce packaging solutions. Opportunities also exist in sustainable and eco-friendly packaging, catering to growing environmental awareness.
Growth Accelerators in the Packaging Industry in Africa Industry
Technological advancements, such as automation and smart packaging, are enhancing efficiency and productivity. Strategic partnerships between local and international players foster innovation and market expansion. Government initiatives promoting local manufacturing and sustainable packaging further accelerate growth.
Key Players Shaping the Packaging Industry in Africa Market
- Frigoglass South Africa (Pty) Ltd
- Foster Packaging
- Nampak Limited
- Constantia Afripack (Pty) Ltd
- Consol Glass (Pty) Ltd
- Mondi Group
- Tetra Pak SA
- Astrapak Ltd (RPC Group)
- East African Packaging Industries Ltd (EAPI)
- Mpact Pty Ltd
- Bonpak (Pty) Ltd
Notable Milestones in Packaging Industry in Africa Sector
- April 2022: Ardagh Group acquired Consol Holdings Proprietary Limited for USD 1 billion, including net debt, signaling significant investment in the South African and other African markets.
- June 2022: Dow expanded its Project REFLEX flexible packaging recycling initiative to Egypt and Guinea, promoting sustainable practices.
In-Depth Packaging Industry in Africa Market Outlook
The African packaging market is poised for significant growth, driven by a combination of factors, including expanding economies, rising populations, and increasing urbanization. Strategic investments in sustainable packaging solutions and technological advancements will further fuel market expansion. The outlook is positive, with considerable opportunities for businesses to capitalize on the growing demand for innovative and sustainable packaging solutions across diverse sectors.
Packaging Industry in Africa Segmentation
-
1. Material
- 1.1. Paper and Paperboard
- 1.2. Plastic
- 1.3. Metal
- 1.4. Glass
-
2. Product Type
- 2.1. Plastic Bottles
- 2.2. Glass Bottles
- 2.3. Corrugated Boxes
- 2.4. Metal Cans
- 2.5. Other Applications
-
3. End-user Industry
- 3.1. Beverage
- 3.2. Food
- 3.3. Pharmaceuticals
- 3.4. Household and Personal Care
- 3.5. Other
Packaging Industry in Africa Segmentation By Geography
-
1. North America
- 1.1. United States
- 1.2. Canada
- 1.3. Mexico
-
2. South America
- 2.1. Brazil
- 2.2. Argentina
- 2.3. Rest of South America
-
3. Europe
- 3.1. United Kingdom
- 3.2. Germany
- 3.3. France
- 3.4. Italy
- 3.5. Spain
- 3.6. Russia
- 3.7. Benelux
- 3.8. Nordics
- 3.9. Rest of Europe
-
4. Middle East & Africa
- 4.1. Turkey
- 4.2. Israel
- 4.3. GCC
- 4.4. North Africa
- 4.5. South Africa
- 4.6. Rest of Middle East & Africa
-
5. Asia Pacific
- 5.1. China
- 5.2. India
- 5.3. Japan
- 5.4. South Korea
- 5.5. ASEAN
- 5.6. Oceania
- 5.7. Rest of Asia Pacific
Packaging Industry in Africa Regional Market Share
Geographic Coverage of Packaging Industry in Africa
Packaging Industry in Africa REPORT HIGHLIGHTS
| Aspects | Details |
|---|---|
| Study Period | 2020-2034 |
| Base Year | 2025 |
| Estimated Year | 2026 |
| Forecast Period | 2026-2034 |
| Historical Period | 2020-2025 |
| Growth Rate | CAGR of 3.85% from 2020-2034 |
| Segmentation |
|
Table of Contents
- 1. Introduction
- 1.1. Research Scope
- 1.2. Market Segmentation
- 1.3. Research Objective
- 1.4. Definitions and Assumptions
- 2. Executive Summary
- 2.1. Market Snapshot
- 3. Market Dynamics
- 3.1. Market Drivers
- 3.2. Market Restrains
- 3.3. Market Trends
- 3.4. Market Opportunities
- 4. Market Factor Analysis
- 4.1. Porters Five Forces
- 4.1.1. Bargaining Power of Suppliers
- 4.1.2. Bargaining Power of Buyers
- 4.1.3. Threat of New Entrants
- 4.1.4. Threat of Substitutes
- 4.1.5. Competitive Rivalry
- 4.2. PESTEL analysis
- 4.3. BCG Analysis
- 4.3.1. Stars (High Growth, High Market Share)
- 4.3.2. Cash Cows (Low Growth, High Market Share)
- 4.3.3. Question Mark (High Growth, Low Market Share)
- 4.3.4. Dogs (Low Growth, Low Market Share)
- 4.4. Ansoff Matrix Analysis
- 4.5. Supply Chain Analysis
- 4.6. Regulatory Landscape
- 4.7. Current Market Potential and Opportunity Assessment (TAM–SAM–SOM Framework)
- 4.8. IMR Analyst Note
- 4.1. Porters Five Forces
- 5. Market Analysis, Insights and Forecast 2021-2033
- 5.1. Market Analysis, Insights and Forecast - by Material
- 5.1.1. Paper and Paperboard
- 5.1.2. Plastic
- 5.1.3. Metal
- 5.1.4. Glass
- 5.2. Market Analysis, Insights and Forecast - by Product Type
- 5.2.1. Plastic Bottles
- 5.2.2. Glass Bottles
- 5.2.3. Corrugated Boxes
- 5.2.4. Metal Cans
- 5.2.5. Other Applications
- 5.3. Market Analysis, Insights and Forecast - by End-user Industry
- 5.3.1. Beverage
- 5.3.2. Food
- 5.3.3. Pharmaceuticals
- 5.3.4. Household and Personal Care
- 5.3.5. Other
- 5.4. Market Analysis, Insights and Forecast - by Region
- 5.4.1. North America
- 5.4.2. South America
- 5.4.3. Europe
- 5.4.4. Middle East & Africa
- 5.4.5. Asia Pacific
- 5.1. Market Analysis, Insights and Forecast - by Material
- 6. Global Packaging Industry in Africa Analysis, Insights and Forecast, 2021-2033
- 6.1. Market Analysis, Insights and Forecast - by Material
- 6.1.1. Paper and Paperboard
- 6.1.2. Plastic
- 6.1.3. Metal
- 6.1.4. Glass
- 6.2. Market Analysis, Insights and Forecast - by Product Type
- 6.2.1. Plastic Bottles
- 6.2.2. Glass Bottles
- 6.2.3. Corrugated Boxes
- 6.2.4. Metal Cans
- 6.2.5. Other Applications
- 6.3. Market Analysis, Insights and Forecast - by End-user Industry
- 6.3.1. Beverage
- 6.3.2. Food
- 6.3.3. Pharmaceuticals
- 6.3.4. Household and Personal Care
- 6.3.5. Other
- 6.1. Market Analysis, Insights and Forecast - by Material
- 7. North America Packaging Industry in Africa Analysis, Insights and Forecast, 2020-2032
- 7.1. Market Analysis, Insights and Forecast - by Material
- 7.1.1. Paper and Paperboard
- 7.1.2. Plastic
- 7.1.3. Metal
- 7.1.4. Glass
- 7.2. Market Analysis, Insights and Forecast - by Product Type
- 7.2.1. Plastic Bottles
- 7.2.2. Glass Bottles
- 7.2.3. Corrugated Boxes
- 7.2.4. Metal Cans
- 7.2.5. Other Applications
- 7.3. Market Analysis, Insights and Forecast - by End-user Industry
- 7.3.1. Beverage
- 7.3.2. Food
- 7.3.3. Pharmaceuticals
- 7.3.4. Household and Personal Care
- 7.3.5. Other
- 7.1. Market Analysis, Insights and Forecast - by Material
- 8. South America Packaging Industry in Africa Analysis, Insights and Forecast, 2020-2032
- 8.1. Market Analysis, Insights and Forecast - by Material
- 8.1.1. Paper and Paperboard
- 8.1.2. Plastic
- 8.1.3. Metal
- 8.1.4. Glass
- 8.2. Market Analysis, Insights and Forecast - by Product Type
- 8.2.1. Plastic Bottles
- 8.2.2. Glass Bottles
- 8.2.3. Corrugated Boxes
- 8.2.4. Metal Cans
- 8.2.5. Other Applications
- 8.3. Market Analysis, Insights and Forecast - by End-user Industry
- 8.3.1. Beverage
- 8.3.2. Food
- 8.3.3. Pharmaceuticals
- 8.3.4. Household and Personal Care
- 8.3.5. Other
- 8.1. Market Analysis, Insights and Forecast - by Material
- 9. Europe Packaging Industry in Africa Analysis, Insights and Forecast, 2020-2032
- 9.1. Market Analysis, Insights and Forecast - by Material
- 9.1.1. Paper and Paperboard
- 9.1.2. Plastic
- 9.1.3. Metal
- 9.1.4. Glass
- 9.2. Market Analysis, Insights and Forecast - by Product Type
- 9.2.1. Plastic Bottles
- 9.2.2. Glass Bottles
- 9.2.3. Corrugated Boxes
- 9.2.4. Metal Cans
- 9.2.5. Other Applications
- 9.3. Market Analysis, Insights and Forecast - by End-user Industry
- 9.3.1. Beverage
- 9.3.2. Food
- 9.3.3. Pharmaceuticals
- 9.3.4. Household and Personal Care
- 9.3.5. Other
- 9.1. Market Analysis, Insights and Forecast - by Material
- 10. Middle East & Africa Packaging Industry in Africa Analysis, Insights and Forecast, 2020-2032
- 10.1. Market Analysis, Insights and Forecast - by Material
- 10.1.1. Paper and Paperboard
- 10.1.2. Plastic
- 10.1.3. Metal
- 10.1.4. Glass
- 10.2. Market Analysis, Insights and Forecast - by Product Type
- 10.2.1. Plastic Bottles
- 10.2.2. Glass Bottles
- 10.2.3. Corrugated Boxes
- 10.2.4. Metal Cans
- 10.2.5. Other Applications
- 10.3. Market Analysis, Insights and Forecast - by End-user Industry
- 10.3.1. Beverage
- 10.3.2. Food
- 10.3.3. Pharmaceuticals
- 10.3.4. Household and Personal Care
- 10.3.5. Other
- 10.1. Market Analysis, Insights and Forecast - by Material
- 11. Asia Pacific Packaging Industry in Africa Analysis, Insights and Forecast, 2020-2032
- 11.1. Market Analysis, Insights and Forecast - by Material
- 11.1.1. Paper and Paperboard
- 11.1.2. Plastic
- 11.1.3. Metal
- 11.1.4. Glass
- 11.2. Market Analysis, Insights and Forecast - by Product Type
- 11.2.1. Plastic Bottles
- 11.2.2. Glass Bottles
- 11.2.3. Corrugated Boxes
- 11.2.4. Metal Cans
- 11.2.5. Other Applications
- 11.3. Market Analysis, Insights and Forecast - by End-user Industry
- 11.3.1. Beverage
- 11.3.2. Food
- 11.3.3. Pharmaceuticals
- 11.3.4. Household and Personal Care
- 11.3.5. Other
- 11.1. Market Analysis, Insights and Forecast - by Material
- 12. Competitive Analysis
- 12.1. Company Profiles
- 12.1.1 Frigoglass South Africa (Pty) Ltd *List Not Exhaustive
- 12.1.1.1. Company Overview
- 12.1.1.2. Products
- 12.1.1.3. Company Financials
- 12.1.1.4. SWOT Analysis
- 12.1.2 Foster Packaging
- 12.1.2.1. Company Overview
- 12.1.2.2. Products
- 12.1.2.3. Company Financials
- 12.1.2.4. SWOT Analysis
- 12.1.3 Nampak Limited
- 12.1.3.1. Company Overview
- 12.1.3.2. Products
- 12.1.3.3. Company Financials
- 12.1.3.4. SWOT Analysis
- 12.1.4 Constantia Afripack (Pty) Ltd
- 12.1.4.1. Company Overview
- 12.1.4.2. Products
- 12.1.4.3. Company Financials
- 12.1.4.4. SWOT Analysis
- 12.1.5 Consol Glass (Pty) Ltd
- 12.1.5.1. Company Overview
- 12.1.5.2. Products
- 12.1.5.3. Company Financials
- 12.1.5.4. SWOT Analysis
- 12.1.6 Mondi Group
- 12.1.6.1. Company Overview
- 12.1.6.2. Products
- 12.1.6.3. Company Financials
- 12.1.6.4. SWOT Analysis
- 12.1.7 Tetra Pak SA
- 12.1.7.1. Company Overview
- 12.1.7.2. Products
- 12.1.7.3. Company Financials
- 12.1.7.4. SWOT Analysis
- 12.1.8 Astrapak Ltd (RPC Group)
- 12.1.8.1. Company Overview
- 12.1.8.2. Products
- 12.1.8.3. Company Financials
- 12.1.8.4. SWOT Analysis
- 12.1.9 East African Packaging Industries Ltd (EAPI)
- 12.1.9.1. Company Overview
- 12.1.9.2. Products
- 12.1.9.3. Company Financials
- 12.1.9.4. SWOT Analysis
- 12.1.10 Mpact Pty Ltd
- 12.1.10.1. Company Overview
- 12.1.10.2. Products
- 12.1.10.3. Company Financials
- 12.1.10.4. SWOT Analysis
- 12.1.11 Bonpak (Pty) Ltd
- 12.1.11.1. Company Overview
- 12.1.11.2. Products
- 12.1.11.3. Company Financials
- 12.1.11.4. SWOT Analysis
- 12.1.1 Frigoglass South Africa (Pty) Ltd *List Not Exhaustive
- 12.2. Market Entropy
- 12.2.1 Company's Key Areas Served
- 12.2.2 Recent Developments
- 12.3. Company Market Share Analysis 2025
- 12.3.1 Top 5 Companies Market Share Analysis
- 12.3.2 Top 3 Companies Market Share Analysis
- 12.4. List of Potential Customers
- 13. Research Methodology
List of Figures
- Figure 1: Global Packaging Industry in Africa Revenue Breakdown (Million, %) by Region 2025 & 2033
- Figure 2: North America Packaging Industry in Africa Revenue (Million), by Material 2025 & 2033
- Figure 3: North America Packaging Industry in Africa Revenue Share (%), by Material 2025 & 2033
- Figure 4: North America Packaging Industry in Africa Revenue (Million), by Product Type 2025 & 2033
- Figure 5: North America Packaging Industry in Africa Revenue Share (%), by Product Type 2025 & 2033
- Figure 6: North America Packaging Industry in Africa Revenue (Million), by End-user Industry 2025 & 2033
- Figure 7: North America Packaging Industry in Africa Revenue Share (%), by End-user Industry 2025 & 2033
- Figure 8: North America Packaging Industry in Africa Revenue (Million), by Country 2025 & 2033
- Figure 9: North America Packaging Industry in Africa Revenue Share (%), by Country 2025 & 2033
- Figure 10: South America Packaging Industry in Africa Revenue (Million), by Material 2025 & 2033
- Figure 11: South America Packaging Industry in Africa Revenue Share (%), by Material 2025 & 2033
- Figure 12: South America Packaging Industry in Africa Revenue (Million), by Product Type 2025 & 2033
- Figure 13: South America Packaging Industry in Africa Revenue Share (%), by Product Type 2025 & 2033
- Figure 14: South America Packaging Industry in Africa Revenue (Million), by End-user Industry 2025 & 2033
- Figure 15: South America Packaging Industry in Africa Revenue Share (%), by End-user Industry 2025 & 2033
- Figure 16: South America Packaging Industry in Africa Revenue (Million), by Country 2025 & 2033
- Figure 17: South America Packaging Industry in Africa Revenue Share (%), by Country 2025 & 2033
- Figure 18: Europe Packaging Industry in Africa Revenue (Million), by Material 2025 & 2033
- Figure 19: Europe Packaging Industry in Africa Revenue Share (%), by Material 2025 & 2033
- Figure 20: Europe Packaging Industry in Africa Revenue (Million), by Product Type 2025 & 2033
- Figure 21: Europe Packaging Industry in Africa Revenue Share (%), by Product Type 2025 & 2033
- Figure 22: Europe Packaging Industry in Africa Revenue (Million), by End-user Industry 2025 & 2033
- Figure 23: Europe Packaging Industry in Africa Revenue Share (%), by End-user Industry 2025 & 2033
- Figure 24: Europe Packaging Industry in Africa Revenue (Million), by Country 2025 & 2033
- Figure 25: Europe Packaging Industry in Africa Revenue Share (%), by Country 2025 & 2033
- Figure 26: Middle East & Africa Packaging Industry in Africa Revenue (Million), by Material 2025 & 2033
- Figure 27: Middle East & Africa Packaging Industry in Africa Revenue Share (%), by Material 2025 & 2033
- Figure 28: Middle East & Africa Packaging Industry in Africa Revenue (Million), by Product Type 2025 & 2033
- Figure 29: Middle East & Africa Packaging Industry in Africa Revenue Share (%), by Product Type 2025 & 2033
- Figure 30: Middle East & Africa Packaging Industry in Africa Revenue (Million), by End-user Industry 2025 & 2033
- Figure 31: Middle East & Africa Packaging Industry in Africa Revenue Share (%), by End-user Industry 2025 & 2033
- Figure 32: Middle East & Africa Packaging Industry in Africa Revenue (Million), by Country 2025 & 2033
- Figure 33: Middle East & Africa Packaging Industry in Africa Revenue Share (%), by Country 2025 & 2033
- Figure 34: Asia Pacific Packaging Industry in Africa Revenue (Million), by Material 2025 & 2033
- Figure 35: Asia Pacific Packaging Industry in Africa Revenue Share (%), by Material 2025 & 2033
- Figure 36: Asia Pacific Packaging Industry in Africa Revenue (Million), by Product Type 2025 & 2033
- Figure 37: Asia Pacific Packaging Industry in Africa Revenue Share (%), by Product Type 2025 & 2033
- Figure 38: Asia Pacific Packaging Industry in Africa Revenue (Million), by End-user Industry 2025 & 2033
- Figure 39: Asia Pacific Packaging Industry in Africa Revenue Share (%), by End-user Industry 2025 & 2033
- Figure 40: Asia Pacific Packaging Industry in Africa Revenue (Million), by Country 2025 & 2033
- Figure 41: Asia Pacific Packaging Industry in Africa Revenue Share (%), by Country 2025 & 2033
List of Tables
- Table 1: Global Packaging Industry in Africa Revenue Million Forecast, by Material 2020 & 2033
- Table 2: Global Packaging Industry in Africa Revenue Million Forecast, by Product Type 2020 & 2033
- Table 3: Global Packaging Industry in Africa Revenue Million Forecast, by End-user Industry 2020 & 2033
- Table 4: Global Packaging Industry in Africa Revenue Million Forecast, by Region 2020 & 2033
- Table 5: Global Packaging Industry in Africa Revenue Million Forecast, by Material 2020 & 2033
- Table 6: Global Packaging Industry in Africa Revenue Million Forecast, by Product Type 2020 & 2033
- Table 7: Global Packaging Industry in Africa Revenue Million Forecast, by End-user Industry 2020 & 2033
- Table 8: Global Packaging Industry in Africa Revenue Million Forecast, by Country 2020 & 2033
- Table 9: United States Packaging Industry in Africa Revenue (Million) Forecast, by Application 2020 & 2033
- Table 10: Canada Packaging Industry in Africa Revenue (Million) Forecast, by Application 2020 & 2033
- Table 11: Mexico Packaging Industry in Africa Revenue (Million) Forecast, by Application 2020 & 2033
- Table 12: Global Packaging Industry in Africa Revenue Million Forecast, by Material 2020 & 2033
- Table 13: Global Packaging Industry in Africa Revenue Million Forecast, by Product Type 2020 & 2033
- Table 14: Global Packaging Industry in Africa Revenue Million Forecast, by End-user Industry 2020 & 2033
- Table 15: Global Packaging Industry in Africa Revenue Million Forecast, by Country 2020 & 2033
- Table 16: Brazil Packaging Industry in Africa Revenue (Million) Forecast, by Application 2020 & 2033
- Table 17: Argentina Packaging Industry in Africa Revenue (Million) Forecast, by Application 2020 & 2033
- Table 18: Rest of South America Packaging Industry in Africa Revenue (Million) Forecast, by Application 2020 & 2033
- Table 19: Global Packaging Industry in Africa Revenue Million Forecast, by Material 2020 & 2033
- Table 20: Global Packaging Industry in Africa Revenue Million Forecast, by Product Type 2020 & 2033
- Table 21: Global Packaging Industry in Africa Revenue Million Forecast, by End-user Industry 2020 & 2033
- Table 22: Global Packaging Industry in Africa Revenue Million Forecast, by Country 2020 & 2033
- Table 23: United Kingdom Packaging Industry in Africa Revenue (Million) Forecast, by Application 2020 & 2033
- Table 24: Germany Packaging Industry in Africa Revenue (Million) Forecast, by Application 2020 & 2033
- Table 25: France Packaging Industry in Africa Revenue (Million) Forecast, by Application 2020 & 2033
- Table 26: Italy Packaging Industry in Africa Revenue (Million) Forecast, by Application 2020 & 2033
- Table 27: Spain Packaging Industry in Africa Revenue (Million) Forecast, by Application 2020 & 2033
- Table 28: Russia Packaging Industry in Africa Revenue (Million) Forecast, by Application 2020 & 2033
- Table 29: Benelux Packaging Industry in Africa Revenue (Million) Forecast, by Application 2020 & 2033
- Table 30: Nordics Packaging Industry in Africa Revenue (Million) Forecast, by Application 2020 & 2033
- Table 31: Rest of Europe Packaging Industry in Africa Revenue (Million) Forecast, by Application 2020 & 2033
- Table 32: Global Packaging Industry in Africa Revenue Million Forecast, by Material 2020 & 2033
- Table 33: Global Packaging Industry in Africa Revenue Million Forecast, by Product Type 2020 & 2033
- Table 34: Global Packaging Industry in Africa Revenue Million Forecast, by End-user Industry 2020 & 2033
- Table 35: Global Packaging Industry in Africa Revenue Million Forecast, by Country 2020 & 2033
- Table 36: Turkey Packaging Industry in Africa Revenue (Million) Forecast, by Application 2020 & 2033
- Table 37: Israel Packaging Industry in Africa Revenue (Million) Forecast, by Application 2020 & 2033
- Table 38: GCC Packaging Industry in Africa Revenue (Million) Forecast, by Application 2020 & 2033
- Table 39: North Africa Packaging Industry in Africa Revenue (Million) Forecast, by Application 2020 & 2033
- Table 40: South Africa Packaging Industry in Africa Revenue (Million) Forecast, by Application 2020 & 2033
- Table 41: Rest of Middle East & Africa Packaging Industry in Africa Revenue (Million) Forecast, by Application 2020 & 2033
- Table 42: Global Packaging Industry in Africa Revenue Million Forecast, by Material 2020 & 2033
- Table 43: Global Packaging Industry in Africa Revenue Million Forecast, by Product Type 2020 & 2033
- Table 44: Global Packaging Industry in Africa Revenue Million Forecast, by End-user Industry 2020 & 2033
- Table 45: Global Packaging Industry in Africa Revenue Million Forecast, by Country 2020 & 2033
- Table 46: China Packaging Industry in Africa Revenue (Million) Forecast, by Application 2020 & 2033
- Table 47: India Packaging Industry in Africa Revenue (Million) Forecast, by Application 2020 & 2033
- Table 48: Japan Packaging Industry in Africa Revenue (Million) Forecast, by Application 2020 & 2033
- Table 49: South Korea Packaging Industry in Africa Revenue (Million) Forecast, by Application 2020 & 2033
- Table 50: ASEAN Packaging Industry in Africa Revenue (Million) Forecast, by Application 2020 & 2033
- Table 51: Oceania Packaging Industry in Africa Revenue (Million) Forecast, by Application 2020 & 2033
- Table 52: Rest of Asia Pacific Packaging Industry in Africa Revenue (Million) Forecast, by Application 2020 & 2033
Frequently Asked Questions
1. What is the projected Compound Annual Growth Rate (CAGR) of the Packaging Industry in Africa?
The projected CAGR is approximately 3.85%.
2. Which companies are prominent players in the Packaging Industry in Africa?
Key companies in the market include Frigoglass South Africa (Pty) Ltd *List Not Exhaustive, Foster Packaging, Nampak Limited, Constantia Afripack (Pty) Ltd, Consol Glass (Pty) Ltd, Mondi Group, Tetra Pak SA, Astrapak Ltd (RPC Group), East African Packaging Industries Ltd (EAPI), Mpact Pty Ltd, Bonpak (Pty) Ltd.
3. What are the main segments of the Packaging Industry in Africa?
The market segments include Material, Product Type, End-user Industry.
4. Can you provide details about the market size?
The market size is estimated to be USD 43.48 Million as of 2022.
5. What are some drivers contributing to market growth?
Glass Bottles to Drive the Market Growth; Beverage Industry to Lead the Market Growth.
6. What are the notable trends driving market growth?
Glass Bottles to Drive the Market Growth.
7. Are there any restraints impacting market growth?
Fluctuation in Raw Material Price can Hinder the Growth of the Market..
8. Can you provide examples of recent developments in the market?
June 2022: Dow expanded the flexible packaging recycling initiative to new African markets. Dow announced that its flexible packaging recycling initiative, project REFLEX, will be expanded to Egypt and Guinea. The expansion of Project REFLEX into Egypt began in December 2021, with Dow entering an 18-month partnership with the international non-government organization, WasteAid, which shares waste management and recycling skills with lower- and middle-income countries. WasteAid will work with Dow to advance waste recovery and recycling in Aswan, a city located in southern Egypt.
9. What pricing options are available for accessing the report?
Pricing options include single-user, multi-user, and enterprise licenses priced at USD 4750, USD 5250, and USD 8750 respectively.
10. Is the market size provided in terms of value or volume?
The market size is provided in terms of value, measured in Million.
11. Are there any specific market keywords associated with the report?
Yes, the market keyword associated with the report is "Packaging Industry in Africa," which aids in identifying and referencing the specific market segment covered.
12. How do I determine which pricing option suits my needs best?
The pricing options vary based on user requirements and access needs. Individual users may opt for single-user licenses, while businesses requiring broader access may choose multi-user or enterprise licenses for cost-effective access to the report.
13. Are there any additional resources or data provided in the Packaging Industry in Africa report?
While the report offers comprehensive insights, it's advisable to review the specific contents or supplementary materials provided to ascertain if additional resources or data are available.
14. How can I stay updated on further developments or reports in the Packaging Industry in Africa?
To stay informed about further developments, trends, and reports in the Packaging Industry in Africa, consider subscribing to industry newsletters, following relevant companies and organizations, or regularly checking reputable industry news sources and publications.
Methodology
Step 1 - Identification of Relevant Samples Size from Population Database


Step 2 - Approaches for Defining Global Market Size (Value, Volume* & Price*)

Note*: In applicable scenarios
Step 3 - Data Sources
Primary Research
- Web Analytics
- Survey Reports
- Research Institute
- Latest Research Reports
- Opinion Leaders
Secondary Research
- Annual Reports
- White Paper
- Latest Press Release
- Industry Association
- Paid Database
- Investor Presentations

Step 4 - Data Triangulation
Involves using different sources of information in order to increase the validity of a study
These sources are likely to be stakeholders in a program - participants, other researchers, program staff, other community members, and so on.
Then we put all data in single framework & apply various statistical tools to find out the dynamic on the market.
During the analysis stage, feedback from the stakeholder groups would be compared to determine areas of agreement as well as areas of divergence