

Key Insights
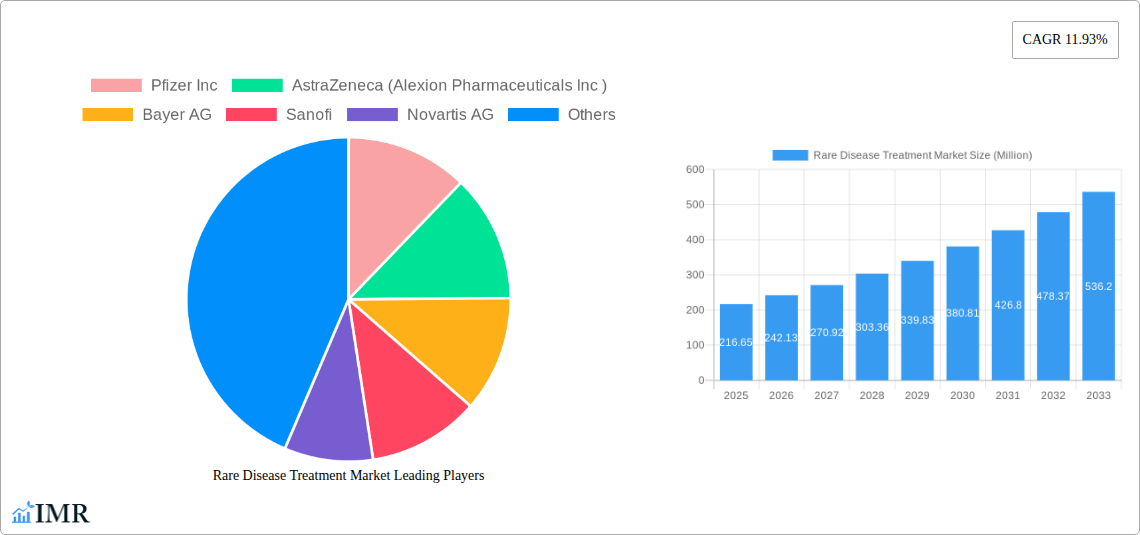
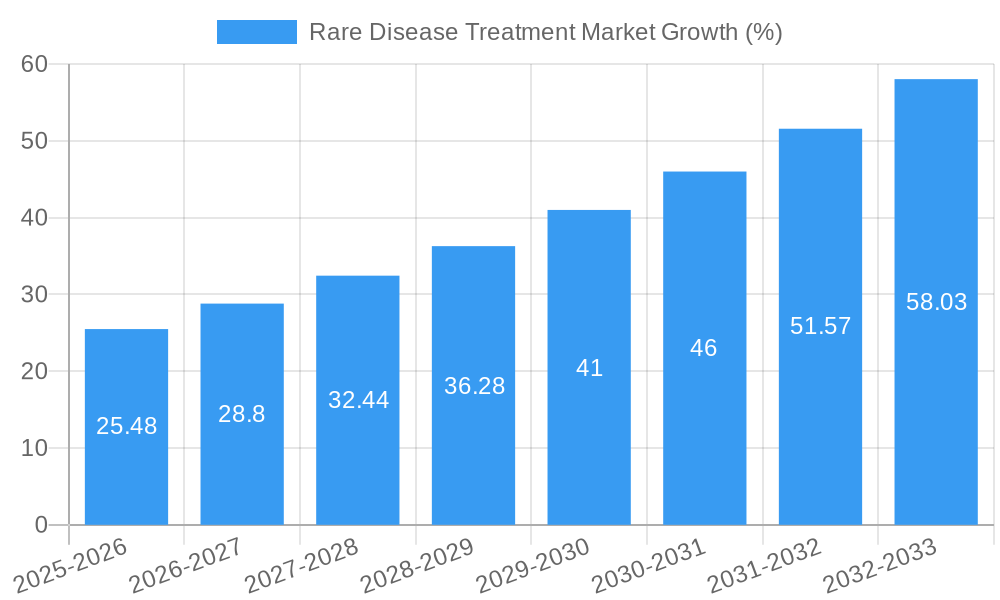
The rare disease treatment market is experiencing robust growth, projected to reach \$216.65 million in 2025 and exhibiting a Compound Annual Growth Rate (CAGR) of 11.93% from 2025 to 2033. This expansion is fueled by several key drivers. Firstly, increasing prevalence of rare diseases globally is a major contributing factor. Secondly, significant advancements in research and development are leading to the approval of novel therapies, many of which are biologics offering targeted and effective treatment options. The rise in investments in orphan drug development, spurred by lucrative market incentives and patient advocacy groups, further bolsters market growth. Furthermore, the increasing awareness and improved diagnostic capabilities are leading to earlier diagnoses and timely interventions, positively impacting treatment outcomes and market demand. Different therapeutic areas within the rare disease spectrum show varying growth trajectories; for example, the oncology and genetic disease segments are anticipated to witness particularly strong expansion due to the high unmet needs and ongoing research focus.
However, the market also faces certain challenges. High drug costs associated with novel therapies, particularly biologics, remain a significant restraint, impacting patient access and market penetration. Regulatory hurdles and lengthy approval processes for orphan drugs also present a bottleneck to market entry for new therapies. Furthermore, the varied clinical manifestations and complexities of rare diseases pose significant challenges to effective treatment and clinical trial design. Despite these challenges, the market's growth trajectory remains positive, with a strong outlook driven by ongoing innovation and the unmet medical needs of a growing patient population. The market is segmented by drug type (biologics and non-biologics), therapeutic area (genetic, neurological, oncology, infectious, cardiovascular diseases and others), and mode of administration (oral, injection, and others). Major players like Pfizer, AstraZeneca, Bayer, Sanofi, and Novartis are actively engaged in developing and commercializing innovative treatments, fostering competition and driving innovation within this dynamic market.
Rare Disease Treatment Market: A Comprehensive Report (2019-2033)
This comprehensive report provides an in-depth analysis of the Rare Disease Treatment Market, encompassing market dynamics, growth trends, regional analysis, product landscape, key players, and future outlook. The study period covers 2019-2033, with a base year of 2025 and a forecast period of 2025-2033. This report is essential for pharmaceutical companies, investors, researchers, and regulatory bodies seeking a thorough understanding of this rapidly evolving market. The parent market is the Pharmaceutical Market and the child market is the Specialty Pharmaceuticals Market.
Rare Disease Treatment Market Dynamics & Structure
The rare disease treatment market is characterized by high concentration among key players, a complex regulatory landscape, and significant technological innovation driving development of novel therapies. Market concentration is high, with the top 15 companies controlling approximately xx% of the market share in 2024. Mergers and acquisitions (M&A) activity has been robust, with xx deals recorded between 2019 and 2024, primarily driven by companies seeking to expand their product portfolios and access new technologies.
- Market Concentration: High, top 15 companies holding xx% market share in 2024.
- Technological Innovation: Focus on gene therapy, CRISPR technology, and personalized medicine.
- Regulatory Framework: Stringent regulatory approvals impacting time to market and development costs.
- Competitive Product Substitutes: Limited for many rare diseases due to disease specificity.
- End-User Demographics: Predominantly patients with unmet medical needs, often requiring specialized care.
- M&A Trends: Increasing consolidation among larger players seeking portfolio expansion and technological advancements. xx deals completed from 2019-2024.
Rare Disease Treatment Market Growth Trends & Insights
The rare disease treatment market exhibits strong growth, driven by increasing prevalence of rare diseases, advancements in diagnostics and therapeutics, and rising healthcare expenditure. The market size is projected to reach xx Million by 2025 and xx Million by 2033, exhibiting a Compound Annual Growth Rate (CAGR) of xx% during the forecast period. This growth is fueled by the increasing adoption of novel therapies, including gene therapies and biologics. Significant market penetration is anticipated in emerging economies due to increasing awareness and improved access to healthcare. Consumer behavior shifts towards personalized medicine are further enhancing growth.
Dominant Regions, Countries, or Segments in Rare Disease Treatment Market
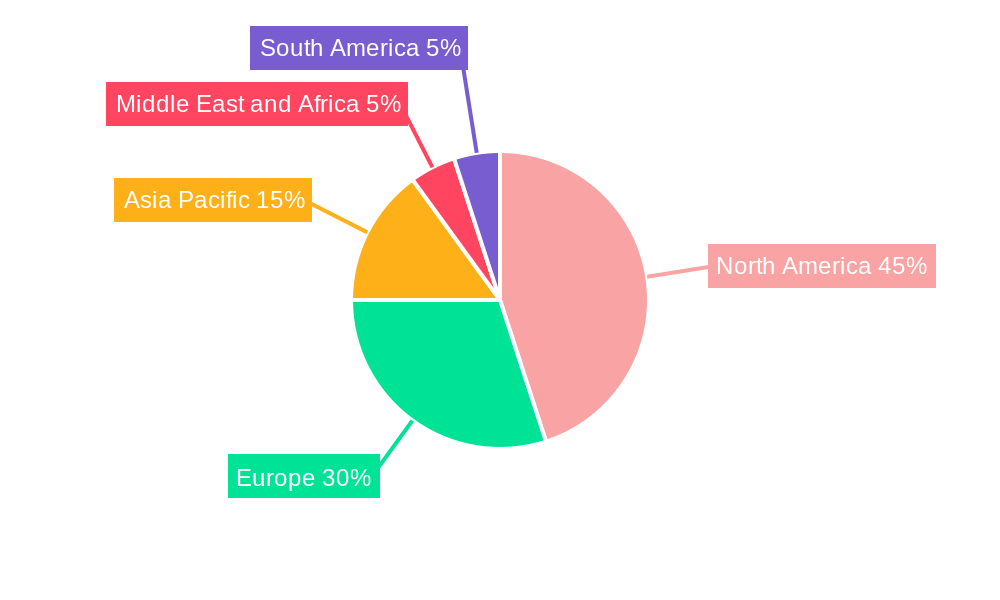
North America currently holds the largest market share, driven by high healthcare expenditure, advanced healthcare infrastructure, and a strong presence of pharmaceutical companies. However, the Asia-Pacific region is projected to witness the fastest growth during the forecast period due to increasing prevalence of rare diseases, rising disposable incomes, and government initiatives promoting healthcare development. Within the segments, Biologics dominate the Drug Type segment, exceeding xx Million in 2024, with Genetic Diseases representing the largest share in the Therapeutic Area segment, driven by advancements in gene therapy. Injection is the dominant Mode of Administration.
- Key Drivers (North America): High healthcare expenditure, robust R&D infrastructure, strong regulatory framework.
- Key Drivers (Asia-Pacific): Rising disposable incomes, increasing awareness of rare diseases, government support.
- Dominant Segments: Biologics (Drug Type), Genetic Diseases (Therapeutic Area), Injection (Mode of Administration).
- Market Share: North America holds the largest market share (xx% in 2024), followed by Europe (xx%) and Asia-Pacific (xx%).
Rare Disease Treatment Market Product Landscape
The rare disease treatment market features a diverse range of products, including biologics, small molecules, and gene therapies. Innovation focuses on targeted therapies with improved efficacy and reduced side effects. Technological advancements include the development of personalized medicine approaches, utilizing genomics and proteomics to tailor treatments to individual patients. This offers unique selling propositions, driving market growth through improved patient outcomes and reduced healthcare costs.
Key Drivers, Barriers & Challenges in Rare Disease Treatment Market
Key Drivers:
- Increased prevalence of rare diseases.
- Advancements in diagnostic technologies and therapeutic approaches.
- Growing healthcare expenditure and insurance coverage.
- Increased government funding for research and development.
Challenges & Restraints:
- High R&D costs and lengthy approval processes.
- Limited market size for individual rare diseases, impacting profitability.
- Complex regulatory landscapes and reimbursement challenges.
- Supply chain disruptions impacting access to therapies. (xx% impact on market growth predicted in 2025 due to raw material shortages).
Emerging Opportunities in Rare Disease Treatment Market
- Expansion into emerging markets with unmet medical needs.
- Development of novel therapies targeting orphan diseases with limited treatment options.
- Personalized medicine approaches, leveraging genomics and proteomics for targeted therapies.
- Strategic partnerships between pharmaceutical companies and research institutions to accelerate innovation.
Growth Accelerators in the Rare Disease Treatment Market Industry
Technological breakthroughs in gene editing and cell therapy are driving significant advancements in rare disease treatment. Strategic partnerships between pharmaceutical companies, research institutions, and patient advocacy groups are crucial for accelerating research and development. Expansion into underserved markets and the development of more affordable therapies will further propel market growth.
Key Players Shaping the Rare Disease Treatment Market Market
- Pfizer Inc
- AstraZeneca (Alexion Pharmaceuticals Inc)
- Bayer AG
- Sanofi
- Novartis AG
- Amgen Inc
- F Hoffmann-La Roche Ltd
- Teva Pharmaceuticals
- Baxter
- Eli Lilly and Company
- Biomarin Pharmaceuticals
- Vertex Pharmaceuticals
- AbbVie Inc
- Eisai Co Ltd
- Bristol-Myers Squibb Company
Notable Milestones in Rare Disease Treatment Market Sector
- October 2022: The National Institutes of Health, the US Food and Drug Administration, ten pharmaceutical companies, and five non-profit groups collaborated to accelerate gene therapy development for rare diseases affecting 30 million Americans. This collaboration significantly impacted market dynamics by fostering innovation and potentially reducing the time to market for new therapies.
- November 2022: Protalix Biotherapeutics Inc. and Chiesi Global Rare Diseases resubmitted the Biologics License Application (BLA) to the FDA for PRX-102 (pegunigalsidasealfa) for Fabry disease. This signifies continued efforts to expand treatment options for rare diseases and could potentially influence market share dynamics upon approval.
In-Depth Rare Disease Treatment Market Market Outlook
The rare disease treatment market is poised for sustained growth, driven by continuous technological advancements, increasing investment in R&D, and growing awareness of rare diseases. Strategic partnerships and collaborations will play a key role in accelerating innovation and expanding access to treatment. The market presents significant opportunities for pharmaceutical companies to develop and commercialize novel therapies, leading to improved patient outcomes and substantial market expansion in the coming years.
Rare Disease Treatment Market Segmentation
-
1. Drug Type
- 1.1. Biologics
- 1.2. Non-biologics
-
2. Therapeutic Area
- 2.1. Genetic Diseases
- 2.2. Neurological Diseases
- 2.3. Oncology
- 2.4. Infectious Diseases
- 2.5. Cardiovascular Diseases
- 2.6. Other Therapeutic Area
-
3. Mode of Administration
- 3.1. Oral
- 3.2. Injection
- 3.3. Other Modes of Administration
Rare Disease Treatment Market Segmentation By Geography
-
1. North America
- 1.1. United States
- 1.2. Canada
- 1.3. Mexico
-
2. Europe
- 2.1. Germany
- 2.2. United Kingdom
- 2.3. France
- 2.4. Italy
- 2.5. Spain
- 2.6. Rest of Europe
-
3. Asia Pacific
- 3.1. China
- 3.2. Japan
- 3.3. India
- 3.4. Australia
- 3.5. South Korea
- 3.6. Rest of Asia Pacific
-
4. Middle East and Africa
- 4.1. GCC
- 4.2. South Africa
- 4.3. Rest of Middle East and Africa
-
5. South America
- 5.1. Brazil
- 5.2. Argentina
- 5.3. Rest of South America
Rare Disease Treatment Market REPORT HIGHLIGHTS
| Aspects | Details |
|---|---|
| Study Period | 2019-2033 |
| Base Year | 2024 |
| Estimated Year | 2025 |
| Forecast Period | 2025-2033 |
| Historical Period | 2019-2024 |
| Growth Rate | CAGR of 11.93% from 2019-2033 |
| Segmentation |
|
Table of Contents
- 1. Introduction
- 1.1. Research Scope
- 1.2. Market Segmentation
- 1.3. Research Methodology
- 1.4. Definitions and Assumptions
- 2. Executive Summary
- 2.1. Introduction
- 3. Market Dynamics
- 3.1. Introduction
- 3.2. Market Drivers
- 3.2.1. Increase in the Number of Rare Disease Cases; Rising R&D Activities for Novel Therapeutics and Drugs and Increase in the Number of New Drug Launches and Favorable Government Policies
- 3.3. Market Restrains
- 3.3.1. Lack of Awareness Regarding Rare Disease Treatment; High Cost of Treatment
- 3.4. Market Trends
- 3.4.1. The Biologics Segment is Expected to Hold a Major Market Share in the Rare Disease Treatment Market
- 4. Market Factor Analysis
- 4.1. Porters Five Forces
- 4.2. Supply/Value Chain
- 4.3. PESTEL analysis
- 4.4. Market Entropy
- 4.5. Patent/Trademark Analysis
- 5. Global Rare Disease Treatment Market Analysis, Insights and Forecast, 2019-2031
- 5.1. Market Analysis, Insights and Forecast - by Drug Type
- 5.1.1. Biologics
- 5.1.2. Non-biologics
- 5.2. Market Analysis, Insights and Forecast - by Therapeutic Area
- 5.2.1. Genetic Diseases
- 5.2.2. Neurological Diseases
- 5.2.3. Oncology
- 5.2.4. Infectious Diseases
- 5.2.5. Cardiovascular Diseases
- 5.2.6. Other Therapeutic Area
- 5.3. Market Analysis, Insights and Forecast - by Mode of Administration
- 5.3.1. Oral
- 5.3.2. Injection
- 5.3.3. Other Modes of Administration
- 5.4. Market Analysis, Insights and Forecast - by Region
- 5.4.1. North America
- 5.4.2. Europe
- 5.4.3. Asia Pacific
- 5.4.4. Middle East and Africa
- 5.4.5. South America
- 5.1. Market Analysis, Insights and Forecast - by Drug Type
- 6. North America Rare Disease Treatment Market Analysis, Insights and Forecast, 2019-2031
- 6.1. Market Analysis, Insights and Forecast - by Drug Type
- 6.1.1. Biologics
- 6.1.2. Non-biologics
- 6.2. Market Analysis, Insights and Forecast - by Therapeutic Area
- 6.2.1. Genetic Diseases
- 6.2.2. Neurological Diseases
- 6.2.3. Oncology
- 6.2.4. Infectious Diseases
- 6.2.5. Cardiovascular Diseases
- 6.2.6. Other Therapeutic Area
- 6.3. Market Analysis, Insights and Forecast - by Mode of Administration
- 6.3.1. Oral
- 6.3.2. Injection
- 6.3.3. Other Modes of Administration
- 6.1. Market Analysis, Insights and Forecast - by Drug Type
- 7. Europe Rare Disease Treatment Market Analysis, Insights and Forecast, 2019-2031
- 7.1. Market Analysis, Insights and Forecast - by Drug Type
- 7.1.1. Biologics
- 7.1.2. Non-biologics
- 7.2. Market Analysis, Insights and Forecast - by Therapeutic Area
- 7.2.1. Genetic Diseases
- 7.2.2. Neurological Diseases
- 7.2.3. Oncology
- 7.2.4. Infectious Diseases
- 7.2.5. Cardiovascular Diseases
- 7.2.6. Other Therapeutic Area
- 7.3. Market Analysis, Insights and Forecast - by Mode of Administration
- 7.3.1. Oral
- 7.3.2. Injection
- 7.3.3. Other Modes of Administration
- 7.1. Market Analysis, Insights and Forecast - by Drug Type
- 8. Asia Pacific Rare Disease Treatment Market Analysis, Insights and Forecast, 2019-2031
- 8.1. Market Analysis, Insights and Forecast - by Drug Type
- 8.1.1. Biologics
- 8.1.2. Non-biologics
- 8.2. Market Analysis, Insights and Forecast - by Therapeutic Area
- 8.2.1. Genetic Diseases
- 8.2.2. Neurological Diseases
- 8.2.3. Oncology
- 8.2.4. Infectious Diseases
- 8.2.5. Cardiovascular Diseases
- 8.2.6. Other Therapeutic Area
- 8.3. Market Analysis, Insights and Forecast - by Mode of Administration
- 8.3.1. Oral
- 8.3.2. Injection
- 8.3.3. Other Modes of Administration
- 8.1. Market Analysis, Insights and Forecast - by Drug Type
- 9. Middle East and Africa Rare Disease Treatment Market Analysis, Insights and Forecast, 2019-2031
- 9.1. Market Analysis, Insights and Forecast - by Drug Type
- 9.1.1. Biologics
- 9.1.2. Non-biologics
- 9.2. Market Analysis, Insights and Forecast - by Therapeutic Area
- 9.2.1. Genetic Diseases
- 9.2.2. Neurological Diseases
- 9.2.3. Oncology
- 9.2.4. Infectious Diseases
- 9.2.5. Cardiovascular Diseases
- 9.2.6. Other Therapeutic Area
- 9.3. Market Analysis, Insights and Forecast - by Mode of Administration
- 9.3.1. Oral
- 9.3.2. Injection
- 9.3.3. Other Modes of Administration
- 9.1. Market Analysis, Insights and Forecast - by Drug Type
- 10. South America Rare Disease Treatment Market Analysis, Insights and Forecast, 2019-2031
- 10.1. Market Analysis, Insights and Forecast - by Drug Type
- 10.1.1. Biologics
- 10.1.2. Non-biologics
- 10.2. Market Analysis, Insights and Forecast - by Therapeutic Area
- 10.2.1. Genetic Diseases
- 10.2.2. Neurological Diseases
- 10.2.3. Oncology
- 10.2.4. Infectious Diseases
- 10.2.5. Cardiovascular Diseases
- 10.2.6. Other Therapeutic Area
- 10.3. Market Analysis, Insights and Forecast - by Mode of Administration
- 10.3.1. Oral
- 10.3.2. Injection
- 10.3.3. Other Modes of Administration
- 10.1. Market Analysis, Insights and Forecast - by Drug Type
- 11. North America Rare Disease Treatment Market Analysis, Insights and Forecast, 2019-2031
- 11.1. Market Analysis, Insights and Forecast - By Country/Sub-region
- 11.1.1 United States
- 11.1.2 Canada
- 11.1.3 Mexico
- 12. Europe Rare Disease Treatment Market Analysis, Insights and Forecast, 2019-2031
- 12.1. Market Analysis, Insights and Forecast - By Country/Sub-region
- 12.1.1 Germany
- 12.1.2 United Kingdom
- 12.1.3 France
- 12.1.4 Italy
- 12.1.5 Spain
- 12.1.6 Rest of Europe
- 13. Asia Pacific Rare Disease Treatment Market Analysis, Insights and Forecast, 2019-2031
- 13.1. Market Analysis, Insights and Forecast - By Country/Sub-region
- 13.1.1 China
- 13.1.2 Japan
- 13.1.3 India
- 13.1.4 Australia
- 13.1.5 South Korea
- 13.1.6 Rest of Asia Pacific
- 14. Middle East and Africa Rare Disease Treatment Market Analysis, Insights and Forecast, 2019-2031
- 14.1. Market Analysis, Insights and Forecast - By Country/Sub-region
- 14.1.1 GCC
- 14.1.2 South Africa
- 14.1.3 Rest of Middle East and Africa
- 15. South America Rare Disease Treatment Market Analysis, Insights and Forecast, 2019-2031
- 15.1. Market Analysis, Insights and Forecast - By Country/Sub-region
- 15.1.1 Brazil
- 15.1.2 Argentina
- 15.1.3 Rest of South America
- 16. Competitive Analysis
- 16.1. Global Market Share Analysis 2024
- 16.2. Company Profiles
- 16.2.1 Pfizer Inc
- 16.2.1.1. Overview
- 16.2.1.2. Products
- 16.2.1.3. SWOT Analysis
- 16.2.1.4. Recent Developments
- 16.2.1.5. Financials (Based on Availability)
- 16.2.2 AstraZeneca (Alexion Pharmaceuticals Inc )
- 16.2.2.1. Overview
- 16.2.2.2. Products
- 16.2.2.3. SWOT Analysis
- 16.2.2.4. Recent Developments
- 16.2.2.5. Financials (Based on Availability)
- 16.2.3 Bayer AG
- 16.2.3.1. Overview
- 16.2.3.2. Products
- 16.2.3.3. SWOT Analysis
- 16.2.3.4. Recent Developments
- 16.2.3.5. Financials (Based on Availability)
- 16.2.4 Sanofi
- 16.2.4.1. Overview
- 16.2.4.2. Products
- 16.2.4.3. SWOT Analysis
- 16.2.4.4. Recent Developments
- 16.2.4.5. Financials (Based on Availability)
- 16.2.5 Novartis AG
- 16.2.5.1. Overview
- 16.2.5.2. Products
- 16.2.5.3. SWOT Analysis
- 16.2.5.4. Recent Developments
- 16.2.5.5. Financials (Based on Availability)
- 16.2.6 Amgen Inc
- 16.2.6.1. Overview
- 16.2.6.2. Products
- 16.2.6.3. SWOT Analysis
- 16.2.6.4. Recent Developments
- 16.2.6.5. Financials (Based on Availability)
- 16.2.7 F Hoffmann-La Roche Ltd
- 16.2.7.1. Overview
- 16.2.7.2. Products
- 16.2.7.3. SWOT Analysis
- 16.2.7.4. Recent Developments
- 16.2.7.5. Financials (Based on Availability)
- 16.2.8 Teva Pharmaceuticals
- 16.2.8.1. Overview
- 16.2.8.2. Products
- 16.2.8.3. SWOT Analysis
- 16.2.8.4. Recent Developments
- 16.2.8.5. Financials (Based on Availability)
- 16.2.9 Baxter
- 16.2.9.1. Overview
- 16.2.9.2. Products
- 16.2.9.3. SWOT Analysis
- 16.2.9.4. Recent Developments
- 16.2.9.5. Financials (Based on Availability)
- 16.2.10 Eli Lilly and Company
- 16.2.10.1. Overview
- 16.2.10.2. Products
- 16.2.10.3. SWOT Analysis
- 16.2.10.4. Recent Developments
- 16.2.10.5. Financials (Based on Availability)
- 16.2.11 Biomarin Pharmaceuticals
- 16.2.11.1. Overview
- 16.2.11.2. Products
- 16.2.11.3. SWOT Analysis
- 16.2.11.4. Recent Developments
- 16.2.11.5. Financials (Based on Availability)
- 16.2.12 Vertex Pharmaceuticals
- 16.2.12.1. Overview
- 16.2.12.2. Products
- 16.2.12.3. SWOT Analysis
- 16.2.12.4. Recent Developments
- 16.2.12.5. Financials (Based on Availability)
- 16.2.13 AbbVie Inc
- 16.2.13.1. Overview
- 16.2.13.2. Products
- 16.2.13.3. SWOT Analysis
- 16.2.13.4. Recent Developments
- 16.2.13.5. Financials (Based on Availability)
- 16.2.14 Eisai Co Ltd
- 16.2.14.1. Overview
- 16.2.14.2. Products
- 16.2.14.3. SWOT Analysis
- 16.2.14.4. Recent Developments
- 16.2.14.5. Financials (Based on Availability)
- 16.2.15 Bristol-Myers Squibb Company
- 16.2.15.1. Overview
- 16.2.15.2. Products
- 16.2.15.3. SWOT Analysis
- 16.2.15.4. Recent Developments
- 16.2.15.5. Financials (Based on Availability)
- 16.2.1 Pfizer Inc
List of Figures
- Figure 1: Global Rare Disease Treatment Market Revenue Breakdown (Million, %) by Region 2024 & 2032
- Figure 2: Global Rare Disease Treatment Market Volume Breakdown (K Unit, %) by Region 2024 & 2032
- Figure 3: North America Rare Disease Treatment Market Revenue (Million), by Country 2024 & 2032
- Figure 4: North America Rare Disease Treatment Market Volume (K Unit), by Country 2024 & 2032
- Figure 5: North America Rare Disease Treatment Market Revenue Share (%), by Country 2024 & 2032
- Figure 6: North America Rare Disease Treatment Market Volume Share (%), by Country 2024 & 2032
- Figure 7: Europe Rare Disease Treatment Market Revenue (Million), by Country 2024 & 2032
- Figure 8: Europe Rare Disease Treatment Market Volume (K Unit), by Country 2024 & 2032
- Figure 9: Europe Rare Disease Treatment Market Revenue Share (%), by Country 2024 & 2032
- Figure 10: Europe Rare Disease Treatment Market Volume Share (%), by Country 2024 & 2032
- Figure 11: Asia Pacific Rare Disease Treatment Market Revenue (Million), by Country 2024 & 2032
- Figure 12: Asia Pacific Rare Disease Treatment Market Volume (K Unit), by Country 2024 & 2032
- Figure 13: Asia Pacific Rare Disease Treatment Market Revenue Share (%), by Country 2024 & 2032
- Figure 14: Asia Pacific Rare Disease Treatment Market Volume Share (%), by Country 2024 & 2032
- Figure 15: Middle East and Africa Rare Disease Treatment Market Revenue (Million), by Country 2024 & 2032
- Figure 16: Middle East and Africa Rare Disease Treatment Market Volume (K Unit), by Country 2024 & 2032
- Figure 17: Middle East and Africa Rare Disease Treatment Market Revenue Share (%), by Country 2024 & 2032
- Figure 18: Middle East and Africa Rare Disease Treatment Market Volume Share (%), by Country 2024 & 2032
- Figure 19: South America Rare Disease Treatment Market Revenue (Million), by Country 2024 & 2032
- Figure 20: South America Rare Disease Treatment Market Volume (K Unit), by Country 2024 & 2032
- Figure 21: South America Rare Disease Treatment Market Revenue Share (%), by Country 2024 & 2032
- Figure 22: South America Rare Disease Treatment Market Volume Share (%), by Country 2024 & 2032
- Figure 23: North America Rare Disease Treatment Market Revenue (Million), by Drug Type 2024 & 2032
- Figure 24: North America Rare Disease Treatment Market Volume (K Unit), by Drug Type 2024 & 2032
- Figure 25: North America Rare Disease Treatment Market Revenue Share (%), by Drug Type 2024 & 2032
- Figure 26: North America Rare Disease Treatment Market Volume Share (%), by Drug Type 2024 & 2032
- Figure 27: North America Rare Disease Treatment Market Revenue (Million), by Therapeutic Area 2024 & 2032
- Figure 28: North America Rare Disease Treatment Market Volume (K Unit), by Therapeutic Area 2024 & 2032
- Figure 29: North America Rare Disease Treatment Market Revenue Share (%), by Therapeutic Area 2024 & 2032
- Figure 30: North America Rare Disease Treatment Market Volume Share (%), by Therapeutic Area 2024 & 2032
- Figure 31: North America Rare Disease Treatment Market Revenue (Million), by Mode of Administration 2024 & 2032
- Figure 32: North America Rare Disease Treatment Market Volume (K Unit), by Mode of Administration 2024 & 2032
- Figure 33: North America Rare Disease Treatment Market Revenue Share (%), by Mode of Administration 2024 & 2032
- Figure 34: North America Rare Disease Treatment Market Volume Share (%), by Mode of Administration 2024 & 2032
- Figure 35: North America Rare Disease Treatment Market Revenue (Million), by Country 2024 & 2032
- Figure 36: North America Rare Disease Treatment Market Volume (K Unit), by Country 2024 & 2032
- Figure 37: North America Rare Disease Treatment Market Revenue Share (%), by Country 2024 & 2032
- Figure 38: North America Rare Disease Treatment Market Volume Share (%), by Country 2024 & 2032
- Figure 39: Europe Rare Disease Treatment Market Revenue (Million), by Drug Type 2024 & 2032
- Figure 40: Europe Rare Disease Treatment Market Volume (K Unit), by Drug Type 2024 & 2032
- Figure 41: Europe Rare Disease Treatment Market Revenue Share (%), by Drug Type 2024 & 2032
- Figure 42: Europe Rare Disease Treatment Market Volume Share (%), by Drug Type 2024 & 2032
- Figure 43: Europe Rare Disease Treatment Market Revenue (Million), by Therapeutic Area 2024 & 2032
- Figure 44: Europe Rare Disease Treatment Market Volume (K Unit), by Therapeutic Area 2024 & 2032
- Figure 45: Europe Rare Disease Treatment Market Revenue Share (%), by Therapeutic Area 2024 & 2032
- Figure 46: Europe Rare Disease Treatment Market Volume Share (%), by Therapeutic Area 2024 & 2032
- Figure 47: Europe Rare Disease Treatment Market Revenue (Million), by Mode of Administration 2024 & 2032
- Figure 48: Europe Rare Disease Treatment Market Volume (K Unit), by Mode of Administration 2024 & 2032
- Figure 49: Europe Rare Disease Treatment Market Revenue Share (%), by Mode of Administration 2024 & 2032
- Figure 50: Europe Rare Disease Treatment Market Volume Share (%), by Mode of Administration 2024 & 2032
- Figure 51: Europe Rare Disease Treatment Market Revenue (Million), by Country 2024 & 2032
- Figure 52: Europe Rare Disease Treatment Market Volume (K Unit), by Country 2024 & 2032
- Figure 53: Europe Rare Disease Treatment Market Revenue Share (%), by Country 2024 & 2032
- Figure 54: Europe Rare Disease Treatment Market Volume Share (%), by Country 2024 & 2032
- Figure 55: Asia Pacific Rare Disease Treatment Market Revenue (Million), by Drug Type 2024 & 2032
- Figure 56: Asia Pacific Rare Disease Treatment Market Volume (K Unit), by Drug Type 2024 & 2032
- Figure 57: Asia Pacific Rare Disease Treatment Market Revenue Share (%), by Drug Type 2024 & 2032
- Figure 58: Asia Pacific Rare Disease Treatment Market Volume Share (%), by Drug Type 2024 & 2032
- Figure 59: Asia Pacific Rare Disease Treatment Market Revenue (Million), by Therapeutic Area 2024 & 2032
- Figure 60: Asia Pacific Rare Disease Treatment Market Volume (K Unit), by Therapeutic Area 2024 & 2032
- Figure 61: Asia Pacific Rare Disease Treatment Market Revenue Share (%), by Therapeutic Area 2024 & 2032
- Figure 62: Asia Pacific Rare Disease Treatment Market Volume Share (%), by Therapeutic Area 2024 & 2032
- Figure 63: Asia Pacific Rare Disease Treatment Market Revenue (Million), by Mode of Administration 2024 & 2032
- Figure 64: Asia Pacific Rare Disease Treatment Market Volume (K Unit), by Mode of Administration 2024 & 2032
- Figure 65: Asia Pacific Rare Disease Treatment Market Revenue Share (%), by Mode of Administration 2024 & 2032
- Figure 66: Asia Pacific Rare Disease Treatment Market Volume Share (%), by Mode of Administration 2024 & 2032
- Figure 67: Asia Pacific Rare Disease Treatment Market Revenue (Million), by Country 2024 & 2032
- Figure 68: Asia Pacific Rare Disease Treatment Market Volume (K Unit), by Country 2024 & 2032
- Figure 69: Asia Pacific Rare Disease Treatment Market Revenue Share (%), by Country 2024 & 2032
- Figure 70: Asia Pacific Rare Disease Treatment Market Volume Share (%), by Country 2024 & 2032
- Figure 71: Middle East and Africa Rare Disease Treatment Market Revenue (Million), by Drug Type 2024 & 2032
- Figure 72: Middle East and Africa Rare Disease Treatment Market Volume (K Unit), by Drug Type 2024 & 2032
- Figure 73: Middle East and Africa Rare Disease Treatment Market Revenue Share (%), by Drug Type 2024 & 2032
- Figure 74: Middle East and Africa Rare Disease Treatment Market Volume Share (%), by Drug Type 2024 & 2032
- Figure 75: Middle East and Africa Rare Disease Treatment Market Revenue (Million), by Therapeutic Area 2024 & 2032
- Figure 76: Middle East and Africa Rare Disease Treatment Market Volume (K Unit), by Therapeutic Area 2024 & 2032
- Figure 77: Middle East and Africa Rare Disease Treatment Market Revenue Share (%), by Therapeutic Area 2024 & 2032
- Figure 78: Middle East and Africa Rare Disease Treatment Market Volume Share (%), by Therapeutic Area 2024 & 2032
- Figure 79: Middle East and Africa Rare Disease Treatment Market Revenue (Million), by Mode of Administration 2024 & 2032
- Figure 80: Middle East and Africa Rare Disease Treatment Market Volume (K Unit), by Mode of Administration 2024 & 2032
- Figure 81: Middle East and Africa Rare Disease Treatment Market Revenue Share (%), by Mode of Administration 2024 & 2032
- Figure 82: Middle East and Africa Rare Disease Treatment Market Volume Share (%), by Mode of Administration 2024 & 2032
- Figure 83: Middle East and Africa Rare Disease Treatment Market Revenue (Million), by Country 2024 & 2032
- Figure 84: Middle East and Africa Rare Disease Treatment Market Volume (K Unit), by Country 2024 & 2032
- Figure 85: Middle East and Africa Rare Disease Treatment Market Revenue Share (%), by Country 2024 & 2032
- Figure 86: Middle East and Africa Rare Disease Treatment Market Volume Share (%), by Country 2024 & 2032
- Figure 87: South America Rare Disease Treatment Market Revenue (Million), by Drug Type 2024 & 2032
- Figure 88: South America Rare Disease Treatment Market Volume (K Unit), by Drug Type 2024 & 2032
- Figure 89: South America Rare Disease Treatment Market Revenue Share (%), by Drug Type 2024 & 2032
- Figure 90: South America Rare Disease Treatment Market Volume Share (%), by Drug Type 2024 & 2032
- Figure 91: South America Rare Disease Treatment Market Revenue (Million), by Therapeutic Area 2024 & 2032
- Figure 92: South America Rare Disease Treatment Market Volume (K Unit), by Therapeutic Area 2024 & 2032
- Figure 93: South America Rare Disease Treatment Market Revenue Share (%), by Therapeutic Area 2024 & 2032
- Figure 94: South America Rare Disease Treatment Market Volume Share (%), by Therapeutic Area 2024 & 2032
- Figure 95: South America Rare Disease Treatment Market Revenue (Million), by Mode of Administration 2024 & 2032
- Figure 96: South America Rare Disease Treatment Market Volume (K Unit), by Mode of Administration 2024 & 2032
- Figure 97: South America Rare Disease Treatment Market Revenue Share (%), by Mode of Administration 2024 & 2032
- Figure 98: South America Rare Disease Treatment Market Volume Share (%), by Mode of Administration 2024 & 2032
- Figure 99: South America Rare Disease Treatment Market Revenue (Million), by Country 2024 & 2032
- Figure 100: South America Rare Disease Treatment Market Volume (K Unit), by Country 2024 & 2032
- Figure 101: South America Rare Disease Treatment Market Revenue Share (%), by Country 2024 & 2032
- Figure 102: South America Rare Disease Treatment Market Volume Share (%), by Country 2024 & 2032
List of Tables
- Table 1: Global Rare Disease Treatment Market Revenue Million Forecast, by Region 2019 & 2032
- Table 2: Global Rare Disease Treatment Market Volume K Unit Forecast, by Region 2019 & 2032
- Table 3: Global Rare Disease Treatment Market Revenue Million Forecast, by Drug Type 2019 & 2032
- Table 4: Global Rare Disease Treatment Market Volume K Unit Forecast, by Drug Type 2019 & 2032
- Table 5: Global Rare Disease Treatment Market Revenue Million Forecast, by Therapeutic Area 2019 & 2032
- Table 6: Global Rare Disease Treatment Market Volume K Unit Forecast, by Therapeutic Area 2019 & 2032
- Table 7: Global Rare Disease Treatment Market Revenue Million Forecast, by Mode of Administration 2019 & 2032
- Table 8: Global Rare Disease Treatment Market Volume K Unit Forecast, by Mode of Administration 2019 & 2032
- Table 9: Global Rare Disease Treatment Market Revenue Million Forecast, by Region 2019 & 2032
- Table 10: Global Rare Disease Treatment Market Volume K Unit Forecast, by Region 2019 & 2032
- Table 11: Global Rare Disease Treatment Market Revenue Million Forecast, by Country 2019 & 2032
- Table 12: Global Rare Disease Treatment Market Volume K Unit Forecast, by Country 2019 & 2032
- Table 13: United States Rare Disease Treatment Market Revenue (Million) Forecast, by Application 2019 & 2032
- Table 14: United States Rare Disease Treatment Market Volume (K Unit) Forecast, by Application 2019 & 2032
- Table 15: Canada Rare Disease Treatment Market Revenue (Million) Forecast, by Application 2019 & 2032
- Table 16: Canada Rare Disease Treatment Market Volume (K Unit) Forecast, by Application 2019 & 2032
- Table 17: Mexico Rare Disease Treatment Market Revenue (Million) Forecast, by Application 2019 & 2032
- Table 18: Mexico Rare Disease Treatment Market Volume (K Unit) Forecast, by Application 2019 & 2032
- Table 19: Global Rare Disease Treatment Market Revenue Million Forecast, by Country 2019 & 2032
- Table 20: Global Rare Disease Treatment Market Volume K Unit Forecast, by Country 2019 & 2032
- Table 21: Germany Rare Disease Treatment Market Revenue (Million) Forecast, by Application 2019 & 2032
- Table 22: Germany Rare Disease Treatment Market Volume (K Unit) Forecast, by Application 2019 & 2032
- Table 23: United Kingdom Rare Disease Treatment Market Revenue (Million) Forecast, by Application 2019 & 2032
- Table 24: United Kingdom Rare Disease Treatment Market Volume (K Unit) Forecast, by Application 2019 & 2032
- Table 25: France Rare Disease Treatment Market Revenue (Million) Forecast, by Application 2019 & 2032
- Table 26: France Rare Disease Treatment Market Volume (K Unit) Forecast, by Application 2019 & 2032
- Table 27: Italy Rare Disease Treatment Market Revenue (Million) Forecast, by Application 2019 & 2032
- Table 28: Italy Rare Disease Treatment Market Volume (K Unit) Forecast, by Application 2019 & 2032
- Table 29: Spain Rare Disease Treatment Market Revenue (Million) Forecast, by Application 2019 & 2032
- Table 30: Spain Rare Disease Treatment Market Volume (K Unit) Forecast, by Application 2019 & 2032
- Table 31: Rest of Europe Rare Disease Treatment Market Revenue (Million) Forecast, by Application 2019 & 2032
- Table 32: Rest of Europe Rare Disease Treatment Market Volume (K Unit) Forecast, by Application 2019 & 2032
- Table 33: Global Rare Disease Treatment Market Revenue Million Forecast, by Country 2019 & 2032
- Table 34: Global Rare Disease Treatment Market Volume K Unit Forecast, by Country 2019 & 2032
- Table 35: China Rare Disease Treatment Market Revenue (Million) Forecast, by Application 2019 & 2032
- Table 36: China Rare Disease Treatment Market Volume (K Unit) Forecast, by Application 2019 & 2032
- Table 37: Japan Rare Disease Treatment Market Revenue (Million) Forecast, by Application 2019 & 2032
- Table 38: Japan Rare Disease Treatment Market Volume (K Unit) Forecast, by Application 2019 & 2032
- Table 39: India Rare Disease Treatment Market Revenue (Million) Forecast, by Application 2019 & 2032
- Table 40: India Rare Disease Treatment Market Volume (K Unit) Forecast, by Application 2019 & 2032
- Table 41: Australia Rare Disease Treatment Market Revenue (Million) Forecast, by Application 2019 & 2032
- Table 42: Australia Rare Disease Treatment Market Volume (K Unit) Forecast, by Application 2019 & 2032
- Table 43: South Korea Rare Disease Treatment Market Revenue (Million) Forecast, by Application 2019 & 2032
- Table 44: South Korea Rare Disease Treatment Market Volume (K Unit) Forecast, by Application 2019 & 2032
- Table 45: Rest of Asia Pacific Rare Disease Treatment Market Revenue (Million) Forecast, by Application 2019 & 2032
- Table 46: Rest of Asia Pacific Rare Disease Treatment Market Volume (K Unit) Forecast, by Application 2019 & 2032
- Table 47: Global Rare Disease Treatment Market Revenue Million Forecast, by Country 2019 & 2032
- Table 48: Global Rare Disease Treatment Market Volume K Unit Forecast, by Country 2019 & 2032
- Table 49: GCC Rare Disease Treatment Market Revenue (Million) Forecast, by Application 2019 & 2032
- Table 50: GCC Rare Disease Treatment Market Volume (K Unit) Forecast, by Application 2019 & 2032
- Table 51: South Africa Rare Disease Treatment Market Revenue (Million) Forecast, by Application 2019 & 2032
- Table 52: South Africa Rare Disease Treatment Market Volume (K Unit) Forecast, by Application 2019 & 2032
- Table 53: Rest of Middle East and Africa Rare Disease Treatment Market Revenue (Million) Forecast, by Application 2019 & 2032
- Table 54: Rest of Middle East and Africa Rare Disease Treatment Market Volume (K Unit) Forecast, by Application 2019 & 2032
- Table 55: Global Rare Disease Treatment Market Revenue Million Forecast, by Country 2019 & 2032
- Table 56: Global Rare Disease Treatment Market Volume K Unit Forecast, by Country 2019 & 2032
- Table 57: Brazil Rare Disease Treatment Market Revenue (Million) Forecast, by Application 2019 & 2032
- Table 58: Brazil Rare Disease Treatment Market Volume (K Unit) Forecast, by Application 2019 & 2032
- Table 59: Argentina Rare Disease Treatment Market Revenue (Million) Forecast, by Application 2019 & 2032
- Table 60: Argentina Rare Disease Treatment Market Volume (K Unit) Forecast, by Application 2019 & 2032
- Table 61: Rest of South America Rare Disease Treatment Market Revenue (Million) Forecast, by Application 2019 & 2032
- Table 62: Rest of South America Rare Disease Treatment Market Volume (K Unit) Forecast, by Application 2019 & 2032
- Table 63: Global Rare Disease Treatment Market Revenue Million Forecast, by Drug Type 2019 & 2032
- Table 64: Global Rare Disease Treatment Market Volume K Unit Forecast, by Drug Type 2019 & 2032
- Table 65: Global Rare Disease Treatment Market Revenue Million Forecast, by Therapeutic Area 2019 & 2032
- Table 66: Global Rare Disease Treatment Market Volume K Unit Forecast, by Therapeutic Area 2019 & 2032
- Table 67: Global Rare Disease Treatment Market Revenue Million Forecast, by Mode of Administration 2019 & 2032
- Table 68: Global Rare Disease Treatment Market Volume K Unit Forecast, by Mode of Administration 2019 & 2032
- Table 69: Global Rare Disease Treatment Market Revenue Million Forecast, by Country 2019 & 2032
- Table 70: Global Rare Disease Treatment Market Volume K Unit Forecast, by Country 2019 & 2032
- Table 71: United States Rare Disease Treatment Market Revenue (Million) Forecast, by Application 2019 & 2032
- Table 72: United States Rare Disease Treatment Market Volume (K Unit) Forecast, by Application 2019 & 2032
- Table 73: Canada Rare Disease Treatment Market Revenue (Million) Forecast, by Application 2019 & 2032
- Table 74: Canada Rare Disease Treatment Market Volume (K Unit) Forecast, by Application 2019 & 2032
- Table 75: Mexico Rare Disease Treatment Market Revenue (Million) Forecast, by Application 2019 & 2032
- Table 76: Mexico Rare Disease Treatment Market Volume (K Unit) Forecast, by Application 2019 & 2032
- Table 77: Global Rare Disease Treatment Market Revenue Million Forecast, by Drug Type 2019 & 2032
- Table 78: Global Rare Disease Treatment Market Volume K Unit Forecast, by Drug Type 2019 & 2032
- Table 79: Global Rare Disease Treatment Market Revenue Million Forecast, by Therapeutic Area 2019 & 2032
- Table 80: Global Rare Disease Treatment Market Volume K Unit Forecast, by Therapeutic Area 2019 & 2032
- Table 81: Global Rare Disease Treatment Market Revenue Million Forecast, by Mode of Administration 2019 & 2032
- Table 82: Global Rare Disease Treatment Market Volume K Unit Forecast, by Mode of Administration 2019 & 2032
- Table 83: Global Rare Disease Treatment Market Revenue Million Forecast, by Country 2019 & 2032
- Table 84: Global Rare Disease Treatment Market Volume K Unit Forecast, by Country 2019 & 2032
- Table 85: Germany Rare Disease Treatment Market Revenue (Million) Forecast, by Application 2019 & 2032
- Table 86: Germany Rare Disease Treatment Market Volume (K Unit) Forecast, by Application 2019 & 2032
- Table 87: United Kingdom Rare Disease Treatment Market Revenue (Million) Forecast, by Application 2019 & 2032
- Table 88: United Kingdom Rare Disease Treatment Market Volume (K Unit) Forecast, by Application 2019 & 2032
- Table 89: France Rare Disease Treatment Market Revenue (Million) Forecast, by Application 2019 & 2032
- Table 90: France Rare Disease Treatment Market Volume (K Unit) Forecast, by Application 2019 & 2032
- Table 91: Italy Rare Disease Treatment Market Revenue (Million) Forecast, by Application 2019 & 2032
- Table 92: Italy Rare Disease Treatment Market Volume (K Unit) Forecast, by Application 2019 & 2032
- Table 93: Spain Rare Disease Treatment Market Revenue (Million) Forecast, by Application 2019 & 2032
- Table 94: Spain Rare Disease Treatment Market Volume (K Unit) Forecast, by Application 2019 & 2032
- Table 95: Rest of Europe Rare Disease Treatment Market Revenue (Million) Forecast, by Application 2019 & 2032
- Table 96: Rest of Europe Rare Disease Treatment Market Volume (K Unit) Forecast, by Application 2019 & 2032
- Table 97: Global Rare Disease Treatment Market Revenue Million Forecast, by Drug Type 2019 & 2032
- Table 98: Global Rare Disease Treatment Market Volume K Unit Forecast, by Drug Type 2019 & 2032
- Table 99: Global Rare Disease Treatment Market Revenue Million Forecast, by Therapeutic Area 2019 & 2032
- Table 100: Global Rare Disease Treatment Market Volume K Unit Forecast, by Therapeutic Area 2019 & 2032
- Table 101: Global Rare Disease Treatment Market Revenue Million Forecast, by Mode of Administration 2019 & 2032
- Table 102: Global Rare Disease Treatment Market Volume K Unit Forecast, by Mode of Administration 2019 & 2032
- Table 103: Global Rare Disease Treatment Market Revenue Million Forecast, by Country 2019 & 2032
- Table 104: Global Rare Disease Treatment Market Volume K Unit Forecast, by Country 2019 & 2032
- Table 105: China Rare Disease Treatment Market Revenue (Million) Forecast, by Application 2019 & 2032
- Table 106: China Rare Disease Treatment Market Volume (K Unit) Forecast, by Application 2019 & 2032
- Table 107: Japan Rare Disease Treatment Market Revenue (Million) Forecast, by Application 2019 & 2032
- Table 108: Japan Rare Disease Treatment Market Volume (K Unit) Forecast, by Application 2019 & 2032
- Table 109: India Rare Disease Treatment Market Revenue (Million) Forecast, by Application 2019 & 2032
- Table 110: India Rare Disease Treatment Market Volume (K Unit) Forecast, by Application 2019 & 2032
- Table 111: Australia Rare Disease Treatment Market Revenue (Million) Forecast, by Application 2019 & 2032
- Table 112: Australia Rare Disease Treatment Market Volume (K Unit) Forecast, by Application 2019 & 2032
- Table 113: South Korea Rare Disease Treatment Market Revenue (Million) Forecast, by Application 2019 & 2032
- Table 114: South Korea Rare Disease Treatment Market Volume (K Unit) Forecast, by Application 2019 & 2032
- Table 115: Rest of Asia Pacific Rare Disease Treatment Market Revenue (Million) Forecast, by Application 2019 & 2032
- Table 116: Rest of Asia Pacific Rare Disease Treatment Market Volume (K Unit) Forecast, by Application 2019 & 2032
- Table 117: Global Rare Disease Treatment Market Revenue Million Forecast, by Drug Type 2019 & 2032
- Table 118: Global Rare Disease Treatment Market Volume K Unit Forecast, by Drug Type 2019 & 2032
- Table 119: Global Rare Disease Treatment Market Revenue Million Forecast, by Therapeutic Area 2019 & 2032
- Table 120: Global Rare Disease Treatment Market Volume K Unit Forecast, by Therapeutic Area 2019 & 2032
- Table 121: Global Rare Disease Treatment Market Revenue Million Forecast, by Mode of Administration 2019 & 2032
- Table 122: Global Rare Disease Treatment Market Volume K Unit Forecast, by Mode of Administration 2019 & 2032
- Table 123: Global Rare Disease Treatment Market Revenue Million Forecast, by Country 2019 & 2032
- Table 124: Global Rare Disease Treatment Market Volume K Unit Forecast, by Country 2019 & 2032
- Table 125: GCC Rare Disease Treatment Market Revenue (Million) Forecast, by Application 2019 & 2032
- Table 126: GCC Rare Disease Treatment Market Volume (K Unit) Forecast, by Application 2019 & 2032
- Table 127: South Africa Rare Disease Treatment Market Revenue (Million) Forecast, by Application 2019 & 2032
- Table 128: South Africa Rare Disease Treatment Market Volume (K Unit) Forecast, by Application 2019 & 2032
- Table 129: Rest of Middle East and Africa Rare Disease Treatment Market Revenue (Million) Forecast, by Application 2019 & 2032
- Table 130: Rest of Middle East and Africa Rare Disease Treatment Market Volume (K Unit) Forecast, by Application 2019 & 2032
- Table 131: Global Rare Disease Treatment Market Revenue Million Forecast, by Drug Type 2019 & 2032
- Table 132: Global Rare Disease Treatment Market Volume K Unit Forecast, by Drug Type 2019 & 2032
- Table 133: Global Rare Disease Treatment Market Revenue Million Forecast, by Therapeutic Area 2019 & 2032
- Table 134: Global Rare Disease Treatment Market Volume K Unit Forecast, by Therapeutic Area 2019 & 2032
- Table 135: Global Rare Disease Treatment Market Revenue Million Forecast, by Mode of Administration 2019 & 2032
- Table 136: Global Rare Disease Treatment Market Volume K Unit Forecast, by Mode of Administration 2019 & 2032
- Table 137: Global Rare Disease Treatment Market Revenue Million Forecast, by Country 2019 & 2032
- Table 138: Global Rare Disease Treatment Market Volume K Unit Forecast, by Country 2019 & 2032
- Table 139: Brazil Rare Disease Treatment Market Revenue (Million) Forecast, by Application 2019 & 2032
- Table 140: Brazil Rare Disease Treatment Market Volume (K Unit) Forecast, by Application 2019 & 2032
- Table 141: Argentina Rare Disease Treatment Market Revenue (Million) Forecast, by Application 2019 & 2032
- Table 142: Argentina Rare Disease Treatment Market Volume (K Unit) Forecast, by Application 2019 & 2032
- Table 143: Rest of South America Rare Disease Treatment Market Revenue (Million) Forecast, by Application 2019 & 2032
- Table 144: Rest of South America Rare Disease Treatment Market Volume (K Unit) Forecast, by Application 2019 & 2032
Frequently Asked Questions
1. What is the projected Compound Annual Growth Rate (CAGR) of the Rare Disease Treatment Market?
The projected CAGR is approximately 11.93%.
2. Which companies are prominent players in the Rare Disease Treatment Market?
Key companies in the market include Pfizer Inc, AstraZeneca (Alexion Pharmaceuticals Inc ), Bayer AG, Sanofi, Novartis AG, Amgen Inc, F Hoffmann-La Roche Ltd, Teva Pharmaceuticals, Baxter, Eli Lilly and Company, Biomarin Pharmaceuticals, Vertex Pharmaceuticals, AbbVie Inc, Eisai Co Ltd, Bristol-Myers Squibb Company.
3. What are the main segments of the Rare Disease Treatment Market?
The market segments include Drug Type, Therapeutic Area, Mode of Administration.
4. Can you provide details about the market size?
The market size is estimated to be USD 216.65 Million as of 2022.
5. What are some drivers contributing to market growth?
Increase in the Number of Rare Disease Cases; Rising R&D Activities for Novel Therapeutics and Drugs and Increase in the Number of New Drug Launches and Favorable Government Policies.
6. What are the notable trends driving market growth?
The Biologics Segment is Expected to Hold a Major Market Share in the Rare Disease Treatment Market.
7. Are there any restraints impacting market growth?
Lack of Awareness Regarding Rare Disease Treatment; High Cost of Treatment.
8. Can you provide examples of recent developments in the market?
November 2022: ProtalixBiotherapeutics Inc. and Chiesi Global Rare Diseases resubmitted the Biologics License Application (BLA) to the United States Food and Drug Administration (FDA) for PRX-102 (pegunigalsidasealfa) for the treatment of adult patients with Fabry disease.
9. What pricing options are available for accessing the report?
Pricing options include single-user, multi-user, and enterprise licenses priced at USD 4750, USD 5250, and USD 8750 respectively.
10. Is the market size provided in terms of value or volume?
The market size is provided in terms of value, measured in Million and volume, measured in K Unit.
11. Are there any specific market keywords associated with the report?
Yes, the market keyword associated with the report is "Rare Disease Treatment Market," which aids in identifying and referencing the specific market segment covered.
12. How do I determine which pricing option suits my needs best?
The pricing options vary based on user requirements and access needs. Individual users may opt for single-user licenses, while businesses requiring broader access may choose multi-user or enterprise licenses for cost-effective access to the report.
13. Are there any additional resources or data provided in the Rare Disease Treatment Market report?
While the report offers comprehensive insights, it's advisable to review the specific contents or supplementary materials provided to ascertain if additional resources or data are available.
14. How can I stay updated on further developments or reports in the Rare Disease Treatment Market?
To stay informed about further developments, trends, and reports in the Rare Disease Treatment Market, consider subscribing to industry newsletters, following relevant companies and organizations, or regularly checking reputable industry news sources and publications.
Methodology
Step 1 - Identification of Relevant Samples Size from Population Database


Step 2 - Approaches for Defining Global Market Size (Value, Volume* & Price*)

Note*: In applicable scenarios
Step 3 - Data Sources
Primary Research
- Web Analytics
- Survey Reports
- Research Institute
- Latest Research Reports
- Opinion Leaders
Secondary Research
- Annual Reports
- White Paper
- Latest Press Release
- Industry Association
- Paid Database
- Investor Presentations

Step 4 - Data Triangulation
Involves using different sources of information in order to increase the validity of a study
These sources are likely to be stakeholders in a program - participants, other researchers, program staff, other community members, and so on.
Then we put all data in single framework & apply various statistical tools to find out the dynamic on the market.
During the analysis stage, feedback from the stakeholder groups would be compared to determine areas of agreement as well as areas of divergence
