

Key Insights
The global sterile antiviral packaging market is poised for significant expansion, with a projected market size of $35.86 billion in 2025, growing at a robust CAGR of 5.22%. This upward trajectory is primarily driven by escalating global health concerns, a heightened demand for pathogen-resistant solutions across the pharmaceutical and healthcare sectors, and increased investments in research and development for advanced packaging technologies. The imperative to protect sensitive medical products from viral contamination throughout their lifecycle, from manufacturing to patient use, underscores the critical role of these specialized packaging materials. Furthermore, stringent regulatory requirements and a growing consumer awareness regarding product safety are compelling manufacturers to adopt high-performance sterile antiviral packaging solutions, thus fueling market growth. Key applications span across pharmaceuticals, medical devices, and diagnostics, where maintaining sterility and preventing viral ingress are paramount.
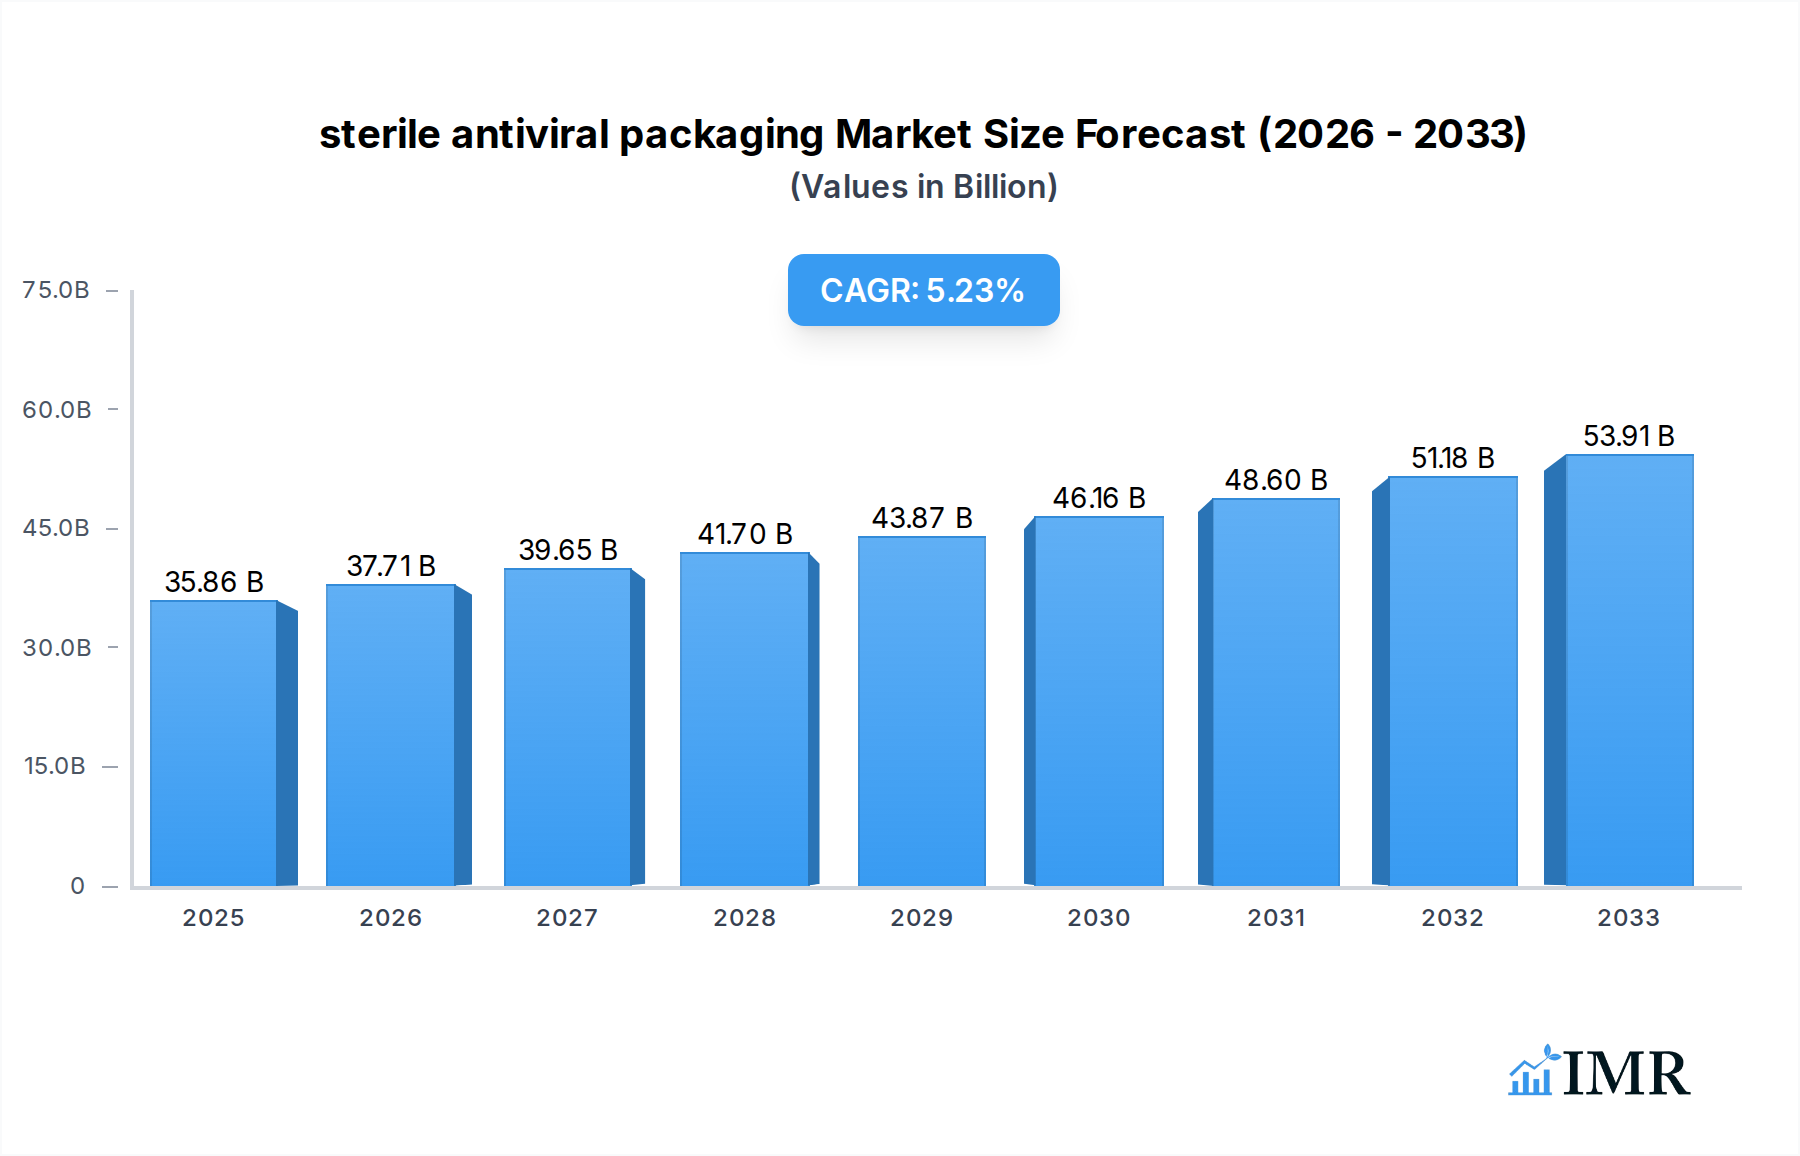
sterile antiviral packaging Market Size (In Billion)
The market's dynamism is further shaped by several key trends, including the adoption of innovative materials with inherent antiviral properties, the development of smart packaging solutions that offer real-time monitoring of sterility, and the increasing preference for sustainable and eco-friendly antiviral packaging options. While the market presents substantial opportunities, certain restraints, such as the high cost associated with advanced antiviral materials and manufacturing processes, and the need for specialized handling and disposal protocols, could temper growth. Nevertheless, the ongoing technological advancements and the continuous evolution of product needs in a post-pandemic world are expected to overcome these challenges, solidifying the sterile antiviral packaging market’s importance in safeguarding public health and ensuring product integrity. The market is segmented by application and type, with leading companies like Dupont, Amcor, and Sonoco Products actively innovating and expanding their offerings.

sterile antiviral packaging Company Market Share
Sterile Antiviral Packaging Market: A Comprehensive Report (2019-2033)
This in-depth report provides a thorough analysis of the global sterile antiviral packaging market, a critical segment experiencing rapid growth driven by increasing healthcare demands and a heightened focus on infection control. Spanning from 2019 to 2033, with a base year of 2025, this study offers invaluable insights for stakeholders including manufacturers, suppliers, research institutions, and investors. We delve into market dynamics, growth trends, regional dominance, product innovation, key drivers, challenges, opportunities, and the strategic landscape shaped by key players. This report is structured to deliver actionable intelligence, covering parent and child market segments to provide a holistic market view.
Sterile Antiviral Packaging Market Dynamics & Structure
The sterile antiviral packaging market exhibits a moderately concentrated structure, with a few key players dominating innovation and production. Technological innovation is primarily driven by the demand for enhanced barrier properties against viruses and bacteria, coupled with sustainability mandates. Regulatory frameworks, particularly those from agencies like the FDA and EMA, are stringent, focusing on material safety, efficacy, and traceability. Competitive product substitutes include conventional sterile packaging with enhanced surface treatments. End-user demographics are diverse, encompassing pharmaceutical companies, medical device manufacturers, and diagnostic kit providers, all prioritizing product integrity and patient safety. Mergers and Acquisitions (M&A) are a notable trend, aimed at consolidating market share, expanding technological capabilities, and gaining access to new geographical regions. For instance, the study identifies an average of 5-8 significant M&A deals annually within the historical period (2019-2024), indicating a proactive consolidation strategy among leading entities. Innovation barriers include the high cost of R&D for novel antiviral materials and the lengthy validation processes required for regulatory approval.
- Market Concentration: Dominated by a mix of large multinational corporations and specialized packaging providers.
- Technological Innovation Drivers: Advancements in material science for inherent antiviral properties, smart packaging solutions, and eco-friendly alternatives.
- Regulatory Frameworks: Strict compliance with global healthcare standards (e.g., ISO 13485, FDA CFR Title 21).
- Competitive Product Substitutes: Traditional sterile packaging, antimicrobial coatings, and novel material composites.
- End-User Demographics: Pharmaceutical (e.g., vaccine packaging), medical devices (e.g., surgical instruments), diagnostics, and biotech sectors.
- M&A Trends: Focus on acquiring innovative technologies, expanding production capacity, and market penetration in emerging economies.
Sterile Antiviral Packaging Growth Trends & Insights
The global sterile antiviral packaging market is poised for robust growth, projected to expand from an estimated $15.5 billion in the base year 2025 to a substantial $28.2 billion by the end of the forecast period in 2033. This represents a Compound Annual Growth Rate (CAGR) of approximately 7.8% during the forecast period. The historical period (2019-2024) witnessed a significant CAGR of 6.5%, laying a strong foundation for future expansion. This growth is primarily fueled by the escalating global healthcare expenditure, a continuous rise in the prevalence of infectious diseases, and an intensified focus on patient safety and infection prevention protocols post-pandemic. The adoption rates of advanced sterile antiviral packaging solutions are accelerating across the pharmaceutical and medical device industries as companies seek to mitigate the risk of contamination and extend product shelf-life. Technological disruptions, such as the integration of active antiviral agents into packaging materials and the development of intelligent packaging systems that monitor environmental conditions, are further stimulating market penetration. Consumer behavior shifts are also playing a crucial role, with end-users increasingly demanding safer and more reliable packaging solutions for critical medical products. The penetration of advanced sterile antiviral packaging in the pharmaceutical sector, particularly for sensitive biologics and vaccines, is expected to reach 55% by 2033, up from an estimated 35% in 2025. The medical device segment is projected to follow a similar trajectory, with market penetration reaching 48% by 2033. The growing demand for personalized medicine and the increasing complexity of drug delivery systems further necessitate sophisticated packaging solutions that can maintain sterility and protect against viral contamination throughout the supply chain. Furthermore, the rise of telemedicine and home healthcare models is creating a demand for robust and secure packaging that can ensure product integrity even outside traditional clinical settings. The report forecasts that the development of biodegradable and recyclable antiviral packaging materials will also be a significant growth driver, aligning with global sustainability initiatives and consumer preferences.
Dominant Regions, Countries, or Segments in Sterile Antiviral Packaging
The Application segment of Pharmaceutical Packaging is emerging as the dominant force in the global sterile antiviral packaging market, projected to account for an estimated 45% of the total market value by 2025 and further expanding its share to 48% by 2033. Within this, the Types segment of Primary Packaging for sterile antiviral applications holds significant sway, driven by the direct contact of packaging with the drug or medical device. This dominance is propelled by several key drivers.
North America currently leads the market, holding an estimated 35% market share in 2025, driven by its robust healthcare infrastructure, high R&D investment in pharmaceuticals and medical devices, and stringent regulatory standards that mandate high-quality packaging. The presence of major pharmaceutical giants and a strong emphasis on patient safety contribute significantly to this leadership. The United States, in particular, is a powerhouse, accounting for approximately 28% of the global market value.
Following closely, Europe represents another crucial market, with an estimated 30% market share in 2025. Countries like Germany, Switzerland, and the United Kingdom are at the forefront, owing to their advanced pharmaceutical manufacturing capabilities and a strong regulatory environment that fosters innovation in packaging solutions. The region's commitment to sustainable packaging practices also influences product development and adoption.
The Asia-Pacific region is exhibiting the fastest growth, with an estimated CAGR of 9.5% during the forecast period. This rapid expansion is attributed to the burgeoning pharmaceutical industry, increasing healthcare spending, and a growing awareness of infection control measures in countries like China, India, and South Korea. Government initiatives to promote domestic manufacturing of medical supplies and pharmaceuticals further fuel this growth. The region is projected to capture 25% of the global market by 2033.
Dominant Application Segment: Pharmaceutical Packaging.
- Key Drivers:
- Strict regulatory requirements for drug safety and efficacy.
- Growing demand for sterile biologics, vaccines, and advanced therapies.
- Increased R&D investment in drug development.
- Rising prevalence of chronic diseases requiring long-term medication.
- Market Share Projection: Expected to grow from approximately $7.0 billion in 2025 to $13.5 billion by 2033.
- Key Drivers:
Dominant Type Segment: Primary Packaging.
- Key Drivers:
- Direct contact with sterile products ensures initial protection.
- Crucial for maintaining the sterility of vials, syringes, and blister packs.
- Advancements in barrier properties and material science for primary packaging.
- Market Share Projection: Expected to account for over 60% of the pharmaceutical packaging segment by 2033.
- Key Drivers:
Leading Region: North America.
- Dominance Factors:
- Advanced healthcare infrastructure and high per capita healthcare spending.
- Presence of leading pharmaceutical and medical device companies.
- Proactive regulatory bodies ensuring product safety.
- Significant investment in R&D and technological innovation.
- Market Share (2025): Approximately 35%.
- Dominance Factors:
Fastest-Growing Region: Asia-Pacific.
- Growth Potential:
- Rapidly expanding pharmaceutical and medical device manufacturing hubs.
- Increasing disposable incomes and healthcare access.
- Growing awareness and adoption of infection control measures.
- Supportive government policies for healthcare sector growth.
- CAGR (2025-2033): Approximately 9.5%.
- Growth Potential:
Sterile Antiviral Packaging Product Landscape
The product landscape for sterile antiviral packaging is characterized by continuous innovation, with a focus on advanced materials that offer inherent antiviral properties and enhanced barrier functionalities. These include specialized polymer films, coated substrates, and multi-layer constructions designed to prevent viral penetration and maintain product sterility throughout the supply chain. Applications span a wide range, from primary packaging for sterile injectables, vials, and syringes to secondary packaging for surgical instruments, diagnostic kits, and personal protective equipment. Performance metrics are paramount, with emphasis on low extractables, leachables, and superior resistance to microbial contamination. Unique selling propositions revolve around validated antiviral efficacy, extended shelf-life capabilities, and compliance with stringent regulatory standards. Technological advancements are also driving the development of smart packaging solutions that integrate features like tamper-evident seals and temperature monitoring, further enhancing product integrity and safety.
Key Drivers, Barriers & Challenges in Sterile Antiviral Packaging
Key Drivers: The sterile antiviral packaging market is primarily propelled by the escalating global demand for infection control and patient safety, particularly amplified by the recent pandemic. Advancements in material science enabling inherent antiviral properties in packaging materials, coupled with strict regulatory mandates for sterile product containment, are significant drivers. The growing pharmaceutical and medical device industries, with their increasing need for reliable and safe packaging for biologics, vaccines, and complex medical devices, also contribute substantially. Furthermore, rising healthcare expenditure in emerging economies and a growing focus on end-to-end supply chain integrity are key growth catalysts.
Key Barriers & Challenges: A significant challenge lies in the high cost of R&D for developing and validating novel antiviral packaging materials, which can be substantial. The stringent and lengthy regulatory approval processes across different regions pose another hurdle, slowing down market entry for new products. Supply chain vulnerabilities, including the availability of specialized raw materials and potential disruptions, can impact production. Competitive pressures from established sterile packaging solutions and the need for cost-effectiveness in a price-sensitive market also present challenges. Additionally, ensuring the long-term efficacy and stability of antiviral properties under various environmental conditions requires extensive testing and validation.
Emerging Opportunities in Sterile Antiviral Packaging
Emerging opportunities in the sterile antiviral packaging market are centered around the development of sustainable and biodegradable antiviral materials, addressing growing environmental concerns without compromising on efficacy. The expansion of personalized medicine and the increasing complexity of drug delivery systems create a demand for tailored sterile antiviral packaging solutions. The burgeoning telemedicine and home healthcare sectors present an opportunity for robust, user-friendly, and securely sealed antiviral packaging that can ensure product integrity outside traditional clinical settings. Furthermore, the integration of advanced technologies like nanotechnology and smart sensors into packaging for enhanced protection, monitoring, and traceability represents a significant untapped market.
Growth Accelerators in the Sterile Antiviral Packaging Industry
The sterile antiviral packaging industry is witnessing accelerated growth driven by several key catalysts. Technological breakthroughs in material science, particularly in creating inherently antiviral polymers and coatings, are revolutionizing product development. Strategic partnerships between packaging manufacturers and pharmaceutical/medical device companies are fostering co-creation and faster adoption of innovative solutions. Market expansion into emerging economies, where healthcare infrastructure and patient safety awareness are rapidly growing, is a significant growth accelerator. The ongoing focus on enhancing drug stability and extending shelf-life through advanced barrier properties also contributes to market expansion, as does the increasing demand for sterile packaging for biologics and complex gene therapies.
Key Players Shaping the Sterile Antiviral Packaging Market
- Dupont
- BillerudKorsnas
- Amcor
- Placon Corporation
- Sonoco Products
- Oliver Healthcare Packaging
- Ampac Holdings
- Wipak Group
Notable Milestones in Sterile Antiviral Packaging Sector
- 2019: DuPont launches new range of advanced antiviral barrier films for pharmaceutical packaging.
- 2020: Amcor announces strategic acquisition of a specialty medical packaging company to bolster its antiviral solutions portfolio.
- 2021: BillerudKorsnas develops innovative paper-based antiviral packaging solutions with enhanced barrier properties.
- 2022: Placon Corporation expands its sterile antiviral packaging production capacity to meet surging demand from the medical device sector.
- 2023: Oliver Healthcare Packaging introduces a new generation of tamper-evident sterile antiviral pouches for critical medical supplies.
- 2024: Sonoco Products announces a breakthrough in sustainable antiviral packaging materials, focusing on recyclability.
- 2024: Wipak Group unveils advanced antiviral lidding films for sterile pharmaceutical applications, featuring extended shelf-life capabilities.
In-Depth Sterile Antiviral Packaging Market Outlook
The outlook for the sterile antiviral packaging market remains exceptionally strong, driven by persistent global health concerns and continuous innovation. Growth accelerators such as advancements in antimicrobial materials, sustainable packaging solutions, and smart packaging technologies will continue to shape the market. Strategic opportunities lie in expanding into developing regions with growing healthcare needs and in catering to the niche requirements of personalized medicine and advanced therapies. The increasing emphasis on supply chain resilience and product integrity will further solidify the demand for high-performance sterile antiviral packaging. The market is anticipated to witness sustained robust growth, offering significant potential for innovation and investment.
sterile antiviral packaging Segmentation
- 1. Application
- 2. Types
sterile antiviral packaging Segmentation By Geography
-
1. North America
- 1.1. United States
- 1.2. Canada
- 1.3. Mexico
-
2. South America
- 2.1. Brazil
- 2.2. Argentina
- 2.3. Rest of South America
-
3. Europe
- 3.1. United Kingdom
- 3.2. Germany
- 3.3. France
- 3.4. Italy
- 3.5. Spain
- 3.6. Russia
- 3.7. Benelux
- 3.8. Nordics
- 3.9. Rest of Europe
-
4. Middle East & Africa
- 4.1. Turkey
- 4.2. Israel
- 4.3. GCC
- 4.4. North Africa
- 4.5. South Africa
- 4.6. Rest of Middle East & Africa
-
5. Asia Pacific
- 5.1. China
- 5.2. India
- 5.3. Japan
- 5.4. South Korea
- 5.5. ASEAN
- 5.6. Oceania
- 5.7. Rest of Asia Pacific
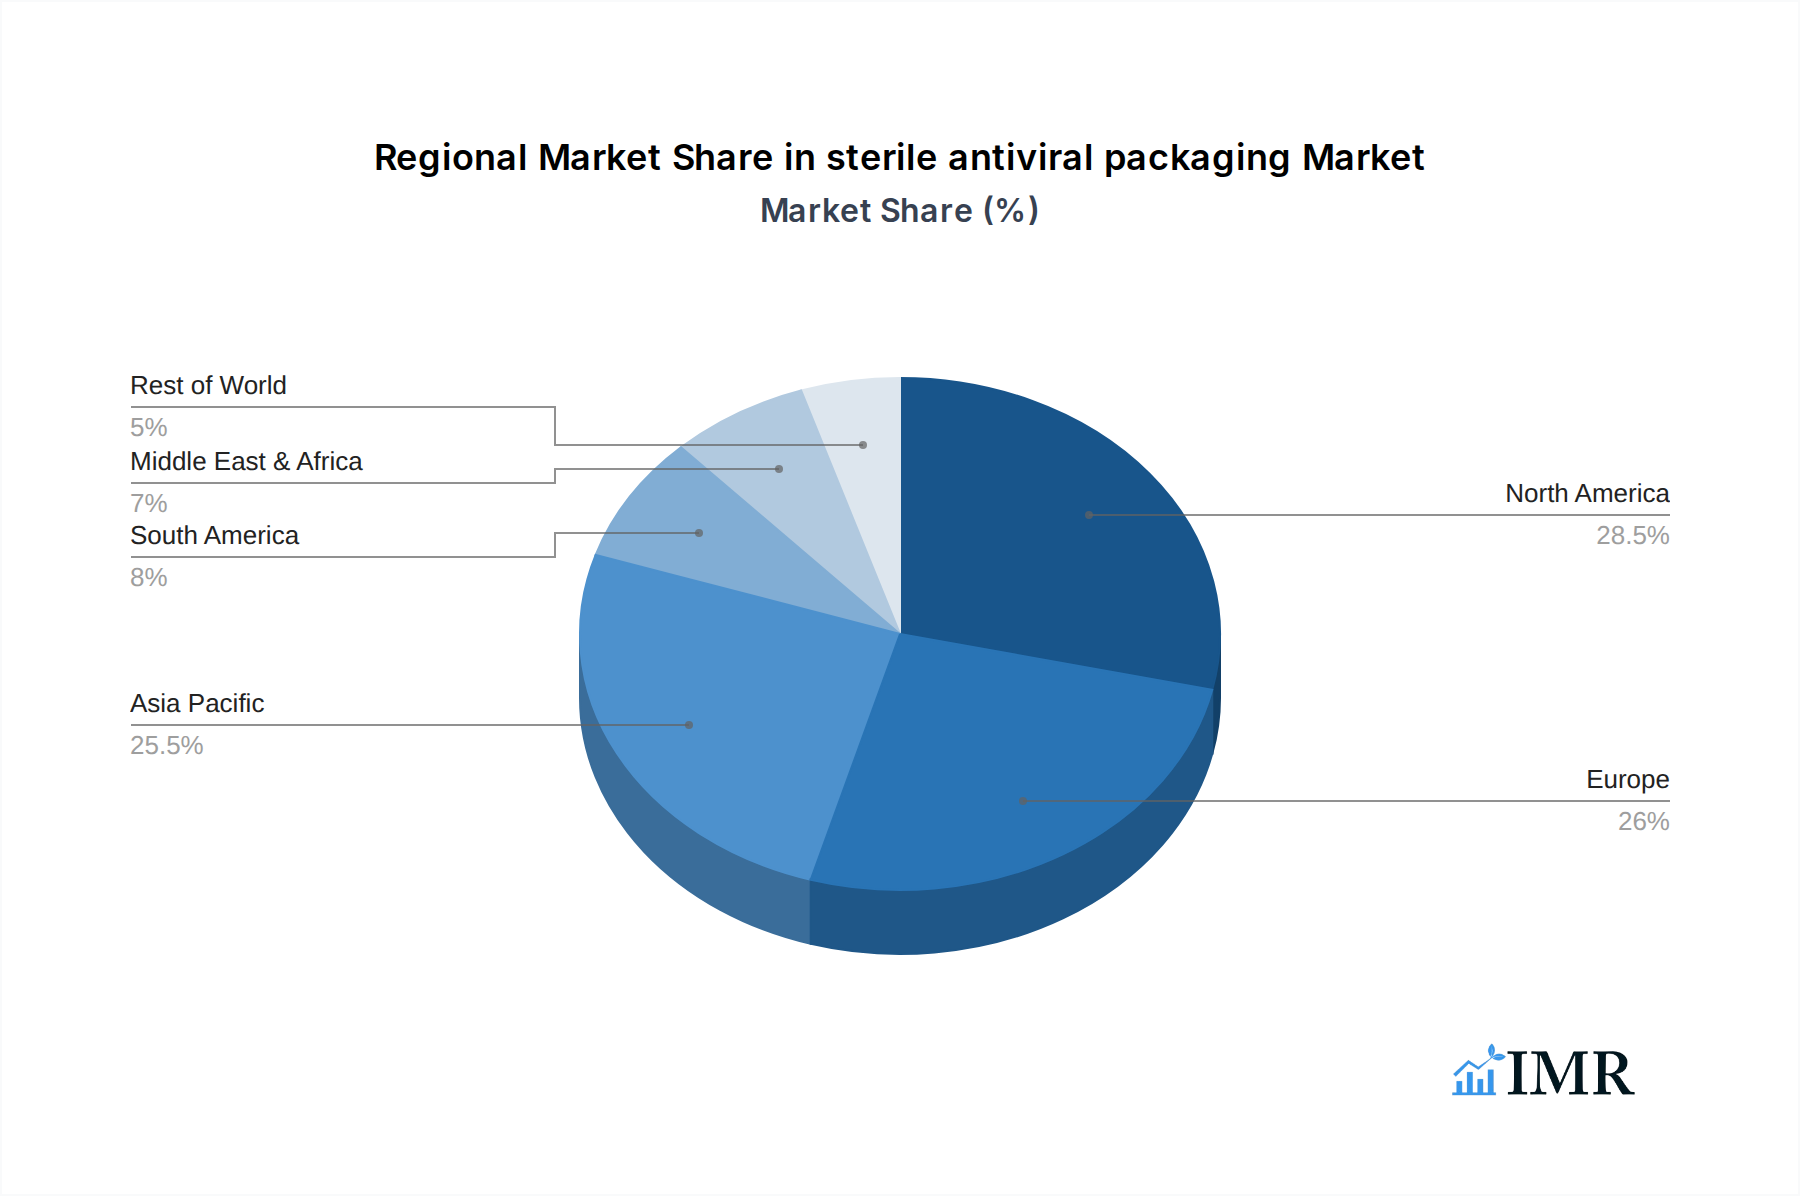
sterile antiviral packaging Regional Market Share
Geographic Coverage of sterile antiviral packaging
sterile antiviral packaging REPORT HIGHLIGHTS
| Aspects | Details |
|---|---|
| Study Period | 2020-2034 |
| Base Year | 2025 |
| Estimated Year | 2026 |
| Forecast Period | 2026-2034 |
| Historical Period | 2020-2025 |
| Growth Rate | CAGR of 5.22% from 2020-2034 |
| Segmentation |
|
Table of Contents
- 1. Introduction
- 1.1. Research Scope
- 1.2. Market Segmentation
- 1.3. Research Objective
- 1.4. Definitions and Assumptions
- 2. Executive Summary
- 2.1. Market Snapshot
- 3. Market Dynamics
- 3.1. Market Drivers
- 3.2. Market Restrains
- 3.3. Market Trends
- 3.4. Market Opportunities
- 4. Market Factor Analysis
- 4.1. Porters Five Forces
- 4.1.1. Bargaining Power of Suppliers
- 4.1.2. Bargaining Power of Buyers
- 4.1.3. Threat of New Entrants
- 4.1.4. Threat of Substitutes
- 4.1.5. Competitive Rivalry
- 4.2. PESTEL analysis
- 4.3. BCG Analysis
- 4.3.1. Stars (High Growth, High Market Share)
- 4.3.2. Cash Cows (Low Growth, High Market Share)
- 4.3.3. Question Mark (High Growth, Low Market Share)
- 4.3.4. Dogs (Low Growth, Low Market Share)
- 4.4. Ansoff Matrix Analysis
- 4.5. Supply Chain Analysis
- 4.6. Regulatory Landscape
- 4.7. Current Market Potential and Opportunity Assessment (TAM–SAM–SOM Framework)
- 4.8. IMR Analyst Note
- 4.1. Porters Five Forces
- 5. Market Analysis, Insights and Forecast 2021-2033
- 5.1. Market Analysis, Insights and Forecast - by Application
- 5.2. Market Analysis, Insights and Forecast - by Types
- 5.3. Market Analysis, Insights and Forecast - by Region
- 5.3.1. North America
- 5.3.2. South America
- 5.3.3. Europe
- 5.3.4. Middle East & Africa
- 5.3.5. Asia Pacific
- 6. Global sterile antiviral packaging Analysis, Insights and Forecast, 2021-2033
- 6.1. Market Analysis, Insights and Forecast - by Application
- 6.2. Market Analysis, Insights and Forecast - by Types
- 7. North America sterile antiviral packaging Analysis, Insights and Forecast, 2020-2032
- 7.1. Market Analysis, Insights and Forecast - by Application
- 7.2. Market Analysis, Insights and Forecast - by Types
- 8. South America sterile antiviral packaging Analysis, Insights and Forecast, 2020-2032
- 8.1. Market Analysis, Insights and Forecast - by Application
- 8.2. Market Analysis, Insights and Forecast - by Types
- 9. Europe sterile antiviral packaging Analysis, Insights and Forecast, 2020-2032
- 9.1. Market Analysis, Insights and Forecast - by Application
- 9.2. Market Analysis, Insights and Forecast - by Types
- 10. Middle East & Africa sterile antiviral packaging Analysis, Insights and Forecast, 2020-2032
- 10.1. Market Analysis, Insights and Forecast - by Application
- 10.2. Market Analysis, Insights and Forecast - by Types
- 11. Asia Pacific sterile antiviral packaging Analysis, Insights and Forecast, 2020-2032
- 11.1. Market Analysis, Insights and Forecast - by Application
- 11.2. Market Analysis, Insights and Forecast - by Types
- 12. Competitive Analysis
- 12.1. Company Profiles
- 12.1.1 Dupont
- 12.1.1.1. Company Overview
- 12.1.1.2. Products
- 12.1.1.3. Company Financials
- 12.1.1.4. SWOT Analysis
- 12.1.2 BillerudKorsnas
- 12.1.2.1. Company Overview
- 12.1.2.2. Products
- 12.1.2.3. Company Financials
- 12.1.2.4. SWOT Analysis
- 12.1.3 Amcor
- 12.1.3.1. Company Overview
- 12.1.3.2. Products
- 12.1.3.3. Company Financials
- 12.1.3.4. SWOT Analysis
- 12.1.4 Placon Corporation
- 12.1.4.1. Company Overview
- 12.1.4.2. Products
- 12.1.4.3. Company Financials
- 12.1.4.4. SWOT Analysis
- 12.1.5 Sonoco Products
- 12.1.5.1. Company Overview
- 12.1.5.2. Products
- 12.1.5.3. Company Financials
- 12.1.5.4. SWOT Analysis
- 12.1.6 Oliver Healthcare Packaging
- 12.1.6.1. Company Overview
- 12.1.6.2. Products
- 12.1.6.3. Company Financials
- 12.1.6.4. SWOT Analysis
- 12.1.7 Ampac Holdings
- 12.1.7.1. Company Overview
- 12.1.7.2. Products
- 12.1.7.3. Company Financials
- 12.1.7.4. SWOT Analysis
- 12.1.8 Wipak Group
- 12.1.8.1. Company Overview
- 12.1.8.2. Products
- 12.1.8.3. Company Financials
- 12.1.8.4. SWOT Analysis
- 12.1.1 Dupont
- 12.2. Market Entropy
- 12.2.1 Company's Key Areas Served
- 12.2.2 Recent Developments
- 12.3. Company Market Share Analysis 2025
- 12.3.1 Top 5 Companies Market Share Analysis
- 12.3.2 Top 3 Companies Market Share Analysis
- 12.4. List of Potential Customers
- 13. Research Methodology
List of Figures
- Figure 1: Global sterile antiviral packaging Revenue Breakdown (undefined, %) by Region 2025 & 2033
- Figure 2: Global sterile antiviral packaging Volume Breakdown (K, %) by Region 2025 & 2033
- Figure 3: North America sterile antiviral packaging Revenue (undefined), by Application 2025 & 2033
- Figure 4: North America sterile antiviral packaging Volume (K), by Application 2025 & 2033
- Figure 5: North America sterile antiviral packaging Revenue Share (%), by Application 2025 & 2033
- Figure 6: North America sterile antiviral packaging Volume Share (%), by Application 2025 & 2033
- Figure 7: North America sterile antiviral packaging Revenue (undefined), by Types 2025 & 2033
- Figure 8: North America sterile antiviral packaging Volume (K), by Types 2025 & 2033
- Figure 9: North America sterile antiviral packaging Revenue Share (%), by Types 2025 & 2033
- Figure 10: North America sterile antiviral packaging Volume Share (%), by Types 2025 & 2033
- Figure 11: North America sterile antiviral packaging Revenue (undefined), by Country 2025 & 2033
- Figure 12: North America sterile antiviral packaging Volume (K), by Country 2025 & 2033
- Figure 13: North America sterile antiviral packaging Revenue Share (%), by Country 2025 & 2033
- Figure 14: North America sterile antiviral packaging Volume Share (%), by Country 2025 & 2033
- Figure 15: South America sterile antiviral packaging Revenue (undefined), by Application 2025 & 2033
- Figure 16: South America sterile antiviral packaging Volume (K), by Application 2025 & 2033
- Figure 17: South America sterile antiviral packaging Revenue Share (%), by Application 2025 & 2033
- Figure 18: South America sterile antiviral packaging Volume Share (%), by Application 2025 & 2033
- Figure 19: South America sterile antiviral packaging Revenue (undefined), by Types 2025 & 2033
- Figure 20: South America sterile antiviral packaging Volume (K), by Types 2025 & 2033
- Figure 21: South America sterile antiviral packaging Revenue Share (%), by Types 2025 & 2033
- Figure 22: South America sterile antiviral packaging Volume Share (%), by Types 2025 & 2033
- Figure 23: South America sterile antiviral packaging Revenue (undefined), by Country 2025 & 2033
- Figure 24: South America sterile antiviral packaging Volume (K), by Country 2025 & 2033
- Figure 25: South America sterile antiviral packaging Revenue Share (%), by Country 2025 & 2033
- Figure 26: South America sterile antiviral packaging Volume Share (%), by Country 2025 & 2033
- Figure 27: Europe sterile antiviral packaging Revenue (undefined), by Application 2025 & 2033
- Figure 28: Europe sterile antiviral packaging Volume (K), by Application 2025 & 2033
- Figure 29: Europe sterile antiviral packaging Revenue Share (%), by Application 2025 & 2033
- Figure 30: Europe sterile antiviral packaging Volume Share (%), by Application 2025 & 2033
- Figure 31: Europe sterile antiviral packaging Revenue (undefined), by Types 2025 & 2033
- Figure 32: Europe sterile antiviral packaging Volume (K), by Types 2025 & 2033
- Figure 33: Europe sterile antiviral packaging Revenue Share (%), by Types 2025 & 2033
- Figure 34: Europe sterile antiviral packaging Volume Share (%), by Types 2025 & 2033
- Figure 35: Europe sterile antiviral packaging Revenue (undefined), by Country 2025 & 2033
- Figure 36: Europe sterile antiviral packaging Volume (K), by Country 2025 & 2033
- Figure 37: Europe sterile antiviral packaging Revenue Share (%), by Country 2025 & 2033
- Figure 38: Europe sterile antiviral packaging Volume Share (%), by Country 2025 & 2033
- Figure 39: Middle East & Africa sterile antiviral packaging Revenue (undefined), by Application 2025 & 2033
- Figure 40: Middle East & Africa sterile antiviral packaging Volume (K), by Application 2025 & 2033
- Figure 41: Middle East & Africa sterile antiviral packaging Revenue Share (%), by Application 2025 & 2033
- Figure 42: Middle East & Africa sterile antiviral packaging Volume Share (%), by Application 2025 & 2033
- Figure 43: Middle East & Africa sterile antiviral packaging Revenue (undefined), by Types 2025 & 2033
- Figure 44: Middle East & Africa sterile antiviral packaging Volume (K), by Types 2025 & 2033
- Figure 45: Middle East & Africa sterile antiviral packaging Revenue Share (%), by Types 2025 & 2033
- Figure 46: Middle East & Africa sterile antiviral packaging Volume Share (%), by Types 2025 & 2033
- Figure 47: Middle East & Africa sterile antiviral packaging Revenue (undefined), by Country 2025 & 2033
- Figure 48: Middle East & Africa sterile antiviral packaging Volume (K), by Country 2025 & 2033
- Figure 49: Middle East & Africa sterile antiviral packaging Revenue Share (%), by Country 2025 & 2033
- Figure 50: Middle East & Africa sterile antiviral packaging Volume Share (%), by Country 2025 & 2033
- Figure 51: Asia Pacific sterile antiviral packaging Revenue (undefined), by Application 2025 & 2033
- Figure 52: Asia Pacific sterile antiviral packaging Volume (K), by Application 2025 & 2033
- Figure 53: Asia Pacific sterile antiviral packaging Revenue Share (%), by Application 2025 & 2033
- Figure 54: Asia Pacific sterile antiviral packaging Volume Share (%), by Application 2025 & 2033
- Figure 55: Asia Pacific sterile antiviral packaging Revenue (undefined), by Types 2025 & 2033
- Figure 56: Asia Pacific sterile antiviral packaging Volume (K), by Types 2025 & 2033
- Figure 57: Asia Pacific sterile antiviral packaging Revenue Share (%), by Types 2025 & 2033
- Figure 58: Asia Pacific sterile antiviral packaging Volume Share (%), by Types 2025 & 2033
- Figure 59: Asia Pacific sterile antiviral packaging Revenue (undefined), by Country 2025 & 2033
- Figure 60: Asia Pacific sterile antiviral packaging Volume (K), by Country 2025 & 2033
- Figure 61: Asia Pacific sterile antiviral packaging Revenue Share (%), by Country 2025 & 2033
- Figure 62: Asia Pacific sterile antiviral packaging Volume Share (%), by Country 2025 & 2033
List of Tables
- Table 1: Global sterile antiviral packaging Revenue undefined Forecast, by Application 2020 & 2033
- Table 2: Global sterile antiviral packaging Volume K Forecast, by Application 2020 & 2033
- Table 3: Global sterile antiviral packaging Revenue undefined Forecast, by Types 2020 & 2033
- Table 4: Global sterile antiviral packaging Volume K Forecast, by Types 2020 & 2033
- Table 5: Global sterile antiviral packaging Revenue undefined Forecast, by Region 2020 & 2033
- Table 6: Global sterile antiviral packaging Volume K Forecast, by Region 2020 & 2033
- Table 7: Global sterile antiviral packaging Revenue undefined Forecast, by Application 2020 & 2033
- Table 8: Global sterile antiviral packaging Volume K Forecast, by Application 2020 & 2033
- Table 9: Global sterile antiviral packaging Revenue undefined Forecast, by Types 2020 & 2033
- Table 10: Global sterile antiviral packaging Volume K Forecast, by Types 2020 & 2033
- Table 11: Global sterile antiviral packaging Revenue undefined Forecast, by Country 2020 & 2033
- Table 12: Global sterile antiviral packaging Volume K Forecast, by Country 2020 & 2033
- Table 13: United States sterile antiviral packaging Revenue (undefined) Forecast, by Application 2020 & 2033
- Table 14: United States sterile antiviral packaging Volume (K) Forecast, by Application 2020 & 2033
- Table 15: Canada sterile antiviral packaging Revenue (undefined) Forecast, by Application 2020 & 2033
- Table 16: Canada sterile antiviral packaging Volume (K) Forecast, by Application 2020 & 2033
- Table 17: Mexico sterile antiviral packaging Revenue (undefined) Forecast, by Application 2020 & 2033
- Table 18: Mexico sterile antiviral packaging Volume (K) Forecast, by Application 2020 & 2033
- Table 19: Global sterile antiviral packaging Revenue undefined Forecast, by Application 2020 & 2033
- Table 20: Global sterile antiviral packaging Volume K Forecast, by Application 2020 & 2033
- Table 21: Global sterile antiviral packaging Revenue undefined Forecast, by Types 2020 & 2033
- Table 22: Global sterile antiviral packaging Volume K Forecast, by Types 2020 & 2033
- Table 23: Global sterile antiviral packaging Revenue undefined Forecast, by Country 2020 & 2033
- Table 24: Global sterile antiviral packaging Volume K Forecast, by Country 2020 & 2033
- Table 25: Brazil sterile antiviral packaging Revenue (undefined) Forecast, by Application 2020 & 2033
- Table 26: Brazil sterile antiviral packaging Volume (K) Forecast, by Application 2020 & 2033
- Table 27: Argentina sterile antiviral packaging Revenue (undefined) Forecast, by Application 2020 & 2033
- Table 28: Argentina sterile antiviral packaging Volume (K) Forecast, by Application 2020 & 2033
- Table 29: Rest of South America sterile antiviral packaging Revenue (undefined) Forecast, by Application 2020 & 2033
- Table 30: Rest of South America sterile antiviral packaging Volume (K) Forecast, by Application 2020 & 2033
- Table 31: Global sterile antiviral packaging Revenue undefined Forecast, by Application 2020 & 2033
- Table 32: Global sterile antiviral packaging Volume K Forecast, by Application 2020 & 2033
- Table 33: Global sterile antiviral packaging Revenue undefined Forecast, by Types 2020 & 2033
- Table 34: Global sterile antiviral packaging Volume K Forecast, by Types 2020 & 2033
- Table 35: Global sterile antiviral packaging Revenue undefined Forecast, by Country 2020 & 2033
- Table 36: Global sterile antiviral packaging Volume K Forecast, by Country 2020 & 2033
- Table 37: United Kingdom sterile antiviral packaging Revenue (undefined) Forecast, by Application 2020 & 2033
- Table 38: United Kingdom sterile antiviral packaging Volume (K) Forecast, by Application 2020 & 2033
- Table 39: Germany sterile antiviral packaging Revenue (undefined) Forecast, by Application 2020 & 2033
- Table 40: Germany sterile antiviral packaging Volume (K) Forecast, by Application 2020 & 2033
- Table 41: France sterile antiviral packaging Revenue (undefined) Forecast, by Application 2020 & 2033
- Table 42: France sterile antiviral packaging Volume (K) Forecast, by Application 2020 & 2033
- Table 43: Italy sterile antiviral packaging Revenue (undefined) Forecast, by Application 2020 & 2033
- Table 44: Italy sterile antiviral packaging Volume (K) Forecast, by Application 2020 & 2033
- Table 45: Spain sterile antiviral packaging Revenue (undefined) Forecast, by Application 2020 & 2033
- Table 46: Spain sterile antiviral packaging Volume (K) Forecast, by Application 2020 & 2033
- Table 47: Russia sterile antiviral packaging Revenue (undefined) Forecast, by Application 2020 & 2033
- Table 48: Russia sterile antiviral packaging Volume (K) Forecast, by Application 2020 & 2033
- Table 49: Benelux sterile antiviral packaging Revenue (undefined) Forecast, by Application 2020 & 2033
- Table 50: Benelux sterile antiviral packaging Volume (K) Forecast, by Application 2020 & 2033
- Table 51: Nordics sterile antiviral packaging Revenue (undefined) Forecast, by Application 2020 & 2033
- Table 52: Nordics sterile antiviral packaging Volume (K) Forecast, by Application 2020 & 2033
- Table 53: Rest of Europe sterile antiviral packaging Revenue (undefined) Forecast, by Application 2020 & 2033
- Table 54: Rest of Europe sterile antiviral packaging Volume (K) Forecast, by Application 2020 & 2033
- Table 55: Global sterile antiviral packaging Revenue undefined Forecast, by Application 2020 & 2033
- Table 56: Global sterile antiviral packaging Volume K Forecast, by Application 2020 & 2033
- Table 57: Global sterile antiviral packaging Revenue undefined Forecast, by Types 2020 & 2033
- Table 58: Global sterile antiviral packaging Volume K Forecast, by Types 2020 & 2033
- Table 59: Global sterile antiviral packaging Revenue undefined Forecast, by Country 2020 & 2033
- Table 60: Global sterile antiviral packaging Volume K Forecast, by Country 2020 & 2033
- Table 61: Turkey sterile antiviral packaging Revenue (undefined) Forecast, by Application 2020 & 2033
- Table 62: Turkey sterile antiviral packaging Volume (K) Forecast, by Application 2020 & 2033
- Table 63: Israel sterile antiviral packaging Revenue (undefined) Forecast, by Application 2020 & 2033
- Table 64: Israel sterile antiviral packaging Volume (K) Forecast, by Application 2020 & 2033
- Table 65: GCC sterile antiviral packaging Revenue (undefined) Forecast, by Application 2020 & 2033
- Table 66: GCC sterile antiviral packaging Volume (K) Forecast, by Application 2020 & 2033
- Table 67: North Africa sterile antiviral packaging Revenue (undefined) Forecast, by Application 2020 & 2033
- Table 68: North Africa sterile antiviral packaging Volume (K) Forecast, by Application 2020 & 2033
- Table 69: South Africa sterile antiviral packaging Revenue (undefined) Forecast, by Application 2020 & 2033
- Table 70: South Africa sterile antiviral packaging Volume (K) Forecast, by Application 2020 & 2033
- Table 71: Rest of Middle East & Africa sterile antiviral packaging Revenue (undefined) Forecast, by Application 2020 & 2033
- Table 72: Rest of Middle East & Africa sterile antiviral packaging Volume (K) Forecast, by Application 2020 & 2033
- Table 73: Global sterile antiviral packaging Revenue undefined Forecast, by Application 2020 & 2033
- Table 74: Global sterile antiviral packaging Volume K Forecast, by Application 2020 & 2033
- Table 75: Global sterile antiviral packaging Revenue undefined Forecast, by Types 2020 & 2033
- Table 76: Global sterile antiviral packaging Volume K Forecast, by Types 2020 & 2033
- Table 77: Global sterile antiviral packaging Revenue undefined Forecast, by Country 2020 & 2033
- Table 78: Global sterile antiviral packaging Volume K Forecast, by Country 2020 & 2033
- Table 79: China sterile antiviral packaging Revenue (undefined) Forecast, by Application 2020 & 2033
- Table 80: China sterile antiviral packaging Volume (K) Forecast, by Application 2020 & 2033
- Table 81: India sterile antiviral packaging Revenue (undefined) Forecast, by Application 2020 & 2033
- Table 82: India sterile antiviral packaging Volume (K) Forecast, by Application 2020 & 2033
- Table 83: Japan sterile antiviral packaging Revenue (undefined) Forecast, by Application 2020 & 2033
- Table 84: Japan sterile antiviral packaging Volume (K) Forecast, by Application 2020 & 2033
- Table 85: South Korea sterile antiviral packaging Revenue (undefined) Forecast, by Application 2020 & 2033
- Table 86: South Korea sterile antiviral packaging Volume (K) Forecast, by Application 2020 & 2033
- Table 87: ASEAN sterile antiviral packaging Revenue (undefined) Forecast, by Application 2020 & 2033
- Table 88: ASEAN sterile antiviral packaging Volume (K) Forecast, by Application 2020 & 2033
- Table 89: Oceania sterile antiviral packaging Revenue (undefined) Forecast, by Application 2020 & 2033
- Table 90: Oceania sterile antiviral packaging Volume (K) Forecast, by Application 2020 & 2033
- Table 91: Rest of Asia Pacific sterile antiviral packaging Revenue (undefined) Forecast, by Application 2020 & 2033
- Table 92: Rest of Asia Pacific sterile antiviral packaging Volume (K) Forecast, by Application 2020 & 2033
Frequently Asked Questions
1. What is the projected Compound Annual Growth Rate (CAGR) of the sterile antiviral packaging?
The projected CAGR is approximately 5.22%.
2. Which companies are prominent players in the sterile antiviral packaging?
Key companies in the market include Dupont, BillerudKorsnas, Amcor, Placon Corporation, Sonoco Products, Oliver Healthcare Packaging, Ampac Holdings, Wipak Group.
3. What are the main segments of the sterile antiviral packaging?
The market segments include Application, Types.
4. Can you provide details about the market size?
The market size is estimated to be USD XXX N/A as of 2022.
5. What are some drivers contributing to market growth?
N/A
6. What are the notable trends driving market growth?
N/A
7. Are there any restraints impacting market growth?
N/A
8. Can you provide examples of recent developments in the market?
N/A
9. What pricing options are available for accessing the report?
Pricing options include single-user, multi-user, and enterprise licenses priced at USD 4350.00, USD 6525.00, and USD 8700.00 respectively.
10. Is the market size provided in terms of value or volume?
The market size is provided in terms of value, measured in N/A and volume, measured in K.
11. Are there any specific market keywords associated with the report?
Yes, the market keyword associated with the report is "sterile antiviral packaging," which aids in identifying and referencing the specific market segment covered.
12. How do I determine which pricing option suits my needs best?
The pricing options vary based on user requirements and access needs. Individual users may opt for single-user licenses, while businesses requiring broader access may choose multi-user or enterprise licenses for cost-effective access to the report.
13. Are there any additional resources or data provided in the sterile antiviral packaging report?
While the report offers comprehensive insights, it's advisable to review the specific contents or supplementary materials provided to ascertain if additional resources or data are available.
14. How can I stay updated on further developments or reports in the sterile antiviral packaging?
To stay informed about further developments, trends, and reports in the sterile antiviral packaging, consider subscribing to industry newsletters, following relevant companies and organizations, or regularly checking reputable industry news sources and publications.
Methodology
Step 1 - Identification of Relevant Samples Size from Population Database


Step 2 - Approaches for Defining Global Market Size (Value, Volume* & Price*)

Note*: In applicable scenarios
Step 3 - Data Sources
Primary Research
- Web Analytics
- Survey Reports
- Research Institute
- Latest Research Reports
- Opinion Leaders
Secondary Research
- Annual Reports
- White Paper
- Latest Press Release
- Industry Association
- Paid Database
- Investor Presentations

Step 4 - Data Triangulation
Involves using different sources of information in order to increase the validity of a study
These sources are likely to be stakeholders in a program - participants, other researchers, program staff, other community members, and so on.
Then we put all data in single framework & apply various statistical tools to find out the dynamic on the market.
During the analysis stage, feedback from the stakeholder groups would be compared to determine areas of agreement as well as areas of divergence