

Key Insights
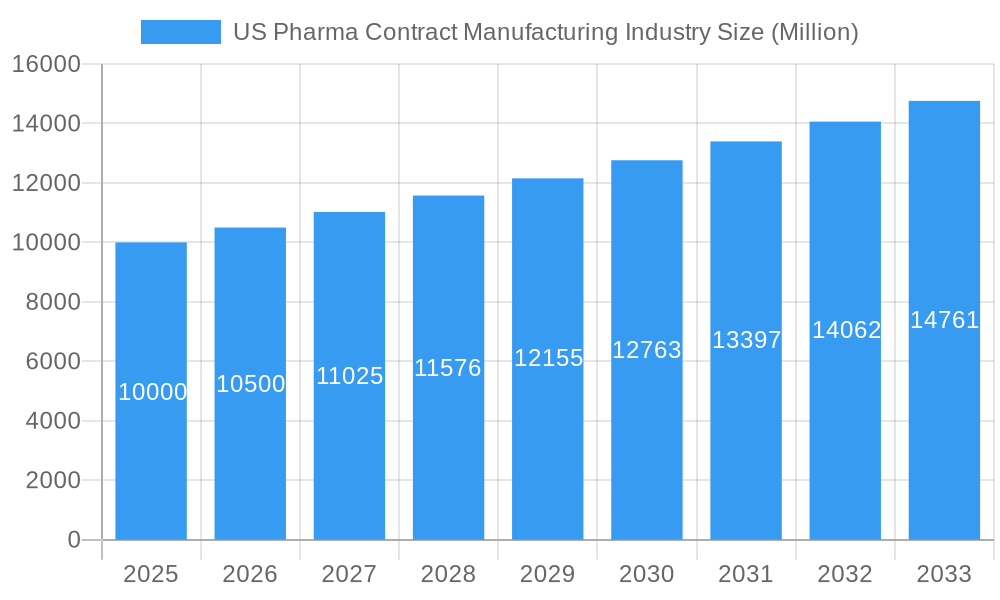
The US pharma contract manufacturing market, valued at approximately $XX billion in 2025, is projected to experience robust growth, exhibiting a Compound Annual Growth Rate (CAGR) of 5.00% from 2025 to 2033. This expansion is fueled by several key drivers. Firstly, the increasing complexity of drug development and manufacturing necessitates outsourcing for pharmaceutical companies seeking to optimize efficiency and reduce costs. Secondly, the rising demand for specialized services like High Potency API (HPAPI) manufacturing and advanced dosage forms (e.g., injectables) further propels market growth. This trend is particularly evident in the Northeast and West regions of the US, which boast established pharmaceutical clusters and a concentration of contract manufacturing organizations (CMOs). Furthermore, the growing focus on biologics and cell-based therapies creates opportunities for CMOs with specialized capabilities in these areas. However, challenges such as stringent regulatory requirements and the need for robust quality control systems act as potential restraints.
US Pharma Contract Manufacturing Industry Market Size (In Billion)
The market segmentation reveals a significant contribution from Active Pharmaceutical Ingredient (API) manufacturing, with Finished Dosage Formulation (FDF) development and manufacturing, particularly HPAPI and injectable formulations, showing strong growth potential. Major players like Thermo Fisher Scientific (Patheon), Siegfried AG, and Catalent Inc., along with other prominent CMOs, are strategically positioning themselves to capitalize on these trends through acquisitions, capacity expansions, and technological advancements. The competitive landscape is characterized by both large multinational companies and specialized niche players, creating a dynamic and evolving market. Future growth will likely be influenced by technological innovations, evolving regulatory landscapes, and the increasing demand for personalized and targeted therapies. Geographical expansion within the US and strategic partnerships are expected to remain key growth strategies for companies in this sector.
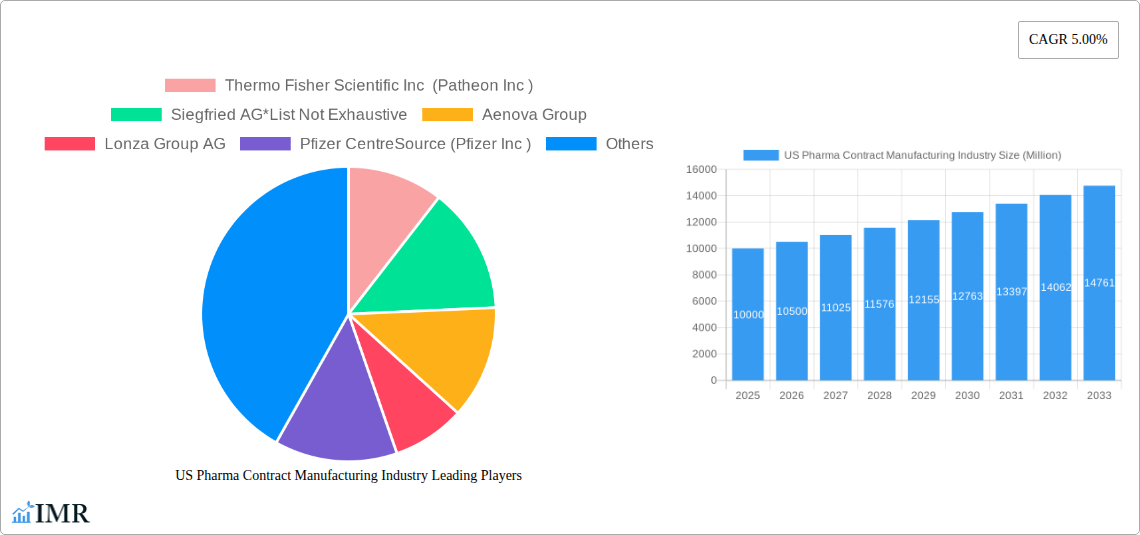
US Pharma Contract Manufacturing Industry Company Market Share
US Pharma Contract Manufacturing Industry: 2019-2033 Market Report
This comprehensive report provides an in-depth analysis of the US Pharma Contract Manufacturing industry, offering critical insights for stakeholders across the pharmaceutical value chain. From API manufacturing to finished dosage formulation and secondary packaging, this report covers the entire spectrum, projecting market trends through 2033. The report utilizes data from the historical period (2019-2024), the base year (2025), and the forecast period (2025-2033) to offer a robust and reliable forecast. Key segments analyzed include Active Pharmaceutical Ingredient (API) Manufacturing, High Potency API (HPAPI) Finished Dosage Formulation (FDF) Development and Manufacturing, and Injectable Dose Formulation and Secondary Packaging.
US Pharma Contract Manufacturing Industry Market Dynamics & Structure
The US pharma contract manufacturing market is characterized by a moderately concentrated landscape with a few large players holding significant market share. Thermo Fisher Scientific Inc (Patheon Inc), Siegfried AG, Aenova Group, Lonza Group AG, and Catalent Inc are among the key players, constantly engaging in mergers and acquisitions (M&A) to expand their capabilities and market reach. Technological advancements, particularly in automation and process analytics, are driving efficiency and innovation. Stringent regulatory frameworks from the FDA necessitate robust quality control and compliance measures. The market also faces competitive pressure from both domestic and international contract manufacturers. The aging population and increasing prevalence of chronic diseases fuel demand for pharmaceutical products, creating opportunities for contract manufacturers.
- Market Concentration: High, with top 5 players holding approximately xx% of the market share in 2025.
- M&A Activity: Average of xx deals annually in the historical period (2019-2024), projected to increase to xx deals annually during the forecast period (2025-2033).
- Technological Innovation: Significant investments in automation, AI, and advanced analytics are driving efficiency and improving product quality.
- Regulatory Landscape: Stringent FDA guidelines create barriers to entry but also ensure product safety and quality.
- Competitive Landscape: Intense competition among established players and emerging contract manufacturers.
US Pharma Contract Manufacturing Industry Growth Trends & Insights
The US pharma contract manufacturing market is experiencing robust growth, driven by several factors. The increasing outsourcing of drug manufacturing by pharmaceutical companies, a trend fueled by cost optimization and a focus on core competencies, significantly boosts this sector. Technological advancements are enhancing manufacturing efficiency and enabling the production of complex drug formulations. The growing demand for specialized services, such as HPAPI manufacturing and aseptic filling, further fuels market expansion. The market exhibits a CAGR of xx% during the historical period (2019-2024) and is projected to grow at a CAGR of xx% during the forecast period (2025-2033), reaching a market size of $xx billion by 2033. Increased adoption of advanced analytical techniques for quality control and process optimization contributes to the sector’s growth.
Dominant Regions, Countries, or Segments in US Pharma Contract Manufacturing Industry
The Northeast and Southeast regions of the US are currently dominating the pharma contract manufacturing market, driven by existing infrastructure, proximity to major pharmaceutical companies, and a skilled workforce. Within the service types, Active Pharmaceutical Ingredient (API) Manufacturing commands a larger market share owing to its foundational role in drug production. However, High Potency API (HPAPI) manufacturing and injectable dose formulation, including secondary packaging, demonstrate significant growth potential, driven by the rising demand for specialized medications and biologics.
- Key Drivers: Established infrastructure, skilled labor pool, favorable regulatory environment, proximity to major pharmaceutical hubs.
- Market Share: Northeast and Southeast regions account for xx% of the total market in 2025.
- Growth Potential: HPAPI and Injectable Formulation segments are projected to grow at a faster rate than API manufacturing during the forecast period.
US Pharma Contract Manufacturing Industry Product Landscape
The product landscape is characterized by a shift towards advanced manufacturing technologies, including continuous manufacturing, single-use technologies, and advanced analytics for real-time process monitoring and control. These advancements enhance efficiency, reduce costs, and ensure higher product quality. Contract manufacturers are offering increasingly specialized services to cater to diverse client needs, including personalized medicine and cell & gene therapy manufacturing. The focus is on customized solutions, flexibility, and stringent quality control, meeting the evolving demands of the pharmaceutical industry.
Key Drivers, Barriers & Challenges in US Pharma Contract Manufacturing Industry
Key Drivers: Increasing outsourcing by pharmaceutical companies, technological advancements, growing demand for specialized services, rising prevalence of chronic diseases, and government initiatives supporting domestic manufacturing.
Challenges: Stringent regulatory compliance requirements (increasing costs and delays), supply chain disruptions impacting raw material availability, skilled labor shortages, and intense competition from both domestic and international players. The cost of implementing new technologies and complying with stricter regulations can pose substantial financial burdens. Supply chain disruptions during the historical period (2019-2024) resulted in xx% increase in manufacturing costs for some contract manufacturers.
Emerging Opportunities in US Pharma Contract Manufacturing Industry
Emerging opportunities lie in the growing demand for personalized medicines, cell and gene therapies, and advanced drug delivery systems. Expansion into emerging markets and strategic partnerships with pharmaceutical companies to offer integrated services can drive growth. Adoption of Industry 4.0 technologies, including automation and digitalization, offers significant efficiency gains and cost reductions. Focus on sustainable manufacturing practices also presents a promising avenue for growth.
Growth Accelerators in the US Pharma Contract Manufacturing Industry
Technological advancements, such as continuous manufacturing and advanced analytics, are major growth accelerators. Strategic partnerships and collaborations with pharmaceutical companies to develop new drugs and therapies provide sustained growth opportunities. Investing in research and development to expand service offerings into high-growth areas like cell and gene therapy will drive long-term growth and sustainability. Global expansion and market diversification can also significantly accelerate growth.
Key Players Shaping the US Pharma Contract Manufacturing Industry Market
- Thermo Fisher Scientific Inc (Patheon Inc)
- Siegfried AG
- Aenova Group
- Lonza Group AG
- Pfizer CentreSource (Pfizer Inc)
- Jubilant Life Sciences Ltd
- Catalent Inc
- AbbVie Contract Manufacturing
- Boehringer Ingelheim Group
- Recipharm AB
- Baxter Biopharma Solutions (Baxter International Inc)
Notable Milestones in US Pharma Contract Manufacturing Industry Sector
- 2020: Increased focus on digitalization and automation in response to COVID-19 supply chain disruptions.
- 2021: Several major M&A deals consolidate market share among leading players.
- 2022: FDA approval of several new innovative drug products manufactured by contract manufacturers.
- 2023: Significant investments in continuous manufacturing and single-use technologies.
- 2024: Growing adoption of advanced analytics for process optimization and quality control.
In-Depth US Pharma Contract Manufacturing Industry Market Outlook
The US pharma contract manufacturing market is poised for sustained growth over the next decade, driven by continuous technological innovation, increasing outsourcing by pharmaceutical companies, and the rising demand for specialized services. Strategic partnerships, expansion into high-growth therapeutic areas, and a focus on sustainable and efficient manufacturing practices will be key to success for market players. The market will see increasing consolidation through M&A activity, and players that can offer comprehensive and integrated solutions will hold a competitive edge. The forecast period promises substantial growth, creating significant opportunities for players who can adapt to the evolving regulatory landscape and technological advancements.
US Pharma Contract Manufacturing Industry Segmentation
-
1. Service Type
-
1.1. Active P
- 1.1.1. Small Molecule
- 1.1.2. Large Molecule
- 1.1.3. High Potency API (HPAPI)
-
1.2. Finished
- 1.2.1. Solid Dose Formulation
- 1.2.2. Liquid Dose Formulation
- 1.2.3. Injectable Dose Formulation
- 1.3. Secondary Packaging
-
1.1. Active P
US Pharma Contract Manufacturing Industry Segmentation By Geography
-
1. North America
- 1.1. United States
- 1.2. Canada
- 1.3. Mexico
-
2. South America
- 2.1. Brazil
- 2.2. Argentina
- 2.3. Rest of South America
-
3. Europe
- 3.1. United Kingdom
- 3.2. Germany
- 3.3. France
- 3.4. Italy
- 3.5. Spain
- 3.6. Russia
- 3.7. Benelux
- 3.8. Nordics
- 3.9. Rest of Europe
-
4. Middle East & Africa
- 4.1. Turkey
- 4.2. Israel
- 4.3. GCC
- 4.4. North Africa
- 4.5. South Africa
- 4.6. Rest of Middle East & Africa
-
5. Asia Pacific
- 5.1. China
- 5.2. India
- 5.3. Japan
- 5.4. South Korea
- 5.5. ASEAN
- 5.6. Oceania
- 5.7. Rest of Asia Pacific
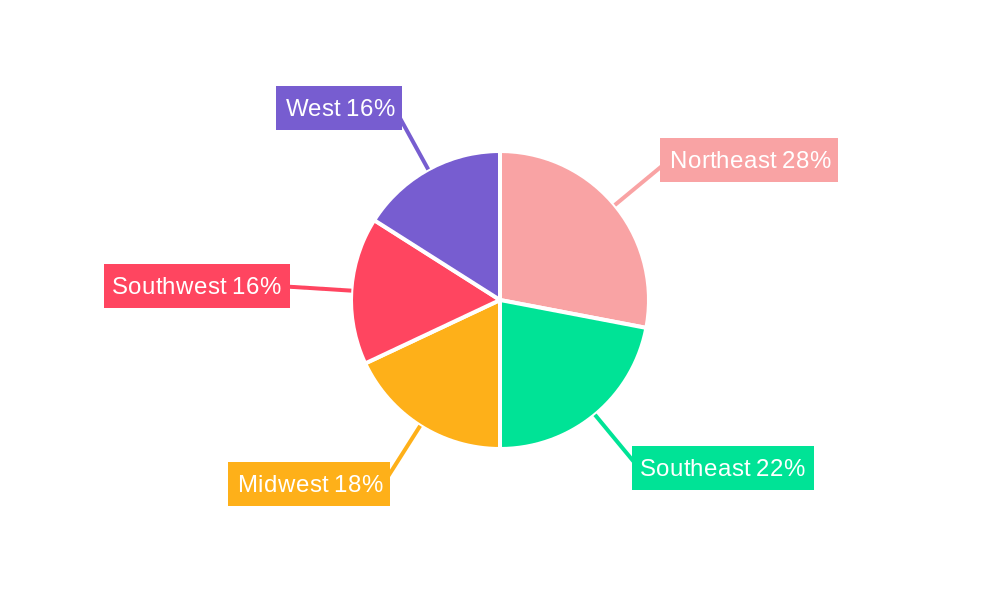
US Pharma Contract Manufacturing Industry Regional Market Share
Geographic Coverage of US Pharma Contract Manufacturing Industry
US Pharma Contract Manufacturing Industry REPORT HIGHLIGHTS
| Aspects | Details |
|---|---|
| Study Period | 2020-2034 |
| Base Year | 2025 |
| Estimated Year | 2026 |
| Forecast Period | 2026-2034 |
| Historical Period | 2020-2025 |
| Growth Rate | CAGR of 5.00% from 2020-2034 |
| Segmentation |
|
Table of Contents
- 1. Introduction
- 1.1. Research Scope
- 1.2. Market Segmentation
- 1.3. Research Objective
- 1.4. Definitions and Assumptions
- 2. Executive Summary
- 2.1. Market Snapshot
- 3. Market Dynamics
- 3.1. Market Drivers
- 3.2. Market Restrains
- 3.3. Market Trends
- 3.4. Market Opportunities
- 4. Market Factor Analysis
- 4.1. Porters Five Forces
- 4.1.1. Bargaining Power of Suppliers
- 4.1.2. Bargaining Power of Buyers
- 4.1.3. Threat of New Entrants
- 4.1.4. Threat of Substitutes
- 4.1.5. Competitive Rivalry
- 4.2. PESTEL analysis
- 4.3. BCG Analysis
- 4.3.1. Stars (High Growth, High Market Share)
- 4.3.2. Cash Cows (Low Growth, High Market Share)
- 4.3.3. Question Mark (High Growth, Low Market Share)
- 4.3.4. Dogs (Low Growth, Low Market Share)
- 4.4. Ansoff Matrix Analysis
- 4.5. Supply Chain Analysis
- 4.6. Regulatory Landscape
- 4.7. Current Market Potential and Opportunity Assessment (TAM–SAM–SOM Framework)
- 4.8. IMR Analyst Note
- 4.1. Porters Five Forces
- 5. Market Analysis, Insights and Forecast 2021-2033
- 5.1. Market Analysis, Insights and Forecast - by Service Type
- 5.1.1. Active P
- 5.1.1.1. Small Molecule
- 5.1.1.2. Large Molecule
- 5.1.1.3. High Potency API (HPAPI)
- 5.1.2. Finished
- 5.1.2.1. Solid Dose Formulation
- 5.1.2.2. Liquid Dose Formulation
- 5.1.2.3. Injectable Dose Formulation
- 5.1.3. Secondary Packaging
- 5.1.1. Active P
- 5.2. Market Analysis, Insights and Forecast - by Region
- 5.2.1. North America
- 5.2.2. South America
- 5.2.3. Europe
- 5.2.4. Middle East & Africa
- 5.2.5. Asia Pacific
- 5.1. Market Analysis, Insights and Forecast - by Service Type
- 6. Global US Pharma Contract Manufacturing Industry Analysis, Insights and Forecast, 2021-2033
- 6.1. Market Analysis, Insights and Forecast - by Service Type
- 6.1.1. Active P
- 6.1.1.1. Small Molecule
- 6.1.1.2. Large Molecule
- 6.1.1.3. High Potency API (HPAPI)
- 6.1.2. Finished
- 6.1.2.1. Solid Dose Formulation
- 6.1.2.2. Liquid Dose Formulation
- 6.1.2.3. Injectable Dose Formulation
- 6.1.3. Secondary Packaging
- 6.1.1. Active P
- 6.1. Market Analysis, Insights and Forecast - by Service Type
- 7. North America US Pharma Contract Manufacturing Industry Analysis, Insights and Forecast, 2020-2032
- 7.1. Market Analysis, Insights and Forecast - by Service Type
- 7.1.1. Active P
- 7.1.1.1. Small Molecule
- 7.1.1.2. Large Molecule
- 7.1.1.3. High Potency API (HPAPI)
- 7.1.2. Finished
- 7.1.2.1. Solid Dose Formulation
- 7.1.2.2. Liquid Dose Formulation
- 7.1.2.3. Injectable Dose Formulation
- 7.1.3. Secondary Packaging
- 7.1.1. Active P
- 7.1. Market Analysis, Insights and Forecast - by Service Type
- 8. South America US Pharma Contract Manufacturing Industry Analysis, Insights and Forecast, 2020-2032
- 8.1. Market Analysis, Insights and Forecast - by Service Type
- 8.1.1. Active P
- 8.1.1.1. Small Molecule
- 8.1.1.2. Large Molecule
- 8.1.1.3. High Potency API (HPAPI)
- 8.1.2. Finished
- 8.1.2.1. Solid Dose Formulation
- 8.1.2.2. Liquid Dose Formulation
- 8.1.2.3. Injectable Dose Formulation
- 8.1.3. Secondary Packaging
- 8.1.1. Active P
- 8.1. Market Analysis, Insights and Forecast - by Service Type
- 9. Europe US Pharma Contract Manufacturing Industry Analysis, Insights and Forecast, 2020-2032
- 9.1. Market Analysis, Insights and Forecast - by Service Type
- 9.1.1. Active P
- 9.1.1.1. Small Molecule
- 9.1.1.2. Large Molecule
- 9.1.1.3. High Potency API (HPAPI)
- 9.1.2. Finished
- 9.1.2.1. Solid Dose Formulation
- 9.1.2.2. Liquid Dose Formulation
- 9.1.2.3. Injectable Dose Formulation
- 9.1.3. Secondary Packaging
- 9.1.1. Active P
- 9.1. Market Analysis, Insights and Forecast - by Service Type
- 10. Middle East & Africa US Pharma Contract Manufacturing Industry Analysis, Insights and Forecast, 2020-2032
- 10.1. Market Analysis, Insights and Forecast - by Service Type
- 10.1.1. Active P
- 10.1.1.1. Small Molecule
- 10.1.1.2. Large Molecule
- 10.1.1.3. High Potency API (HPAPI)
- 10.1.2. Finished
- 10.1.2.1. Solid Dose Formulation
- 10.1.2.2. Liquid Dose Formulation
- 10.1.2.3. Injectable Dose Formulation
- 10.1.3. Secondary Packaging
- 10.1.1. Active P
- 10.1. Market Analysis, Insights and Forecast - by Service Type
- 11. Asia Pacific US Pharma Contract Manufacturing Industry Analysis, Insights and Forecast, 2020-2032
- 11.1. Market Analysis, Insights and Forecast - by Service Type
- 11.1.1. Active P
- 11.1.1.1. Small Molecule
- 11.1.1.2. Large Molecule
- 11.1.1.3. High Potency API (HPAPI)
- 11.1.2. Finished
- 11.1.2.1. Solid Dose Formulation
- 11.1.2.2. Liquid Dose Formulation
- 11.1.2.3. Injectable Dose Formulation
- 11.1.3. Secondary Packaging
- 11.1.1. Active P
- 11.1. Market Analysis, Insights and Forecast - by Service Type
- 12. Competitive Analysis
- 12.1. Company Profiles
- 12.1.1 Thermo Fisher Scientific Inc (Patheon Inc )
- 12.1.1.1. Company Overview
- 12.1.1.2. Products
- 12.1.1.3. Company Financials
- 12.1.1.4. SWOT Analysis
- 12.1.2 Siegfried AG*List Not Exhaustive
- 12.1.2.1. Company Overview
- 12.1.2.2. Products
- 12.1.2.3. Company Financials
- 12.1.2.4. SWOT Analysis
- 12.1.3 Aenova Group
- 12.1.3.1. Company Overview
- 12.1.3.2. Products
- 12.1.3.3. Company Financials
- 12.1.3.4. SWOT Analysis
- 12.1.4 Lonza Group AG
- 12.1.4.1. Company Overview
- 12.1.4.2. Products
- 12.1.4.3. Company Financials
- 12.1.4.4. SWOT Analysis
- 12.1.5 Pfizer CentreSource (Pfizer Inc )
- 12.1.5.1. Company Overview
- 12.1.5.2. Products
- 12.1.5.3. Company Financials
- 12.1.5.4. SWOT Analysis
- 12.1.6 Jubilant Life Sciences Ltd
- 12.1.6.1. Company Overview
- 12.1.6.2. Products
- 12.1.6.3. Company Financials
- 12.1.6.4. SWOT Analysis
- 12.1.7 Catalent Inc
- 12.1.7.1. Company Overview
- 12.1.7.2. Products
- 12.1.7.3. Company Financials
- 12.1.7.4. SWOT Analysis
- 12.1.8 AbbVie Contract Manufacturing
- 12.1.8.1. Company Overview
- 12.1.8.2. Products
- 12.1.8.3. Company Financials
- 12.1.8.4. SWOT Analysis
- 12.1.9 Boehringer Ingelheim Group
- 12.1.9.1. Company Overview
- 12.1.9.2. Products
- 12.1.9.3. Company Financials
- 12.1.9.4. SWOT Analysis
- 12.1.10 Recipharm AB
- 12.1.10.1. Company Overview
- 12.1.10.2. Products
- 12.1.10.3. Company Financials
- 12.1.10.4. SWOT Analysis
- 12.1.11 Baxter Biopharma Solutions (Baxter International Inc )
- 12.1.11.1. Company Overview
- 12.1.11.2. Products
- 12.1.11.3. Company Financials
- 12.1.11.4. SWOT Analysis
- 12.1.1 Thermo Fisher Scientific Inc (Patheon Inc )
- 12.2. Market Entropy
- 12.2.1 Company's Key Areas Served
- 12.2.2 Recent Developments
- 12.3. Company Market Share Analysis 2025
- 12.3.1 Top 5 Companies Market Share Analysis
- 12.3.2 Top 3 Companies Market Share Analysis
- 12.4. List of Potential Customers
- 13. Research Methodology
List of Figures
- Figure 1: Global US Pharma Contract Manufacturing Industry Revenue Breakdown (Million, %) by Region 2025 & 2033
- Figure 2: North America US Pharma Contract Manufacturing Industry Revenue (Million), by Service Type 2025 & 2033
- Figure 3: North America US Pharma Contract Manufacturing Industry Revenue Share (%), by Service Type 2025 & 2033
- Figure 4: North America US Pharma Contract Manufacturing Industry Revenue (Million), by Country 2025 & 2033
- Figure 5: North America US Pharma Contract Manufacturing Industry Revenue Share (%), by Country 2025 & 2033
- Figure 6: South America US Pharma Contract Manufacturing Industry Revenue (Million), by Service Type 2025 & 2033
- Figure 7: South America US Pharma Contract Manufacturing Industry Revenue Share (%), by Service Type 2025 & 2033
- Figure 8: South America US Pharma Contract Manufacturing Industry Revenue (Million), by Country 2025 & 2033
- Figure 9: South America US Pharma Contract Manufacturing Industry Revenue Share (%), by Country 2025 & 2033
- Figure 10: Europe US Pharma Contract Manufacturing Industry Revenue (Million), by Service Type 2025 & 2033
- Figure 11: Europe US Pharma Contract Manufacturing Industry Revenue Share (%), by Service Type 2025 & 2033
- Figure 12: Europe US Pharma Contract Manufacturing Industry Revenue (Million), by Country 2025 & 2033
- Figure 13: Europe US Pharma Contract Manufacturing Industry Revenue Share (%), by Country 2025 & 2033
- Figure 14: Middle East & Africa US Pharma Contract Manufacturing Industry Revenue (Million), by Service Type 2025 & 2033
- Figure 15: Middle East & Africa US Pharma Contract Manufacturing Industry Revenue Share (%), by Service Type 2025 & 2033
- Figure 16: Middle East & Africa US Pharma Contract Manufacturing Industry Revenue (Million), by Country 2025 & 2033
- Figure 17: Middle East & Africa US Pharma Contract Manufacturing Industry Revenue Share (%), by Country 2025 & 2033
- Figure 18: Asia Pacific US Pharma Contract Manufacturing Industry Revenue (Million), by Service Type 2025 & 2033
- Figure 19: Asia Pacific US Pharma Contract Manufacturing Industry Revenue Share (%), by Service Type 2025 & 2033
- Figure 20: Asia Pacific US Pharma Contract Manufacturing Industry Revenue (Million), by Country 2025 & 2033
- Figure 21: Asia Pacific US Pharma Contract Manufacturing Industry Revenue Share (%), by Country 2025 & 2033
List of Tables
- Table 1: Global US Pharma Contract Manufacturing Industry Revenue Million Forecast, by Service Type 2020 & 2033
- Table 2: Global US Pharma Contract Manufacturing Industry Revenue Million Forecast, by Region 2020 & 2033
- Table 3: Global US Pharma Contract Manufacturing Industry Revenue Million Forecast, by Service Type 2020 & 2033
- Table 4: Global US Pharma Contract Manufacturing Industry Revenue Million Forecast, by Country 2020 & 2033
- Table 5: United States US Pharma Contract Manufacturing Industry Revenue (Million) Forecast, by Application 2020 & 2033
- Table 6: Canada US Pharma Contract Manufacturing Industry Revenue (Million) Forecast, by Application 2020 & 2033
- Table 7: Mexico US Pharma Contract Manufacturing Industry Revenue (Million) Forecast, by Application 2020 & 2033
- Table 8: Global US Pharma Contract Manufacturing Industry Revenue Million Forecast, by Service Type 2020 & 2033
- Table 9: Global US Pharma Contract Manufacturing Industry Revenue Million Forecast, by Country 2020 & 2033
- Table 10: Brazil US Pharma Contract Manufacturing Industry Revenue (Million) Forecast, by Application 2020 & 2033
- Table 11: Argentina US Pharma Contract Manufacturing Industry Revenue (Million) Forecast, by Application 2020 & 2033
- Table 12: Rest of South America US Pharma Contract Manufacturing Industry Revenue (Million) Forecast, by Application 2020 & 2033
- Table 13: Global US Pharma Contract Manufacturing Industry Revenue Million Forecast, by Service Type 2020 & 2033
- Table 14: Global US Pharma Contract Manufacturing Industry Revenue Million Forecast, by Country 2020 & 2033
- Table 15: United Kingdom US Pharma Contract Manufacturing Industry Revenue (Million) Forecast, by Application 2020 & 2033
- Table 16: Germany US Pharma Contract Manufacturing Industry Revenue (Million) Forecast, by Application 2020 & 2033
- Table 17: France US Pharma Contract Manufacturing Industry Revenue (Million) Forecast, by Application 2020 & 2033
- Table 18: Italy US Pharma Contract Manufacturing Industry Revenue (Million) Forecast, by Application 2020 & 2033
- Table 19: Spain US Pharma Contract Manufacturing Industry Revenue (Million) Forecast, by Application 2020 & 2033
- Table 20: Russia US Pharma Contract Manufacturing Industry Revenue (Million) Forecast, by Application 2020 & 2033
- Table 21: Benelux US Pharma Contract Manufacturing Industry Revenue (Million) Forecast, by Application 2020 & 2033
- Table 22: Nordics US Pharma Contract Manufacturing Industry Revenue (Million) Forecast, by Application 2020 & 2033
- Table 23: Rest of Europe US Pharma Contract Manufacturing Industry Revenue (Million) Forecast, by Application 2020 & 2033
- Table 24: Global US Pharma Contract Manufacturing Industry Revenue Million Forecast, by Service Type 2020 & 2033
- Table 25: Global US Pharma Contract Manufacturing Industry Revenue Million Forecast, by Country 2020 & 2033
- Table 26: Turkey US Pharma Contract Manufacturing Industry Revenue (Million) Forecast, by Application 2020 & 2033
- Table 27: Israel US Pharma Contract Manufacturing Industry Revenue (Million) Forecast, by Application 2020 & 2033
- Table 28: GCC US Pharma Contract Manufacturing Industry Revenue (Million) Forecast, by Application 2020 & 2033
- Table 29: North Africa US Pharma Contract Manufacturing Industry Revenue (Million) Forecast, by Application 2020 & 2033
- Table 30: South Africa US Pharma Contract Manufacturing Industry Revenue (Million) Forecast, by Application 2020 & 2033
- Table 31: Rest of Middle East & Africa US Pharma Contract Manufacturing Industry Revenue (Million) Forecast, by Application 2020 & 2033
- Table 32: Global US Pharma Contract Manufacturing Industry Revenue Million Forecast, by Service Type 2020 & 2033
- Table 33: Global US Pharma Contract Manufacturing Industry Revenue Million Forecast, by Country 2020 & 2033
- Table 34: China US Pharma Contract Manufacturing Industry Revenue (Million) Forecast, by Application 2020 & 2033
- Table 35: India US Pharma Contract Manufacturing Industry Revenue (Million) Forecast, by Application 2020 & 2033
- Table 36: Japan US Pharma Contract Manufacturing Industry Revenue (Million) Forecast, by Application 2020 & 2033
- Table 37: South Korea US Pharma Contract Manufacturing Industry Revenue (Million) Forecast, by Application 2020 & 2033
- Table 38: ASEAN US Pharma Contract Manufacturing Industry Revenue (Million) Forecast, by Application 2020 & 2033
- Table 39: Oceania US Pharma Contract Manufacturing Industry Revenue (Million) Forecast, by Application 2020 & 2033
- Table 40: Rest of Asia Pacific US Pharma Contract Manufacturing Industry Revenue (Million) Forecast, by Application 2020 & 2033
Frequently Asked Questions
1. What is the projected Compound Annual Growth Rate (CAGR) of the US Pharma Contract Manufacturing Industry?
The projected CAGR is approximately 5.00%.
2. Which companies are prominent players in the US Pharma Contract Manufacturing Industry?
Key companies in the market include Thermo Fisher Scientific Inc (Patheon Inc ), Siegfried AG*List Not Exhaustive, Aenova Group, Lonza Group AG, Pfizer CentreSource (Pfizer Inc ), Jubilant Life Sciences Ltd, Catalent Inc, AbbVie Contract Manufacturing, Boehringer Ingelheim Group, Recipharm AB, Baxter Biopharma Solutions (Baxter International Inc ).
3. What are the main segments of the US Pharma Contract Manufacturing Industry?
The market segments include Service Type.
4. Can you provide details about the market size?
The market size is estimated to be USD XX Million as of 2022.
5. What are some drivers contributing to market growth?
; Increasing Emphasis on Drug Discovery and Outsourcing of Manufacturing; Strong R&D Investments.
6. What are the notable trends driving market growth?
Increasing Demand of API to Witness Significant Market Growth.
7. Are there any restraints impacting market growth?
Increasing Lead Time and Logistics Costs; Stringent Regulatory Requirements; Capacity Utilization Issues Affecting the Profitability of CMOs.
8. Can you provide examples of recent developments in the market?
N/A
9. What pricing options are available for accessing the report?
Pricing options include single-user, multi-user, and enterprise licenses priced at USD 3800, USD 4500, and USD 5800 respectively.
10. Is the market size provided in terms of value or volume?
The market size is provided in terms of value, measured in Million.
11. Are there any specific market keywords associated with the report?
Yes, the market keyword associated with the report is "US Pharma Contract Manufacturing Industry," which aids in identifying and referencing the specific market segment covered.
12. How do I determine which pricing option suits my needs best?
The pricing options vary based on user requirements and access needs. Individual users may opt for single-user licenses, while businesses requiring broader access may choose multi-user or enterprise licenses for cost-effective access to the report.
13. Are there any additional resources or data provided in the US Pharma Contract Manufacturing Industry report?
While the report offers comprehensive insights, it's advisable to review the specific contents or supplementary materials provided to ascertain if additional resources or data are available.
14. How can I stay updated on further developments or reports in the US Pharma Contract Manufacturing Industry?
To stay informed about further developments, trends, and reports in the US Pharma Contract Manufacturing Industry, consider subscribing to industry newsletters, following relevant companies and organizations, or regularly checking reputable industry news sources and publications.
Methodology
Step 1 - Identification of Relevant Samples Size from Population Database


Step 2 - Approaches for Defining Global Market Size (Value, Volume* & Price*)

Note*: In applicable scenarios
Step 3 - Data Sources
Primary Research
- Web Analytics
- Survey Reports
- Research Institute
- Latest Research Reports
- Opinion Leaders
Secondary Research
- Annual Reports
- White Paper
- Latest Press Release
- Industry Association
- Paid Database
- Investor Presentations

Step 4 - Data Triangulation
Involves using different sources of information in order to increase the validity of a study
These sources are likely to be stakeholders in a program - participants, other researchers, program staff, other community members, and so on.
Then we put all data in single framework & apply various statistical tools to find out the dynamic on the market.
During the analysis stage, feedback from the stakeholder groups would be compared to determine areas of agreement as well as areas of divergence