

Key Insights
The APAC neo banking industry is experiencing explosive growth, projected to reach a market size of $1.68 billion in 2025 and maintain a Compound Annual Growth Rate (CAGR) exceeding 9% through 2033. This surge is driven by several key factors. Firstly, the region's burgeoning young, tech-savvy population readily adopts digital financial solutions. Secondly, the increasing penetration of smartphones and robust internet infrastructure fuels the adoption of mobile-first banking services. Furthermore, neo banks offer streamlined onboarding processes, competitive pricing, and personalized financial management tools, attracting customers frustrated with traditional banking's complexities and limitations. Regulatory support in several APAC countries, promoting financial technology innovation, further accelerates market expansion. The competitive landscape is dynamic, with established players like WE Bank and Paytm Payments Bank vying for market share alongside emerging players such as Timo and Kakao Bank. This intense competition fosters innovation and benefits consumers through enhanced product offerings and improved services. However, challenges remain, including cybersecurity concerns, the need for robust customer service infrastructure to support digital channels, and the necessity for sustained regulatory clarity to ensure a level playing field for all participants. Despite these obstacles, the overall outlook for the APAC neo banking sector is extremely positive, signaling a transformative shift in the region's financial landscape.
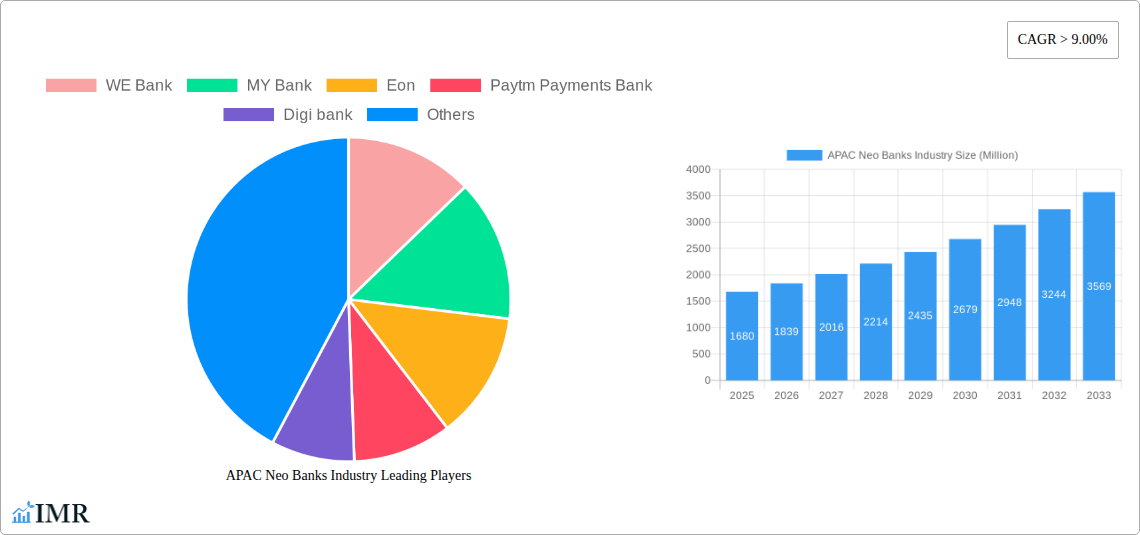
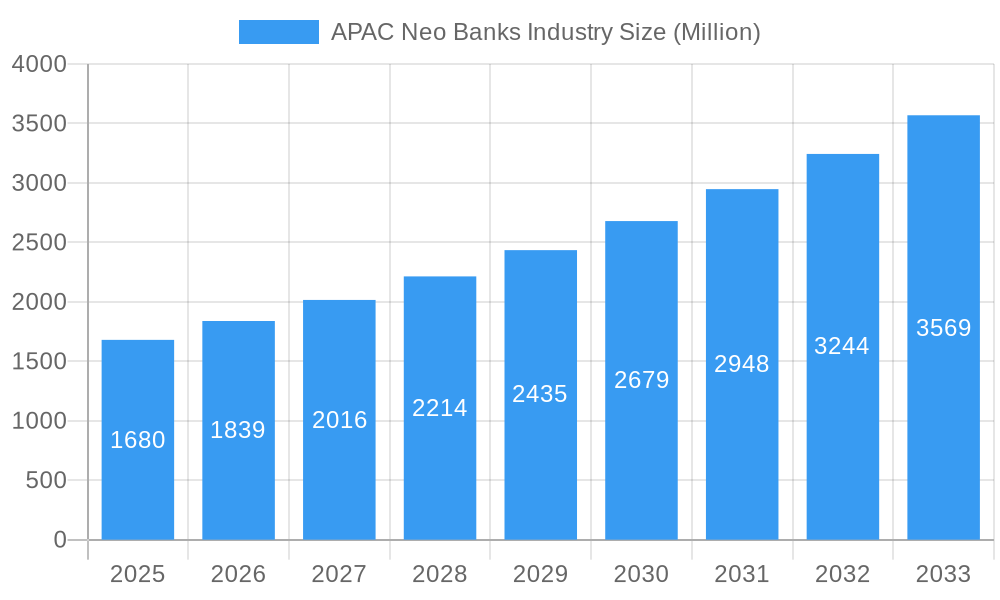
APAC Neo Banks Industry Market Size (In Billion)
The forecast for the APAC neo banking market beyond 2025 anticipates continued robust growth, fueled by the sustained adoption of digital banking and expanding financial inclusion initiatives across the region. Factors like increasing financial literacy, the proliferation of fintech partnerships, and the integration of Artificial Intelligence (AI) and machine learning into neo-banking platforms will shape future market dynamics. While regional variations will exist due to differing regulatory environments and levels of technological adoption, the overall growth trajectory is expected to remain strongly positive. The industry will likely see further consolidation as larger players acquire smaller ones and a continued push for product diversification, with neo banks expanding beyond basic banking services into lending, insurance, and wealth management. The focus will remain on delivering seamless user experiences and highly personalized financial solutions that cater to the diverse needs of the APAC consumer base.
APAC Neo Banks Industry Company Market Share
APAC Neo Banks Industry: A Comprehensive Market Report (2019-2033)
This comprehensive report provides an in-depth analysis of the rapidly evolving APAC neo banks industry, covering market dynamics, growth trends, key players, and future opportunities. With a study period spanning 2019-2033, a base year of 2025, and a forecast period of 2025-2033, this report offers invaluable insights for industry professionals, investors, and strategists. The report leverages extensive data analysis and expert insights to provide a clear understanding of this dynamic market. Market values are presented in millions of units.
APAC Neo Banks Industry Market Dynamics & Structure
This section provides a comprehensive analysis of the market concentration, the pace of technological innovation, the evolving regulatory landscape, the intense competitive dynamics, and the significant M&A activity within the dynamic APAC neo banking sector. Our report offers a holistic perspective by examining the broader financial technology (FinTech) parent market and the specific digital banking child market.
- Market Concentration: The APAC neo bank market is characterized by a moderately concentrated structure. A few leading players command significant market share, complemented by a diverse ecosystem of numerous smaller, niche providers catering to specific customer segments. Market share data for 2024 indicates that the top 5 players collectively hold approximately [Insert specific percentage]% of the total market.
- Technological Innovation: The rapid advancement of technologies such as Artificial Intelligence (AI), blockchain, and sophisticated mobile payment solutions are pivotal drivers. Furthermore, the widespread adoption of open banking Application Programming Interfaces (APIs) is actively reshaping the competitive landscape, fostering greater interoperability and innovation.
- Regulatory Frameworks: The diverse and often varied regulatory environments across different APAC countries significantly influence market growth trajectories and the operational strategies of neo banks. Strict adherence to data privacy regulations, including equivalents of the GDPR, is a critical and non-negotiable factor for all market participants.
- Competitive Product Substitutes: Traditional, incumbent banks remain a formidable competitive force. However, neo banks are adept at carving out unique market positions by offering specialized services, personalized user experiences, and often more competitive fee structures, effectively differentiating themselves.
- End-User Demographics: The primary target demographic for neo banks largely comprises millennials and Gen Z. This segment is distinguished by its high propensity for adopting digital technologies and a strong preference for mobile-first banking solutions that offer convenience and seamless accessibility.
- M&A Trends: Over the past five years, the APAC neo banking sector has seen a notable trend of consolidation, with approximately [Insert specific number] M&A deals. These transactions have predominantly involved the acquisition of smaller neo banks by larger FinTech companies or traditional banks seeking to accelerate their digital transformation initiatives and enhance their digital capabilities. This trend is anticipated to persist, with an estimated [Insert projected number] deals projected within the forecast period.
APAC Neo Banks Industry Growth Trends & Insights
This section offers an in-depth analysis of the market size evolution, the accelerating adoption rates, transformative technological disruptions, and the evolving shifts in consumer behavior within the APAC neo banking sector. These insights are derived from our proprietary data model, [Insert proprietary data model name].
The APAC neo bank market is currently experiencing a period of robust and sustained growth. This expansion is propelled by a confluence of factors, including the ever-increasing penetration of smartphones, the widespread availability and usage of the internet, and a growing consumer demand for financial services that are both convenient and highly accessible. The market size was valued at [Insert specific market size] million in 2024 and is projected to reach [Insert projected market size] million by 2033, reflecting a compelling Compound Annual Growth Rate (CAGR) of [Insert specific CAGR]%. Market penetration is also escalating rapidly, with an estimated [Insert adoption rate]% of the target demographic now actively utilizing neo banking services. Emerging technological disruptions, such as the rise of embedded finance and the proliferation of super apps, are further acting as significant catalysts for this market expansion.
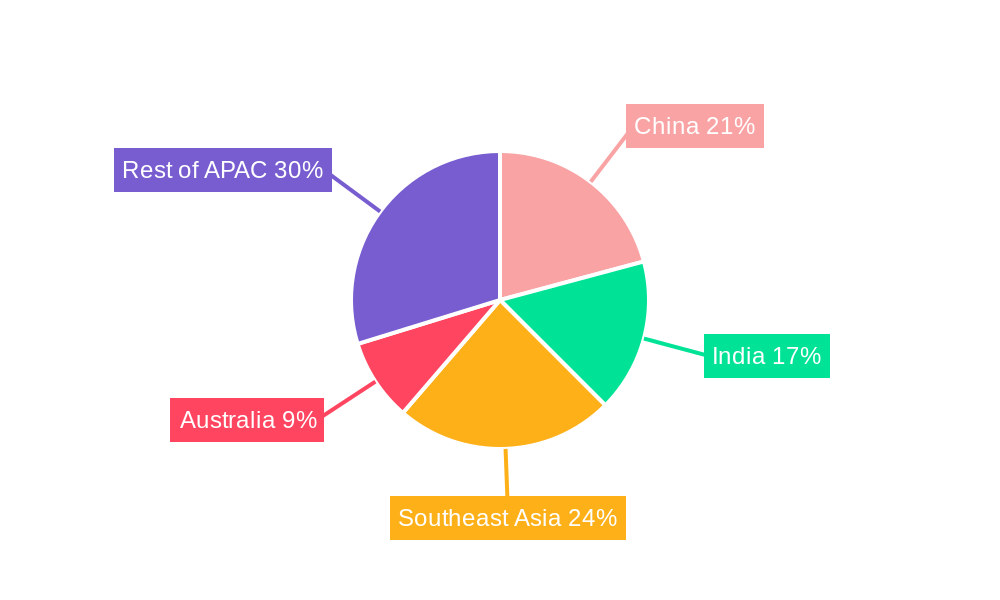
Dominant Regions, Countries, or Segments in APAC Neo Banks Industry
This section identifies the leading regions, countries, or segments driving market growth within the APAC neo banks industry.
- Leading Region: China and India currently dominate the market due to their large populations, high smartphone penetration, and supportive government policies. These two countries collectively account for approximately xx% of the total market size.
- Key Drivers:
- Favorable Government Policies: Regulatory frameworks promoting fintech innovation in certain countries are driving faster adoption rates.
- Robust Digital Infrastructure: Widespread internet and mobile connectivity fuels the widespread adoption of neo banking services.
- Growing Financial Inclusion: Neo banks play a crucial role in expanding access to financial services to underserved populations.
- Dominance Factors: Market share, growth potential, and regulatory environment are analyzed to determine market dominance.
APAC Neo Banks Industry Product Landscape
Neo banks offer a range of products, including mobile-first current accounts, savings accounts, personal loans, and investment products. Key features often include seamless user interfaces, personalized financial management tools, and integration with other fintech platforms. Technological advancements such as AI-powered chatbots and biometric authentication enhance security and user experience. Unique selling propositions (USPs) commonly focus on speed, convenience, transparency, and lower fees compared to traditional banks.
Key Drivers, Barriers & Challenges in APAC Neo Banks Industry
Key Drivers: The significant advancements in technology, the widespread adoption of smartphones, supportive regulatory frameworks that encourage FinTech innovation, and a growing demand for convenient and cost-effective banking services are all pivotal drivers of growth. Additionally, the increasing imperative for financial inclusion, particularly in underserved regions, provides substantial impetus for the expansion of neo banking services.
Key Challenges: Major challenges include intense competition from established traditional banks, navigating complex regulatory hurdles related to compliance and licensing, addressing persistent cybersecurity threats, and the continuous need for technological innovation to stay ahead. Furthermore, achieving and maintaining profitability while offering low or zero-fee services presents a considerable obstacle for many neo banks. The cumulative impact of these challenges is estimated to moderate the overall market growth by approximately [Insert percentage]% by 2033.
Emerging Opportunities in APAP Neo Banks Industry
Untapped markets in less developed APAC regions, particularly in Southeast Asia, offer significant expansion potential for neo banks. The integration of embedded finance into various platforms and applications presents new opportunities for revenue generation and user acquisition. Furthermore, tailored solutions for specific customer segments (e.g., SMEs, freelancers) present further avenues for growth.
Growth Accelerators in the APAC Neo Banks Industry
Long-term growth will be fueled by technological advancements such as advanced analytics, personalized financial recommendations, and blockchain-based solutions. Strategic partnerships with established financial institutions or technology companies can provide access to wider customer bases and infrastructure. Continued market expansion into less penetrated regions will also contribute to sustained growth.
Key Players Shaping the APAC Neo Banks Industry Market
- WE Bank
- MY Bank
- Eon
- Paytm Payments Bank
- Digi bank
- Jenius
- SBI Sumishin Net Bank
- Kakao Bank
- K Plus
- Timo
- Volt
- Xinja
- BigPay
- Neat
Notable Milestones in APAC Neo Banks Industry Sector
- October 2023: Paytm introduced a groundbreaking alternate ID-based guest checkout solution designed to enhance the merchant experience.
- July 2023: Paytm unveiled two innovative 4G-enabled payment devices, the Paytm Pocket Soundbox and the Paytm Music Soundbox, further expanding its suite of payment solutions.
In-Depth APAC Neo Banks Industry Market Outlook
The APAC neo bank market is poised for continued strong growth, driven by technological innovation, regulatory support, and increasing consumer demand. Strategic partnerships, expansion into underserved markets, and the development of innovative financial products will be key to success in this competitive landscape. The market's future potential is significant, with opportunities for both established players and new entrants to capitalize on the ongoing digital transformation of the financial services industry.
APAC Neo Banks Industry Segmentation
-
1. Service Type
- 1.1. Payments
- 1.2. Savings Products
- 1.3. Current Account
- 1.4. Consumer Credit
- 1.5. Loans
- 1.6. Others
-
2. End-User Type
- 2.1. Business Segment
- 2.2. Personal Segment
APAC Neo Banks Industry Segmentation By Geography
-
1. North America
- 1.1. United States
- 1.2. Canada
- 1.3. Mexico
-
2. South America
- 2.1. Brazil
- 2.2. Argentina
- 2.3. Rest of South America
-
3. Europe
- 3.1. United Kingdom
- 3.2. Germany
- 3.3. France
- 3.4. Italy
- 3.5. Spain
- 3.6. Russia
- 3.7. Benelux
- 3.8. Nordics
- 3.9. Rest of Europe
-
4. Middle East & Africa
- 4.1. Turkey
- 4.2. Israel
- 4.3. GCC
- 4.4. North Africa
- 4.5. South Africa
- 4.6. Rest of Middle East & Africa
-
5. Asia Pacific
- 5.1. China
- 5.2. India
- 5.3. Japan
- 5.4. South Korea
- 5.5. ASEAN
- 5.6. Oceania
- 5.7. Rest of Asia Pacific
APAC Neo Banks Industry Regional Market Share
Geographic Coverage of APAC Neo Banks Industry
APAC Neo Banks Industry REPORT HIGHLIGHTS
| Aspects | Details |
|---|---|
| Study Period | 2020-2034 |
| Base Year | 2025 |
| Estimated Year | 2026 |
| Forecast Period | 2026-2034 |
| Historical Period | 2020-2025 |
| Growth Rate | CAGR of > 9.00% from 2020-2034 |
| Segmentation |
|
Table of Contents
- 1. Introduction
- 1.1. Research Scope
- 1.2. Market Segmentation
- 1.3. Research Objective
- 1.4. Definitions and Assumptions
- 2. Executive Summary
- 2.1. Market Snapshot
- 3. Market Dynamics
- 3.1. Market Drivers
- 3.2. Market Restrains
- 3.3. Market Trends
- 3.4. Market Opportunities
- 4. Market Factor Analysis
- 4.1. Porters Five Forces
- 4.1.1. Bargaining Power of Suppliers
- 4.1.2. Bargaining Power of Buyers
- 4.1.3. Threat of New Entrants
- 4.1.4. Threat of Substitutes
- 4.1.5. Competitive Rivalry
- 4.2. PESTEL analysis
- 4.3. BCG Analysis
- 4.3.1. Stars (High Growth, High Market Share)
- 4.3.2. Cash Cows (Low Growth, High Market Share)
- 4.3.3. Question Mark (High Growth, Low Market Share)
- 4.3.4. Dogs (Low Growth, Low Market Share)
- 4.4. Ansoff Matrix Analysis
- 4.5. Supply Chain Analysis
- 4.6. Regulatory Landscape
- 4.7. Current Market Potential and Opportunity Assessment (TAM–SAM–SOM Framework)
- 4.8. IMR Analyst Note
- 4.1. Porters Five Forces
- 5. Market Analysis, Insights and Forecast 2021-2033
- 5.1. Market Analysis, Insights and Forecast - by Service Type
- 5.1.1. Payments
- 5.1.2. Savings Products
- 5.1.3. Current Account
- 5.1.4. Consumer Credit
- 5.1.5. Loans
- 5.1.6. Others
- 5.2. Market Analysis, Insights and Forecast - by End-User Type
- 5.2.1. Business Segment
- 5.2.2. Personal Segment
- 5.3. Market Analysis, Insights and Forecast - by Region
- 5.3.1. North America
- 5.3.2. South America
- 5.3.3. Europe
- 5.3.4. Middle East & Africa
- 5.3.5. Asia Pacific
- 5.1. Market Analysis, Insights and Forecast - by Service Type
- 6. Global APAC Neo Banks Industry Analysis, Insights and Forecast, 2021-2033
- 6.1. Market Analysis, Insights and Forecast - by Service Type
- 6.1.1. Payments
- 6.1.2. Savings Products
- 6.1.3. Current Account
- 6.1.4. Consumer Credit
- 6.1.5. Loans
- 6.1.6. Others
- 6.2. Market Analysis, Insights and Forecast - by End-User Type
- 6.2.1. Business Segment
- 6.2.2. Personal Segment
- 6.1. Market Analysis, Insights and Forecast - by Service Type
- 7. North America APAC Neo Banks Industry Analysis, Insights and Forecast, 2020-2032
- 7.1. Market Analysis, Insights and Forecast - by Service Type
- 7.1.1. Payments
- 7.1.2. Savings Products
- 7.1.3. Current Account
- 7.1.4. Consumer Credit
- 7.1.5. Loans
- 7.1.6. Others
- 7.2. Market Analysis, Insights and Forecast - by End-User Type
- 7.2.1. Business Segment
- 7.2.2. Personal Segment
- 7.1. Market Analysis, Insights and Forecast - by Service Type
- 8. South America APAC Neo Banks Industry Analysis, Insights and Forecast, 2020-2032
- 8.1. Market Analysis, Insights and Forecast - by Service Type
- 8.1.1. Payments
- 8.1.2. Savings Products
- 8.1.3. Current Account
- 8.1.4. Consumer Credit
- 8.1.5. Loans
- 8.1.6. Others
- 8.2. Market Analysis, Insights and Forecast - by End-User Type
- 8.2.1. Business Segment
- 8.2.2. Personal Segment
- 8.1. Market Analysis, Insights and Forecast - by Service Type
- 9. Europe APAC Neo Banks Industry Analysis, Insights and Forecast, 2020-2032
- 9.1. Market Analysis, Insights and Forecast - by Service Type
- 9.1.1. Payments
- 9.1.2. Savings Products
- 9.1.3. Current Account
- 9.1.4. Consumer Credit
- 9.1.5. Loans
- 9.1.6. Others
- 9.2. Market Analysis, Insights and Forecast - by End-User Type
- 9.2.1. Business Segment
- 9.2.2. Personal Segment
- 9.1. Market Analysis, Insights and Forecast - by Service Type
- 10. Middle East & Africa APAC Neo Banks Industry Analysis, Insights and Forecast, 2020-2032
- 10.1. Market Analysis, Insights and Forecast - by Service Type
- 10.1.1. Payments
- 10.1.2. Savings Products
- 10.1.3. Current Account
- 10.1.4. Consumer Credit
- 10.1.5. Loans
- 10.1.6. Others
- 10.2. Market Analysis, Insights and Forecast - by End-User Type
- 10.2.1. Business Segment
- 10.2.2. Personal Segment
- 10.1. Market Analysis, Insights and Forecast - by Service Type
- 11. Asia Pacific APAC Neo Banks Industry Analysis, Insights and Forecast, 2020-2032
- 11.1. Market Analysis, Insights and Forecast - by Service Type
- 11.1.1. Payments
- 11.1.2. Savings Products
- 11.1.3. Current Account
- 11.1.4. Consumer Credit
- 11.1.5. Loans
- 11.1.6. Others
- 11.2. Market Analysis, Insights and Forecast - by End-User Type
- 11.2.1. Business Segment
- 11.2.2. Personal Segment
- 11.1. Market Analysis, Insights and Forecast - by Service Type
- 12. Competitive Analysis
- 12.1. Company Profiles
- 12.1.1 WE Bank
- 12.1.1.1. Company Overview
- 12.1.1.2. Products
- 12.1.1.3. Company Financials
- 12.1.1.4. SWOT Analysis
- 12.1.2 MY Bank
- 12.1.2.1. Company Overview
- 12.1.2.2. Products
- 12.1.2.3. Company Financials
- 12.1.2.4. SWOT Analysis
- 12.1.3 Eon
- 12.1.3.1. Company Overview
- 12.1.3.2. Products
- 12.1.3.3. Company Financials
- 12.1.3.4. SWOT Analysis
- 12.1.4 Paytm Payments Bank
- 12.1.4.1. Company Overview
- 12.1.4.2. Products
- 12.1.4.3. Company Financials
- 12.1.4.4. SWOT Analysis
- 12.1.5 Digi bank
- 12.1.5.1. Company Overview
- 12.1.5.2. Products
- 12.1.5.3. Company Financials
- 12.1.5.4. SWOT Analysis
- 12.1.6 Jenius
- 12.1.6.1. Company Overview
- 12.1.6.2. Products
- 12.1.6.3. Company Financials
- 12.1.6.4. SWOT Analysis
- 12.1.7 SBI Sumishin Net Bank
- 12.1.7.1. Company Overview
- 12.1.7.2. Products
- 12.1.7.3. Company Financials
- 12.1.7.4. SWOT Analysis
- 12.1.8 Kakao Bank
- 12.1.8.1. Company Overview
- 12.1.8.2. Products
- 12.1.8.3. Company Financials
- 12.1.8.4. SWOT Analysis
- 12.1.9 K Plus
- 12.1.9.1. Company Overview
- 12.1.9.2. Products
- 12.1.9.3. Company Financials
- 12.1.9.4. SWOT Analysis
- 12.1.10 Timo
- 12.1.10.1. Company Overview
- 12.1.10.2. Products
- 12.1.10.3. Company Financials
- 12.1.10.4. SWOT Analysis
- 12.1.11 Volt
- 12.1.11.1. Company Overview
- 12.1.11.2. Products
- 12.1.11.3. Company Financials
- 12.1.11.4. SWOT Analysis
- 12.1.12 Xinja
- 12.1.12.1. Company Overview
- 12.1.12.2. Products
- 12.1.12.3. Company Financials
- 12.1.12.4. SWOT Analysis
- 12.1.13 BigPay
- 12.1.13.1. Company Overview
- 12.1.13.2. Products
- 12.1.13.3. Company Financials
- 12.1.13.4. SWOT Analysis
- 12.1.14 Neat**List Not Exhaustive
- 12.1.14.1. Company Overview
- 12.1.14.2. Products
- 12.1.14.3. Company Financials
- 12.1.14.4. SWOT Analysis
- 12.1.1 WE Bank
- 12.2. Market Entropy
- 12.2.1 Company's Key Areas Served
- 12.2.2 Recent Developments
- 12.3. Company Market Share Analysis 2025
- 12.3.1 Top 5 Companies Market Share Analysis
- 12.3.2 Top 3 Companies Market Share Analysis
- 12.4. List of Potential Customers
- 13. Research Methodology
List of Figures
- Figure 1: Global APAC Neo Banks Industry Revenue Breakdown (Million, %) by Region 2025 & 2033
- Figure 2: Global APAC Neo Banks Industry Volume Breakdown (Billion, %) by Region 2025 & 2033
- Figure 3: North America APAC Neo Banks Industry Revenue (Million), by Service Type 2025 & 2033
- Figure 4: North America APAC Neo Banks Industry Volume (Billion), by Service Type 2025 & 2033
- Figure 5: North America APAC Neo Banks Industry Revenue Share (%), by Service Type 2025 & 2033
- Figure 6: North America APAC Neo Banks Industry Volume Share (%), by Service Type 2025 & 2033
- Figure 7: North America APAC Neo Banks Industry Revenue (Million), by End-User Type 2025 & 2033
- Figure 8: North America APAC Neo Banks Industry Volume (Billion), by End-User Type 2025 & 2033
- Figure 9: North America APAC Neo Banks Industry Revenue Share (%), by End-User Type 2025 & 2033
- Figure 10: North America APAC Neo Banks Industry Volume Share (%), by End-User Type 2025 & 2033
- Figure 11: North America APAC Neo Banks Industry Revenue (Million), by Country 2025 & 2033
- Figure 12: North America APAC Neo Banks Industry Volume (Billion), by Country 2025 & 2033
- Figure 13: North America APAC Neo Banks Industry Revenue Share (%), by Country 2025 & 2033
- Figure 14: North America APAC Neo Banks Industry Volume Share (%), by Country 2025 & 2033
- Figure 15: South America APAC Neo Banks Industry Revenue (Million), by Service Type 2025 & 2033
- Figure 16: South America APAC Neo Banks Industry Volume (Billion), by Service Type 2025 & 2033
- Figure 17: South America APAC Neo Banks Industry Revenue Share (%), by Service Type 2025 & 2033
- Figure 18: South America APAC Neo Banks Industry Volume Share (%), by Service Type 2025 & 2033
- Figure 19: South America APAC Neo Banks Industry Revenue (Million), by End-User Type 2025 & 2033
- Figure 20: South America APAC Neo Banks Industry Volume (Billion), by End-User Type 2025 & 2033
- Figure 21: South America APAC Neo Banks Industry Revenue Share (%), by End-User Type 2025 & 2033
- Figure 22: South America APAC Neo Banks Industry Volume Share (%), by End-User Type 2025 & 2033
- Figure 23: South America APAC Neo Banks Industry Revenue (Million), by Country 2025 & 2033
- Figure 24: South America APAC Neo Banks Industry Volume (Billion), by Country 2025 & 2033
- Figure 25: South America APAC Neo Banks Industry Revenue Share (%), by Country 2025 & 2033
- Figure 26: South America APAC Neo Banks Industry Volume Share (%), by Country 2025 & 2033
- Figure 27: Europe APAC Neo Banks Industry Revenue (Million), by Service Type 2025 & 2033
- Figure 28: Europe APAC Neo Banks Industry Volume (Billion), by Service Type 2025 & 2033
- Figure 29: Europe APAC Neo Banks Industry Revenue Share (%), by Service Type 2025 & 2033
- Figure 30: Europe APAC Neo Banks Industry Volume Share (%), by Service Type 2025 & 2033
- Figure 31: Europe APAC Neo Banks Industry Revenue (Million), by End-User Type 2025 & 2033
- Figure 32: Europe APAC Neo Banks Industry Volume (Billion), by End-User Type 2025 & 2033
- Figure 33: Europe APAC Neo Banks Industry Revenue Share (%), by End-User Type 2025 & 2033
- Figure 34: Europe APAC Neo Banks Industry Volume Share (%), by End-User Type 2025 & 2033
- Figure 35: Europe APAC Neo Banks Industry Revenue (Million), by Country 2025 & 2033
- Figure 36: Europe APAC Neo Banks Industry Volume (Billion), by Country 2025 & 2033
- Figure 37: Europe APAC Neo Banks Industry Revenue Share (%), by Country 2025 & 2033
- Figure 38: Europe APAC Neo Banks Industry Volume Share (%), by Country 2025 & 2033
- Figure 39: Middle East & Africa APAC Neo Banks Industry Revenue (Million), by Service Type 2025 & 2033
- Figure 40: Middle East & Africa APAC Neo Banks Industry Volume (Billion), by Service Type 2025 & 2033
- Figure 41: Middle East & Africa APAC Neo Banks Industry Revenue Share (%), by Service Type 2025 & 2033
- Figure 42: Middle East & Africa APAC Neo Banks Industry Volume Share (%), by Service Type 2025 & 2033
- Figure 43: Middle East & Africa APAC Neo Banks Industry Revenue (Million), by End-User Type 2025 & 2033
- Figure 44: Middle East & Africa APAC Neo Banks Industry Volume (Billion), by End-User Type 2025 & 2033
- Figure 45: Middle East & Africa APAC Neo Banks Industry Revenue Share (%), by End-User Type 2025 & 2033
- Figure 46: Middle East & Africa APAC Neo Banks Industry Volume Share (%), by End-User Type 2025 & 2033
- Figure 47: Middle East & Africa APAC Neo Banks Industry Revenue (Million), by Country 2025 & 2033
- Figure 48: Middle East & Africa APAC Neo Banks Industry Volume (Billion), by Country 2025 & 2033
- Figure 49: Middle East & Africa APAC Neo Banks Industry Revenue Share (%), by Country 2025 & 2033
- Figure 50: Middle East & Africa APAC Neo Banks Industry Volume Share (%), by Country 2025 & 2033
- Figure 51: Asia Pacific APAC Neo Banks Industry Revenue (Million), by Service Type 2025 & 2033
- Figure 52: Asia Pacific APAC Neo Banks Industry Volume (Billion), by Service Type 2025 & 2033
- Figure 53: Asia Pacific APAC Neo Banks Industry Revenue Share (%), by Service Type 2025 & 2033
- Figure 54: Asia Pacific APAC Neo Banks Industry Volume Share (%), by Service Type 2025 & 2033
- Figure 55: Asia Pacific APAC Neo Banks Industry Revenue (Million), by End-User Type 2025 & 2033
- Figure 56: Asia Pacific APAC Neo Banks Industry Volume (Billion), by End-User Type 2025 & 2033
- Figure 57: Asia Pacific APAC Neo Banks Industry Revenue Share (%), by End-User Type 2025 & 2033
- Figure 58: Asia Pacific APAC Neo Banks Industry Volume Share (%), by End-User Type 2025 & 2033
- Figure 59: Asia Pacific APAC Neo Banks Industry Revenue (Million), by Country 2025 & 2033
- Figure 60: Asia Pacific APAC Neo Banks Industry Volume (Billion), by Country 2025 & 2033
- Figure 61: Asia Pacific APAC Neo Banks Industry Revenue Share (%), by Country 2025 & 2033
- Figure 62: Asia Pacific APAC Neo Banks Industry Volume Share (%), by Country 2025 & 2033
List of Tables
- Table 1: Global APAC Neo Banks Industry Revenue Million Forecast, by Service Type 2020 & 2033
- Table 2: Global APAC Neo Banks Industry Volume Billion Forecast, by Service Type 2020 & 2033
- Table 3: Global APAC Neo Banks Industry Revenue Million Forecast, by End-User Type 2020 & 2033
- Table 4: Global APAC Neo Banks Industry Volume Billion Forecast, by End-User Type 2020 & 2033
- Table 5: Global APAC Neo Banks Industry Revenue Million Forecast, by Region 2020 & 2033
- Table 6: Global APAC Neo Banks Industry Volume Billion Forecast, by Region 2020 & 2033
- Table 7: Global APAC Neo Banks Industry Revenue Million Forecast, by Service Type 2020 & 2033
- Table 8: Global APAC Neo Banks Industry Volume Billion Forecast, by Service Type 2020 & 2033
- Table 9: Global APAC Neo Banks Industry Revenue Million Forecast, by End-User Type 2020 & 2033
- Table 10: Global APAC Neo Banks Industry Volume Billion Forecast, by End-User Type 2020 & 2033
- Table 11: Global APAC Neo Banks Industry Revenue Million Forecast, by Country 2020 & 2033
- Table 12: Global APAC Neo Banks Industry Volume Billion Forecast, by Country 2020 & 2033
- Table 13: United States APAC Neo Banks Industry Revenue (Million) Forecast, by Application 2020 & 2033
- Table 14: United States APAC Neo Banks Industry Volume (Billion) Forecast, by Application 2020 & 2033
- Table 15: Canada APAC Neo Banks Industry Revenue (Million) Forecast, by Application 2020 & 2033
- Table 16: Canada APAC Neo Banks Industry Volume (Billion) Forecast, by Application 2020 & 2033
- Table 17: Mexico APAC Neo Banks Industry Revenue (Million) Forecast, by Application 2020 & 2033
- Table 18: Mexico APAC Neo Banks Industry Volume (Billion) Forecast, by Application 2020 & 2033
- Table 19: Global APAC Neo Banks Industry Revenue Million Forecast, by Service Type 2020 & 2033
- Table 20: Global APAC Neo Banks Industry Volume Billion Forecast, by Service Type 2020 & 2033
- Table 21: Global APAC Neo Banks Industry Revenue Million Forecast, by End-User Type 2020 & 2033
- Table 22: Global APAC Neo Banks Industry Volume Billion Forecast, by End-User Type 2020 & 2033
- Table 23: Global APAC Neo Banks Industry Revenue Million Forecast, by Country 2020 & 2033
- Table 24: Global APAC Neo Banks Industry Volume Billion Forecast, by Country 2020 & 2033
- Table 25: Brazil APAC Neo Banks Industry Revenue (Million) Forecast, by Application 2020 & 2033
- Table 26: Brazil APAC Neo Banks Industry Volume (Billion) Forecast, by Application 2020 & 2033
- Table 27: Argentina APAC Neo Banks Industry Revenue (Million) Forecast, by Application 2020 & 2033
- Table 28: Argentina APAC Neo Banks Industry Volume (Billion) Forecast, by Application 2020 & 2033
- Table 29: Rest of South America APAC Neo Banks Industry Revenue (Million) Forecast, by Application 2020 & 2033
- Table 30: Rest of South America APAC Neo Banks Industry Volume (Billion) Forecast, by Application 2020 & 2033
- Table 31: Global APAC Neo Banks Industry Revenue Million Forecast, by Service Type 2020 & 2033
- Table 32: Global APAC Neo Banks Industry Volume Billion Forecast, by Service Type 2020 & 2033
- Table 33: Global APAC Neo Banks Industry Revenue Million Forecast, by End-User Type 2020 & 2033
- Table 34: Global APAC Neo Banks Industry Volume Billion Forecast, by End-User Type 2020 & 2033
- Table 35: Global APAC Neo Banks Industry Revenue Million Forecast, by Country 2020 & 2033
- Table 36: Global APAC Neo Banks Industry Volume Billion Forecast, by Country 2020 & 2033
- Table 37: United Kingdom APAC Neo Banks Industry Revenue (Million) Forecast, by Application 2020 & 2033
- Table 38: United Kingdom APAC Neo Banks Industry Volume (Billion) Forecast, by Application 2020 & 2033
- Table 39: Germany APAC Neo Banks Industry Revenue (Million) Forecast, by Application 2020 & 2033
- Table 40: Germany APAC Neo Banks Industry Volume (Billion) Forecast, by Application 2020 & 2033
- Table 41: France APAC Neo Banks Industry Revenue (Million) Forecast, by Application 2020 & 2033
- Table 42: France APAC Neo Banks Industry Volume (Billion) Forecast, by Application 2020 & 2033
- Table 43: Italy APAC Neo Banks Industry Revenue (Million) Forecast, by Application 2020 & 2033
- Table 44: Italy APAC Neo Banks Industry Volume (Billion) Forecast, by Application 2020 & 2033
- Table 45: Spain APAC Neo Banks Industry Revenue (Million) Forecast, by Application 2020 & 2033
- Table 46: Spain APAC Neo Banks Industry Volume (Billion) Forecast, by Application 2020 & 2033
- Table 47: Russia APAC Neo Banks Industry Revenue (Million) Forecast, by Application 2020 & 2033
- Table 48: Russia APAC Neo Banks Industry Volume (Billion) Forecast, by Application 2020 & 2033
- Table 49: Benelux APAC Neo Banks Industry Revenue (Million) Forecast, by Application 2020 & 2033
- Table 50: Benelux APAC Neo Banks Industry Volume (Billion) Forecast, by Application 2020 & 2033
- Table 51: Nordics APAC Neo Banks Industry Revenue (Million) Forecast, by Application 2020 & 2033
- Table 52: Nordics APAC Neo Banks Industry Volume (Billion) Forecast, by Application 2020 & 2033
- Table 53: Rest of Europe APAC Neo Banks Industry Revenue (Million) Forecast, by Application 2020 & 2033
- Table 54: Rest of Europe APAC Neo Banks Industry Volume (Billion) Forecast, by Application 2020 & 2033
- Table 55: Global APAC Neo Banks Industry Revenue Million Forecast, by Service Type 2020 & 2033
- Table 56: Global APAC Neo Banks Industry Volume Billion Forecast, by Service Type 2020 & 2033
- Table 57: Global APAC Neo Banks Industry Revenue Million Forecast, by End-User Type 2020 & 2033
- Table 58: Global APAC Neo Banks Industry Volume Billion Forecast, by End-User Type 2020 & 2033
- Table 59: Global APAC Neo Banks Industry Revenue Million Forecast, by Country 2020 & 2033
- Table 60: Global APAC Neo Banks Industry Volume Billion Forecast, by Country 2020 & 2033
- Table 61: Turkey APAC Neo Banks Industry Revenue (Million) Forecast, by Application 2020 & 2033
- Table 62: Turkey APAC Neo Banks Industry Volume (Billion) Forecast, by Application 2020 & 2033
- Table 63: Israel APAC Neo Banks Industry Revenue (Million) Forecast, by Application 2020 & 2033
- Table 64: Israel APAC Neo Banks Industry Volume (Billion) Forecast, by Application 2020 & 2033
- Table 65: GCC APAC Neo Banks Industry Revenue (Million) Forecast, by Application 2020 & 2033
- Table 66: GCC APAC Neo Banks Industry Volume (Billion) Forecast, by Application 2020 & 2033
- Table 67: North Africa APAC Neo Banks Industry Revenue (Million) Forecast, by Application 2020 & 2033
- Table 68: North Africa APAC Neo Banks Industry Volume (Billion) Forecast, by Application 2020 & 2033
- Table 69: South Africa APAC Neo Banks Industry Revenue (Million) Forecast, by Application 2020 & 2033
- Table 70: South Africa APAC Neo Banks Industry Volume (Billion) Forecast, by Application 2020 & 2033
- Table 71: Rest of Middle East & Africa APAC Neo Banks Industry Revenue (Million) Forecast, by Application 2020 & 2033
- Table 72: Rest of Middle East & Africa APAC Neo Banks Industry Volume (Billion) Forecast, by Application 2020 & 2033
- Table 73: Global APAC Neo Banks Industry Revenue Million Forecast, by Service Type 2020 & 2033
- Table 74: Global APAC Neo Banks Industry Volume Billion Forecast, by Service Type 2020 & 2033
- Table 75: Global APAC Neo Banks Industry Revenue Million Forecast, by End-User Type 2020 & 2033
- Table 76: Global APAC Neo Banks Industry Volume Billion Forecast, by End-User Type 2020 & 2033
- Table 77: Global APAC Neo Banks Industry Revenue Million Forecast, by Country 2020 & 2033
- Table 78: Global APAC Neo Banks Industry Volume Billion Forecast, by Country 2020 & 2033
- Table 79: China APAC Neo Banks Industry Revenue (Million) Forecast, by Application 2020 & 2033
- Table 80: China APAC Neo Banks Industry Volume (Billion) Forecast, by Application 2020 & 2033
- Table 81: India APAC Neo Banks Industry Revenue (Million) Forecast, by Application 2020 & 2033
- Table 82: India APAC Neo Banks Industry Volume (Billion) Forecast, by Application 2020 & 2033
- Table 83: Japan APAC Neo Banks Industry Revenue (Million) Forecast, by Application 2020 & 2033
- Table 84: Japan APAC Neo Banks Industry Volume (Billion) Forecast, by Application 2020 & 2033
- Table 85: South Korea APAC Neo Banks Industry Revenue (Million) Forecast, by Application 2020 & 2033
- Table 86: South Korea APAC Neo Banks Industry Volume (Billion) Forecast, by Application 2020 & 2033
- Table 87: ASEAN APAC Neo Banks Industry Revenue (Million) Forecast, by Application 2020 & 2033
- Table 88: ASEAN APAC Neo Banks Industry Volume (Billion) Forecast, by Application 2020 & 2033
- Table 89: Oceania APAC Neo Banks Industry Revenue (Million) Forecast, by Application 2020 & 2033
- Table 90: Oceania APAC Neo Banks Industry Volume (Billion) Forecast, by Application 2020 & 2033
- Table 91: Rest of Asia Pacific APAC Neo Banks Industry Revenue (Million) Forecast, by Application 2020 & 2033
- Table 92: Rest of Asia Pacific APAC Neo Banks Industry Volume (Billion) Forecast, by Application 2020 & 2033
Frequently Asked Questions
1. What is the projected Compound Annual Growth Rate (CAGR) of the APAC Neo Banks Industry?
The projected CAGR is approximately > 9.00%.
2. Which companies are prominent players in the APAC Neo Banks Industry?
Key companies in the market include WE Bank, MY Bank, Eon, Paytm Payments Bank, Digi bank, Jenius, SBI Sumishin Net Bank, Kakao Bank, K Plus, Timo, Volt, Xinja, BigPay, Neat**List Not Exhaustive.
3. What are the main segments of the APAC Neo Banks Industry?
The market segments include Service Type, End-User Type.
4. Can you provide details about the market size?
The market size is estimated to be USD 1.68 Million as of 2022.
5. What are some drivers contributing to market growth?
Increase in Internet Penetration is Driving the Market.
6. What are the notable trends driving market growth?
Raise in Mobile Penetration and High Unbanked Adults in the Region.
7. Are there any restraints impacting market growth?
Increase in Internet Penetration is Driving the Market.
8. Can you provide examples of recent developments in the market?
In October 2023, Paytm launched the industry’s first alternate ID-based guest checkout solution for merchants. Tokenisation masks the 16-digit debit or credit card number with a unique token that is specific to one’s card to prevent misuse and theft from merchant websites.
9. What pricing options are available for accessing the report?
Pricing options include single-user, multi-user, and enterprise licenses priced at USD 4750, USD 5250, and USD 8750 respectively.
10. Is the market size provided in terms of value or volume?
The market size is provided in terms of value, measured in Million and volume, measured in Billion.
11. Are there any specific market keywords associated with the report?
Yes, the market keyword associated with the report is "APAC Neo Banks Industry," which aids in identifying and referencing the specific market segment covered.
12. How do I determine which pricing option suits my needs best?
The pricing options vary based on user requirements and access needs. Individual users may opt for single-user licenses, while businesses requiring broader access may choose multi-user or enterprise licenses for cost-effective access to the report.
13. Are there any additional resources or data provided in the APAC Neo Banks Industry report?
While the report offers comprehensive insights, it's advisable to review the specific contents or supplementary materials provided to ascertain if additional resources or data are available.
14. How can I stay updated on further developments or reports in the APAC Neo Banks Industry?
To stay informed about further developments, trends, and reports in the APAC Neo Banks Industry, consider subscribing to industry newsletters, following relevant companies and organizations, or regularly checking reputable industry news sources and publications.
Methodology
Step 1 - Identification of Relevant Samples Size from Population Database


Step 2 - Approaches for Defining Global Market Size (Value, Volume* & Price*)

Note*: In applicable scenarios
Step 3 - Data Sources
Primary Research
- Web Analytics
- Survey Reports
- Research Institute
- Latest Research Reports
- Opinion Leaders
Secondary Research
- Annual Reports
- White Paper
- Latest Press Release
- Industry Association
- Paid Database
- Investor Presentations

Step 4 - Data Triangulation
Involves using different sources of information in order to increase the validity of a study
These sources are likely to be stakeholders in a program - participants, other researchers, program staff, other community members, and so on.
Then we put all data in single framework & apply various statistical tools to find out the dynamic on the market.
During the analysis stage, feedback from the stakeholder groups would be compared to determine areas of agreement as well as areas of divergence