

Key Insights
The automotive polymer composites market is experiencing robust growth, driven by increasing demand for lightweight vehicles to enhance fuel efficiency and reduce carbon emissions. The market's Compound Annual Growth Rate (CAGR) exceeding 5% from 2019 to 2024 indicates a significant upward trajectory, projected to continue through 2033. Key drivers include stringent government regulations promoting fuel economy, the rising adoption of electric and hybrid vehicles (requiring lightweight components), and the increasing focus on improving vehicle safety and performance. The market is segmented by resin type (polypropylene, polyurethanes, nylon, etc.) and vehicle type (passenger cars, light commercial vehicles, trucks, etc.), each demonstrating unique growth patterns reflecting specific material properties and vehicle manufacturing trends. Polypropylene and polyurethanes are currently dominant resin types due to their cost-effectiveness and versatility. However, high-performance materials like polyamides and carbon fiber reinforced polymers are gaining traction, particularly in high-end vehicles and specialized applications. Regional growth is geographically diverse, with North America and Europe currently holding significant market share, while the Asia-Pacific region is expected to witness substantial growth driven by expanding automotive manufacturing in countries like China and India. Despite these positive trends, the market faces restraints such as fluctuating raw material prices and potential supply chain disruptions. Nevertheless, continuous innovation in material science and manufacturing processes is expected to mitigate these challenges, fostering continued market expansion.
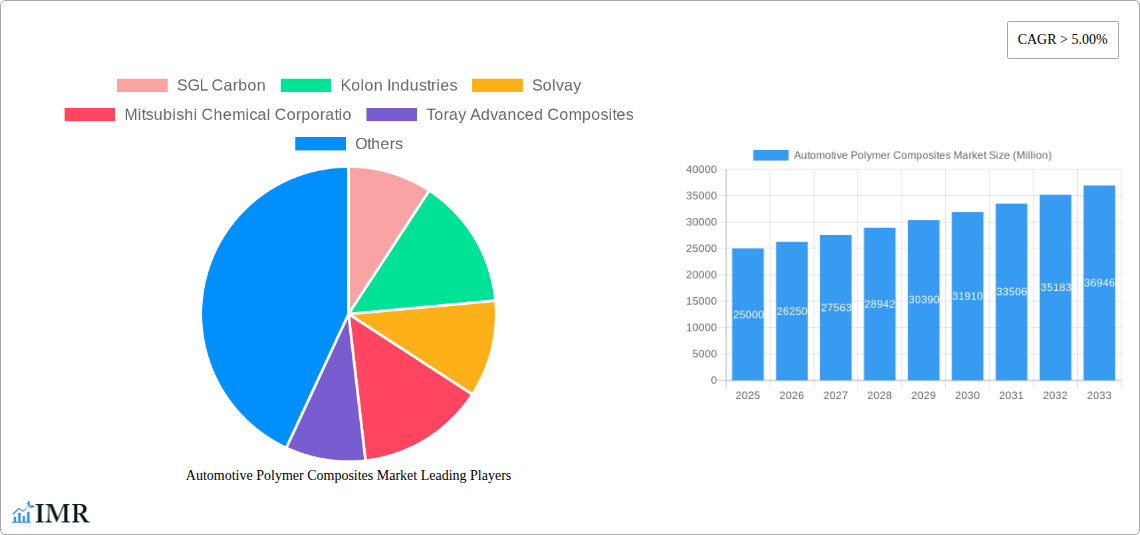
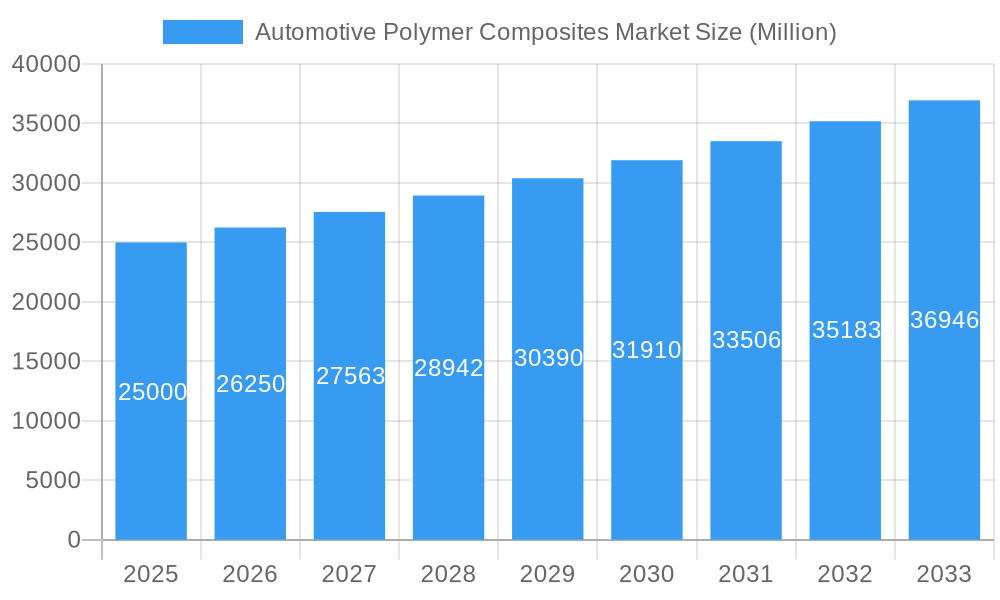
Automotive Polymer Composites Market Market Size (In Billion)
The competitive landscape is characterized by a mix of established chemical giants and specialized composite manufacturers. Companies like BASF, DuPont, and Solvay are major players, leveraging their extensive research and development capabilities and global presence. Smaller, specialized firms focus on niche applications and innovative material formulations, often collaborating with automotive OEMs to develop customized solutions. The future of the automotive polymer composites market hinges on the successful integration of sustainable materials, advanced manufacturing technologies, and collaborative partnerships to meet evolving customer demands for lightweight, high-performance, and eco-friendly vehicles. Further growth will be influenced by advancements in recycling technologies for composite materials, promoting a circular economy within the automotive sector.
Automotive Polymer Composites Market Company Market Share
This comprehensive report offers a detailed analysis of the Automotive Polymer Composites Market, providing invaluable insights for industry professionals, investors, and strategic decision-makers. The report meticulously examines market dynamics, growth trends, regional dominance, product landscapes, and key players shaping this dynamic sector. With a study period spanning 2019-2033, a base year of 2025, and a forecast period of 2025-2033, this report provides a robust historical and future perspective on the Automotive Polymer Composites market, segmented by resin type and vehicle type. The total market size is projected to reach xx Million units by 2033.
Automotive Polymer Composites Market Market Dynamics & Structure
The Automotive Polymer Composites market is characterized by a moderately concentrated landscape, with key players actively engaged in technological innovation and strategic mergers and acquisitions (M&A) activities to bolster their market position. The market exhibits significant growth potential driven by the increasing demand for lightweight vehicles to improve fuel efficiency and reduce carbon emissions. However, regulatory changes and the emergence of competitive substitutes present both opportunities and challenges.
Market Concentration: The top 5 players collectively hold approximately xx% of the market share in 2025. The remaining share is distributed among numerous smaller players, leading to a moderately competitive market structure.
Technological Innovation Drivers: Lightweighting initiatives, advancements in material science leading to improved performance characteristics (e.g., strength-to-weight ratio, durability), and the development of sustainable composite materials are key technological drivers.
Regulatory Frameworks: Stringent emission regulations and fuel efficiency standards globally are pushing automakers to adopt lightweight materials, thereby boosting demand for automotive polymer composites.
Competitive Product Substitutes: Metals, particularly steel and aluminum, remain significant competitors. However, the superior performance characteristics and cost-effectiveness of composites in certain applications are driving market share gains.
End-User Demographics: The growth of the automotive industry, particularly in developing economies, coupled with changing consumer preferences towards enhanced vehicle safety and performance, are fueling market expansion.
M&A Trends: A significant number of M&A deals (xx deals in the past 5 years) have been observed, primarily focused on expanding product portfolios, enhancing technological capabilities, and securing access to new markets.
Automotive Polymer Composites Market Growth Trends & Insights
The Automotive Polymer Composites market has witnessed robust growth over the historical period (2019-2024), expanding at a Compound Annual Growth Rate (CAGR) of xx%. This growth is projected to continue into the forecast period (2025-2033), with a CAGR of xx%. The increasing adoption of polymer composites across various vehicle types is a primary factor contributing to this growth.
The market penetration rate for polymer composites in passenger cars is currently at xx% and is expected to reach xx% by 2033, driven by stringent fuel efficiency regulations and the growing demand for lightweight vehicles. The adoption rate is even higher in specialized vehicle segments like sports cars and commercial vehicles where weight reduction and durability play crucial roles. Technological disruptions, such as the development of advanced composite materials with enhanced properties and the incorporation of innovative manufacturing processes like automated fiber placement, are accelerating market expansion.
Dominant Regions, Countries, or Segments in Automotive Polymer Composites Market
The North American region currently holds the largest market share, followed by Europe and Asia Pacific. However, Asia Pacific is projected to demonstrate the highest growth rate during the forecast period, driven by rapid industrialization and the booming automotive sector in countries like China and India.
Dominant Resin Types: Polypropylene and Polyurethanes currently hold the largest market share among resin types due to their cost-effectiveness and versatility. However, the use of high-performance resins like Polyetheretherketone (PEEK) is projected to increase significantly in high-end vehicle segments.
Dominant Vehicle Types: Passenger cars constitute the largest segment, followed by light commercial vehicles. Trucks and buses are also exhibiting strong growth, driven by the increasing demand for fuel-efficient and durable commercial vehicles.
- Key Drivers:
- Increasing demand for fuel-efficient vehicles.
- Stringent government regulations on vehicle emissions.
- Growing popularity of lightweight vehicles.
- Technological advancements in material science.
Automotive Polymer Composites Market Product Landscape
The automotive polymer composites market offers a diverse range of products, each tailored to specific applications and performance requirements. Innovations focus on enhancing mechanical properties, improving durability, and developing sustainable materials. Key product advancements include the development of high-strength, lightweight composites with improved impact resistance and fatigue strength, and the introduction of bio-based and recyclable composite materials to meet sustainability goals. Unique selling propositions often center on weight reduction capabilities, enhanced structural performance, and cost-effectiveness compared to traditional materials.
Key Drivers, Barriers & Challenges in Automotive Polymer Composites Market
Key Drivers: The primary drivers include stringent fuel efficiency standards, the increasing demand for lightweight vehicles, advancements in composite materials technology, and the growing adoption of hybrid and electric vehicles.
Key Challenges & Restraints: High initial costs associated with composite materials and their processing, the complexity of manufacturing processes, and concerns about recyclability and the environmental impact of certain resins pose significant challenges. Supply chain disruptions and the fluctuating prices of raw materials can also impact market growth.
Emerging Opportunities in Automotive Polymer Composites Market
Emerging opportunities lie in the development of high-performance, sustainable composites, the exploration of new applications in vehicle interiors and exteriors, and the expansion into niche markets such as electric vehicles and autonomous driving systems. The growing demand for customized and lightweight automotive components also presents opportunities for specialized composite material manufacturers. Untapped markets in developing economies offer significant potential for growth.
Growth Accelerators in the Automotive Polymer Composites Market Industry
Technological breakthroughs in material science and manufacturing processes are key growth catalysts. Strategic partnerships between composite material manufacturers and automotive OEMs are accelerating product development and adoption. Expansion into new geographic markets and diversification of product portfolios are also playing crucial roles in driving long-term growth.
Key Players Shaping the Automotive Polymer Composites Market Market
- SGL Carbon
- Kolon Industries
- Solvay
- Mitsubishi Chemical Corporation
- Toray Advanced Composites
- Teijin Carbon
- Gurit Services AG
- UFP Technologies Inc
- Owens Corning
- BASF SE
- Plasan Sasa Ltd
- DuPont
- Hexcel Corporation
- Covestro AG
- Johns Manville
- Pyrophobic Systems Ltd
Notable Milestones in Automotive Polymer Composites Market Sector
- 2022 Q3: Launch of a new bio-based composite material by BASF SE.
- 2021 Q4: Acquisition of a smaller composite manufacturer by Solvay.
- 2020 Q1: Introduction of a novel manufacturing process for improved composite production efficiency by Toray Advanced Composites.
- 2019 Q2: Partnership between a major automotive OEM and a composite material supplier to develop a new lightweight vehicle body.
In-Depth Automotive Polymer Composites Market Market Outlook
The Automotive Polymer Composites market is poised for significant expansion in the coming years, fueled by continued technological innovation, the growing adoption of lightweight materials across different vehicle segments, and increasing regulatory pressures. Strategic partnerships, focused on research and development, and market expansion strategies are expected to drive substantial long-term growth. The market presents compelling opportunities for companies that can develop and deploy high-performance, sustainable, and cost-effective composite materials to meet the ever-evolving needs of the automotive industry.
Automotive Polymer Composites Market Segmentation
-
1. Resin Type
- 1.1. Polypropylene
- 1.2. Polyurethanes
- 1.3. Nylon
- 1.4. Polyvinyl Chloride
- 1.5. ABS
- 1.6. Polyethylenes
- 1.7. Polycarbonate
- 1.8. Others
-
2. Vehicle Type
- 2.1. Passenger Cars
- 2.2. Light Commercial Vehicles
- 2.3. Trucks and Buses
- 2.4. Other
Automotive Polymer Composites Market Segmentation By Geography
-
1. Asia Pacific
- 1.1. China
- 1.2. India
- 1.3. Japan
- 1.4. South Korea
- 1.5. Malaysia
- 1.6. Thailand
- 1.7. Indonesia
- 1.8. Vietnam
- 1.9. Rest of Asia Pacific
-
2. North America
- 2.1. United States
- 2.2. Canada
- 2.3. Mexico
-
3. Europe
- 3.1. United Kingdom
- 3.2. France
- 3.3. Germany
- 3.4. Italy
- 3.5. Spain
- 3.6. NORDIC Countries
- 3.7. Turkey
- 3.8. Russia
- 3.9. Rest of Europe
-
4. South America
- 4.1. Brazil
- 4.2. Argentina
- 4.3. Colombia
- 4.4. Rest of South America
-
5. Middle East and Africa
- 5.1. Morocco
- 5.2. South Africa
- 5.3. Nigeria
- 5.4. Qatar
- 5.5. Egypt
- 5.6. UAE
- 5.7. Rest of Middle East and Africa
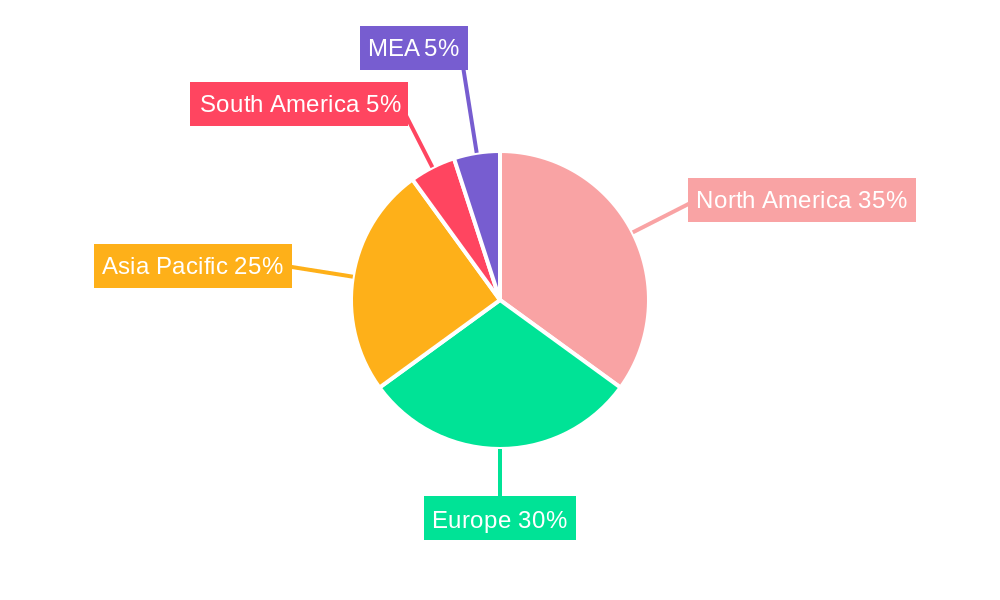
Automotive Polymer Composites Market Regional Market Share
Geographic Coverage of Automotive Polymer Composites Market
Automotive Polymer Composites Market REPORT HIGHLIGHTS
| Aspects | Details |
|---|---|
| Study Period | 2020-2034 |
| Base Year | 2025 |
| Estimated Year | 2026 |
| Forecast Period | 2026-2034 |
| Historical Period | 2020-2025 |
| Growth Rate | CAGR of > 5.00% from 2020-2034 |
| Segmentation |
|
Table of Contents
- 1. Introduction
- 1.1. Research Scope
- 1.2. Market Segmentation
- 1.3. Research Methodology
- 1.4. Definitions and Assumptions
- 2. Executive Summary
- 2.1. Introduction
- 3. Market Dynamics
- 3.1. Introduction
- 3.2. Market Drivers
- 3.2.1. Increasing Use of Composite Material in Light Vehicle Segment; High Growth of the Electric Vehicles Industry; Other Drivers
- 3.3. Market Restrains
- 3.3.1. Safety Concerns about Fire Risk and Crashworthiness; High Processing and Manufacturing Costs
- 3.4. Market Trends
- 3.4.1. Increasing Use of Polymers in the Light Vehicle Segment
- 4. Market Factor Analysis
- 4.1. Porters Five Forces
- 4.2. Supply/Value Chain
- 4.3. PESTEL analysis
- 4.4. Market Entropy
- 4.5. Patent/Trademark Analysis
- 5. Global Automotive Polymer Composites Market Analysis, Insights and Forecast, 2020-2032
- 5.1. Market Analysis, Insights and Forecast - by Resin Type
- 5.1.1. Polypropylene
- 5.1.2. Polyurethanes
- 5.1.3. Nylon
- 5.1.4. Polyvinyl Chloride
- 5.1.5. ABS
- 5.1.6. Polyethylenes
- 5.1.7. Polycarbonate
- 5.1.8. Others
- 5.2. Market Analysis, Insights and Forecast - by Vehicle Type
- 5.2.1. Passenger Cars
- 5.2.2. Light Commercial Vehicles
- 5.2.3. Trucks and Buses
- 5.2.4. Other
- 5.3. Market Analysis, Insights and Forecast - by Region
- 5.3.1. Asia Pacific
- 5.3.2. North America
- 5.3.3. Europe
- 5.3.4. South America
- 5.3.5. Middle East and Africa
- 5.1. Market Analysis, Insights and Forecast - by Resin Type
- 6. Asia Pacific Automotive Polymer Composites Market Analysis, Insights and Forecast, 2020-2032
- 6.1. Market Analysis, Insights and Forecast - by Resin Type
- 6.1.1. Polypropylene
- 6.1.2. Polyurethanes
- 6.1.3. Nylon
- 6.1.4. Polyvinyl Chloride
- 6.1.5. ABS
- 6.1.6. Polyethylenes
- 6.1.7. Polycarbonate
- 6.1.8. Others
- 6.2. Market Analysis, Insights and Forecast - by Vehicle Type
- 6.2.1. Passenger Cars
- 6.2.2. Light Commercial Vehicles
- 6.2.3. Trucks and Buses
- 6.2.4. Other
- 6.1. Market Analysis, Insights and Forecast - by Resin Type
- 7. North America Automotive Polymer Composites Market Analysis, Insights and Forecast, 2020-2032
- 7.1. Market Analysis, Insights and Forecast - by Resin Type
- 7.1.1. Polypropylene
- 7.1.2. Polyurethanes
- 7.1.3. Nylon
- 7.1.4. Polyvinyl Chloride
- 7.1.5. ABS
- 7.1.6. Polyethylenes
- 7.1.7. Polycarbonate
- 7.1.8. Others
- 7.2. Market Analysis, Insights and Forecast - by Vehicle Type
- 7.2.1. Passenger Cars
- 7.2.2. Light Commercial Vehicles
- 7.2.3. Trucks and Buses
- 7.2.4. Other
- 7.1. Market Analysis, Insights and Forecast - by Resin Type
- 8. Europe Automotive Polymer Composites Market Analysis, Insights and Forecast, 2020-2032
- 8.1. Market Analysis, Insights and Forecast - by Resin Type
- 8.1.1. Polypropylene
- 8.1.2. Polyurethanes
- 8.1.3. Nylon
- 8.1.4. Polyvinyl Chloride
- 8.1.5. ABS
- 8.1.6. Polyethylenes
- 8.1.7. Polycarbonate
- 8.1.8. Others
- 8.2. Market Analysis, Insights and Forecast - by Vehicle Type
- 8.2.1. Passenger Cars
- 8.2.2. Light Commercial Vehicles
- 8.2.3. Trucks and Buses
- 8.2.4. Other
- 8.1. Market Analysis, Insights and Forecast - by Resin Type
- 9. South America Automotive Polymer Composites Market Analysis, Insights and Forecast, 2020-2032
- 9.1. Market Analysis, Insights and Forecast - by Resin Type
- 9.1.1. Polypropylene
- 9.1.2. Polyurethanes
- 9.1.3. Nylon
- 9.1.4. Polyvinyl Chloride
- 9.1.5. ABS
- 9.1.6. Polyethylenes
- 9.1.7. Polycarbonate
- 9.1.8. Others
- 9.2. Market Analysis, Insights and Forecast - by Vehicle Type
- 9.2.1. Passenger Cars
- 9.2.2. Light Commercial Vehicles
- 9.2.3. Trucks and Buses
- 9.2.4. Other
- 9.1. Market Analysis, Insights and Forecast - by Resin Type
- 10. Middle East and Africa Automotive Polymer Composites Market Analysis, Insights and Forecast, 2020-2032
- 10.1. Market Analysis, Insights and Forecast - by Resin Type
- 10.1.1. Polypropylene
- 10.1.2. Polyurethanes
- 10.1.3. Nylon
- 10.1.4. Polyvinyl Chloride
- 10.1.5. ABS
- 10.1.6. Polyethylenes
- 10.1.7. Polycarbonate
- 10.1.8. Others
- 10.2. Market Analysis, Insights and Forecast - by Vehicle Type
- 10.2.1. Passenger Cars
- 10.2.2. Light Commercial Vehicles
- 10.2.3. Trucks and Buses
- 10.2.4. Other
- 10.1. Market Analysis, Insights and Forecast - by Resin Type
- 11. Competitive Analysis
- 11.1. Global Market Share Analysis 2025
- 11.2. Company Profiles
- 11.2.1 SGL Carbon
- 11.2.1.1. Overview
- 11.2.1.2. Products
- 11.2.1.3. SWOT Analysis
- 11.2.1.4. Recent Developments
- 11.2.1.5. Financials (Based on Availability)
- 11.2.2 Kolon Industries
- 11.2.2.1. Overview
- 11.2.2.2. Products
- 11.2.2.3. SWOT Analysis
- 11.2.2.4. Recent Developments
- 11.2.2.5. Financials (Based on Availability)
- 11.2.3 Solvay
- 11.2.3.1. Overview
- 11.2.3.2. Products
- 11.2.3.3. SWOT Analysis
- 11.2.3.4. Recent Developments
- 11.2.3.5. Financials (Based on Availability)
- 11.2.4 Mitsubishi Chemical Corporatio
- 11.2.4.1. Overview
- 11.2.4.2. Products
- 11.2.4.3. SWOT Analysis
- 11.2.4.4. Recent Developments
- 11.2.4.5. Financials (Based on Availability)
- 11.2.5 Toray Advanced Composites
- 11.2.5.1. Overview
- 11.2.5.2. Products
- 11.2.5.3. SWOT Analysis
- 11.2.5.4. Recent Developments
- 11.2.5.5. Financials (Based on Availability)
- 11.2.6 Teijin Carbon
- 11.2.6.1. Overview
- 11.2.6.2. Products
- 11.2.6.3. SWOT Analysis
- 11.2.6.4. Recent Developments
- 11.2.6.5. Financials (Based on Availability)
- 11.2.7 Gurit Services AG
- 11.2.7.1. Overview
- 11.2.7.2. Products
- 11.2.7.3. SWOT Analysis
- 11.2.7.4. Recent Developments
- 11.2.7.5. Financials (Based on Availability)
- 11.2.8 UFP Technologies Inc
- 11.2.8.1. Overview
- 11.2.8.2. Products
- 11.2.8.3. SWOT Analysis
- 11.2.8.4. Recent Developments
- 11.2.8.5. Financials (Based on Availability)
- 11.2.9 Owens Corning
- 11.2.9.1. Overview
- 11.2.9.2. Products
- 11.2.9.3. SWOT Analysis
- 11.2.9.4. Recent Developments
- 11.2.9.5. Financials (Based on Availability)
- 11.2.10 BASF SE
- 11.2.10.1. Overview
- 11.2.10.2. Products
- 11.2.10.3. SWOT Analysis
- 11.2.10.4. Recent Developments
- 11.2.10.5. Financials (Based on Availability)
- 11.2.11 Plasan Sasa Ltd
- 11.2.11.1. Overview
- 11.2.11.2. Products
- 11.2.11.3. SWOT Analysis
- 11.2.11.4. Recent Developments
- 11.2.11.5. Financials (Based on Availability)
- 11.2.12 DuPont
- 11.2.12.1. Overview
- 11.2.12.2. Products
- 11.2.12.3. SWOT Analysis
- 11.2.12.4. Recent Developments
- 11.2.12.5. Financials (Based on Availability)
- 11.2.13 Hexcel Corporation
- 11.2.13.1. Overview
- 11.2.13.2. Products
- 11.2.13.3. SWOT Analysis
- 11.2.13.4. Recent Developments
- 11.2.13.5. Financials (Based on Availability)
- 11.2.14 Covestro AG
- 11.2.14.1. Overview
- 11.2.14.2. Products
- 11.2.14.3. SWOT Analysis
- 11.2.14.4. Recent Developments
- 11.2.14.5. Financials (Based on Availability)
- 11.2.15 Johns Manville
- 11.2.15.1. Overview
- 11.2.15.2. Products
- 11.2.15.3. SWOT Analysis
- 11.2.15.4. Recent Developments
- 11.2.15.5. Financials (Based on Availability)
- 11.2.16 Pyrophobic Systems Ltd
- 11.2.16.1. Overview
- 11.2.16.2. Products
- 11.2.16.3. SWOT Analysis
- 11.2.16.4. Recent Developments
- 11.2.16.5. Financials (Based on Availability)
- 11.2.1 SGL Carbon
List of Figures
- Figure 1: Global Automotive Polymer Composites Market Revenue Breakdown (Million, %) by Region 2025 & 2033
- Figure 2: Global Automotive Polymer Composites Market Volume Breakdown (Million, %) by Region 2025 & 2033
- Figure 3: Asia Pacific Automotive Polymer Composites Market Revenue (Million), by Resin Type 2025 & 2033
- Figure 4: Asia Pacific Automotive Polymer Composites Market Volume (Million), by Resin Type 2025 & 2033
- Figure 5: Asia Pacific Automotive Polymer Composites Market Revenue Share (%), by Resin Type 2025 & 2033
- Figure 6: Asia Pacific Automotive Polymer Composites Market Volume Share (%), by Resin Type 2025 & 2033
- Figure 7: Asia Pacific Automotive Polymer Composites Market Revenue (Million), by Vehicle Type 2025 & 2033
- Figure 8: Asia Pacific Automotive Polymer Composites Market Volume (Million), by Vehicle Type 2025 & 2033
- Figure 9: Asia Pacific Automotive Polymer Composites Market Revenue Share (%), by Vehicle Type 2025 & 2033
- Figure 10: Asia Pacific Automotive Polymer Composites Market Volume Share (%), by Vehicle Type 2025 & 2033
- Figure 11: Asia Pacific Automotive Polymer Composites Market Revenue (Million), by Country 2025 & 2033
- Figure 12: Asia Pacific Automotive Polymer Composites Market Volume (Million), by Country 2025 & 2033
- Figure 13: Asia Pacific Automotive Polymer Composites Market Revenue Share (%), by Country 2025 & 2033
- Figure 14: Asia Pacific Automotive Polymer Composites Market Volume Share (%), by Country 2025 & 2033
- Figure 15: North America Automotive Polymer Composites Market Revenue (Million), by Resin Type 2025 & 2033
- Figure 16: North America Automotive Polymer Composites Market Volume (Million), by Resin Type 2025 & 2033
- Figure 17: North America Automotive Polymer Composites Market Revenue Share (%), by Resin Type 2025 & 2033
- Figure 18: North America Automotive Polymer Composites Market Volume Share (%), by Resin Type 2025 & 2033
- Figure 19: North America Automotive Polymer Composites Market Revenue (Million), by Vehicle Type 2025 & 2033
- Figure 20: North America Automotive Polymer Composites Market Volume (Million), by Vehicle Type 2025 & 2033
- Figure 21: North America Automotive Polymer Composites Market Revenue Share (%), by Vehicle Type 2025 & 2033
- Figure 22: North America Automotive Polymer Composites Market Volume Share (%), by Vehicle Type 2025 & 2033
- Figure 23: North America Automotive Polymer Composites Market Revenue (Million), by Country 2025 & 2033
- Figure 24: North America Automotive Polymer Composites Market Volume (Million), by Country 2025 & 2033
- Figure 25: North America Automotive Polymer Composites Market Revenue Share (%), by Country 2025 & 2033
- Figure 26: North America Automotive Polymer Composites Market Volume Share (%), by Country 2025 & 2033
- Figure 27: Europe Automotive Polymer Composites Market Revenue (Million), by Resin Type 2025 & 2033
- Figure 28: Europe Automotive Polymer Composites Market Volume (Million), by Resin Type 2025 & 2033
- Figure 29: Europe Automotive Polymer Composites Market Revenue Share (%), by Resin Type 2025 & 2033
- Figure 30: Europe Automotive Polymer Composites Market Volume Share (%), by Resin Type 2025 & 2033
- Figure 31: Europe Automotive Polymer Composites Market Revenue (Million), by Vehicle Type 2025 & 2033
- Figure 32: Europe Automotive Polymer Composites Market Volume (Million), by Vehicle Type 2025 & 2033
- Figure 33: Europe Automotive Polymer Composites Market Revenue Share (%), by Vehicle Type 2025 & 2033
- Figure 34: Europe Automotive Polymer Composites Market Volume Share (%), by Vehicle Type 2025 & 2033
- Figure 35: Europe Automotive Polymer Composites Market Revenue (Million), by Country 2025 & 2033
- Figure 36: Europe Automotive Polymer Composites Market Volume (Million), by Country 2025 & 2033
- Figure 37: Europe Automotive Polymer Composites Market Revenue Share (%), by Country 2025 & 2033
- Figure 38: Europe Automotive Polymer Composites Market Volume Share (%), by Country 2025 & 2033
- Figure 39: South America Automotive Polymer Composites Market Revenue (Million), by Resin Type 2025 & 2033
- Figure 40: South America Automotive Polymer Composites Market Volume (Million), by Resin Type 2025 & 2033
- Figure 41: South America Automotive Polymer Composites Market Revenue Share (%), by Resin Type 2025 & 2033
- Figure 42: South America Automotive Polymer Composites Market Volume Share (%), by Resin Type 2025 & 2033
- Figure 43: South America Automotive Polymer Composites Market Revenue (Million), by Vehicle Type 2025 & 2033
- Figure 44: South America Automotive Polymer Composites Market Volume (Million), by Vehicle Type 2025 & 2033
- Figure 45: South America Automotive Polymer Composites Market Revenue Share (%), by Vehicle Type 2025 & 2033
- Figure 46: South America Automotive Polymer Composites Market Volume Share (%), by Vehicle Type 2025 & 2033
- Figure 47: South America Automotive Polymer Composites Market Revenue (Million), by Country 2025 & 2033
- Figure 48: South America Automotive Polymer Composites Market Volume (Million), by Country 2025 & 2033
- Figure 49: South America Automotive Polymer Composites Market Revenue Share (%), by Country 2025 & 2033
- Figure 50: South America Automotive Polymer Composites Market Volume Share (%), by Country 2025 & 2033
- Figure 51: Middle East and Africa Automotive Polymer Composites Market Revenue (Million), by Resin Type 2025 & 2033
- Figure 52: Middle East and Africa Automotive Polymer Composites Market Volume (Million), by Resin Type 2025 & 2033
- Figure 53: Middle East and Africa Automotive Polymer Composites Market Revenue Share (%), by Resin Type 2025 & 2033
- Figure 54: Middle East and Africa Automotive Polymer Composites Market Volume Share (%), by Resin Type 2025 & 2033
- Figure 55: Middle East and Africa Automotive Polymer Composites Market Revenue (Million), by Vehicle Type 2025 & 2033
- Figure 56: Middle East and Africa Automotive Polymer Composites Market Volume (Million), by Vehicle Type 2025 & 2033
- Figure 57: Middle East and Africa Automotive Polymer Composites Market Revenue Share (%), by Vehicle Type 2025 & 2033
- Figure 58: Middle East and Africa Automotive Polymer Composites Market Volume Share (%), by Vehicle Type 2025 & 2033
- Figure 59: Middle East and Africa Automotive Polymer Composites Market Revenue (Million), by Country 2025 & 2033
- Figure 60: Middle East and Africa Automotive Polymer Composites Market Volume (Million), by Country 2025 & 2033
- Figure 61: Middle East and Africa Automotive Polymer Composites Market Revenue Share (%), by Country 2025 & 2033
- Figure 62: Middle East and Africa Automotive Polymer Composites Market Volume Share (%), by Country 2025 & 2033
List of Tables
- Table 1: Global Automotive Polymer Composites Market Revenue Million Forecast, by Resin Type 2020 & 2033
- Table 2: Global Automotive Polymer Composites Market Volume Million Forecast, by Resin Type 2020 & 2033
- Table 3: Global Automotive Polymer Composites Market Revenue Million Forecast, by Vehicle Type 2020 & 2033
- Table 4: Global Automotive Polymer Composites Market Volume Million Forecast, by Vehicle Type 2020 & 2033
- Table 5: Global Automotive Polymer Composites Market Revenue Million Forecast, by Region 2020 & 2033
- Table 6: Global Automotive Polymer Composites Market Volume Million Forecast, by Region 2020 & 2033
- Table 7: Global Automotive Polymer Composites Market Revenue Million Forecast, by Resin Type 2020 & 2033
- Table 8: Global Automotive Polymer Composites Market Volume Million Forecast, by Resin Type 2020 & 2033
- Table 9: Global Automotive Polymer Composites Market Revenue Million Forecast, by Vehicle Type 2020 & 2033
- Table 10: Global Automotive Polymer Composites Market Volume Million Forecast, by Vehicle Type 2020 & 2033
- Table 11: Global Automotive Polymer Composites Market Revenue Million Forecast, by Country 2020 & 2033
- Table 12: Global Automotive Polymer Composites Market Volume Million Forecast, by Country 2020 & 2033
- Table 13: China Automotive Polymer Composites Market Revenue (Million) Forecast, by Application 2020 & 2033
- Table 14: China Automotive Polymer Composites Market Volume (Million) Forecast, by Application 2020 & 2033
- Table 15: India Automotive Polymer Composites Market Revenue (Million) Forecast, by Application 2020 & 2033
- Table 16: India Automotive Polymer Composites Market Volume (Million) Forecast, by Application 2020 & 2033
- Table 17: Japan Automotive Polymer Composites Market Revenue (Million) Forecast, by Application 2020 & 2033
- Table 18: Japan Automotive Polymer Composites Market Volume (Million) Forecast, by Application 2020 & 2033
- Table 19: South Korea Automotive Polymer Composites Market Revenue (Million) Forecast, by Application 2020 & 2033
- Table 20: South Korea Automotive Polymer Composites Market Volume (Million) Forecast, by Application 2020 & 2033
- Table 21: Malaysia Automotive Polymer Composites Market Revenue (Million) Forecast, by Application 2020 & 2033
- Table 22: Malaysia Automotive Polymer Composites Market Volume (Million) Forecast, by Application 2020 & 2033
- Table 23: Thailand Automotive Polymer Composites Market Revenue (Million) Forecast, by Application 2020 & 2033
- Table 24: Thailand Automotive Polymer Composites Market Volume (Million) Forecast, by Application 2020 & 2033
- Table 25: Indonesia Automotive Polymer Composites Market Revenue (Million) Forecast, by Application 2020 & 2033
- Table 26: Indonesia Automotive Polymer Composites Market Volume (Million) Forecast, by Application 2020 & 2033
- Table 27: Vietnam Automotive Polymer Composites Market Revenue (Million) Forecast, by Application 2020 & 2033
- Table 28: Vietnam Automotive Polymer Composites Market Volume (Million) Forecast, by Application 2020 & 2033
- Table 29: Rest of Asia Pacific Automotive Polymer Composites Market Revenue (Million) Forecast, by Application 2020 & 2033
- Table 30: Rest of Asia Pacific Automotive Polymer Composites Market Volume (Million) Forecast, by Application 2020 & 2033
- Table 31: Global Automotive Polymer Composites Market Revenue Million Forecast, by Resin Type 2020 & 2033
- Table 32: Global Automotive Polymer Composites Market Volume Million Forecast, by Resin Type 2020 & 2033
- Table 33: Global Automotive Polymer Composites Market Revenue Million Forecast, by Vehicle Type 2020 & 2033
- Table 34: Global Automotive Polymer Composites Market Volume Million Forecast, by Vehicle Type 2020 & 2033
- Table 35: Global Automotive Polymer Composites Market Revenue Million Forecast, by Country 2020 & 2033
- Table 36: Global Automotive Polymer Composites Market Volume Million Forecast, by Country 2020 & 2033
- Table 37: United States Automotive Polymer Composites Market Revenue (Million) Forecast, by Application 2020 & 2033
- Table 38: United States Automotive Polymer Composites Market Volume (Million) Forecast, by Application 2020 & 2033
- Table 39: Canada Automotive Polymer Composites Market Revenue (Million) Forecast, by Application 2020 & 2033
- Table 40: Canada Automotive Polymer Composites Market Volume (Million) Forecast, by Application 2020 & 2033
- Table 41: Mexico Automotive Polymer Composites Market Revenue (Million) Forecast, by Application 2020 & 2033
- Table 42: Mexico Automotive Polymer Composites Market Volume (Million) Forecast, by Application 2020 & 2033
- Table 43: Global Automotive Polymer Composites Market Revenue Million Forecast, by Resin Type 2020 & 2033
- Table 44: Global Automotive Polymer Composites Market Volume Million Forecast, by Resin Type 2020 & 2033
- Table 45: Global Automotive Polymer Composites Market Revenue Million Forecast, by Vehicle Type 2020 & 2033
- Table 46: Global Automotive Polymer Composites Market Volume Million Forecast, by Vehicle Type 2020 & 2033
- Table 47: Global Automotive Polymer Composites Market Revenue Million Forecast, by Country 2020 & 2033
- Table 48: Global Automotive Polymer Composites Market Volume Million Forecast, by Country 2020 & 2033
- Table 49: United Kingdom Automotive Polymer Composites Market Revenue (Million) Forecast, by Application 2020 & 2033
- Table 50: United Kingdom Automotive Polymer Composites Market Volume (Million) Forecast, by Application 2020 & 2033
- Table 51: France Automotive Polymer Composites Market Revenue (Million) Forecast, by Application 2020 & 2033
- Table 52: France Automotive Polymer Composites Market Volume (Million) Forecast, by Application 2020 & 2033
- Table 53: Germany Automotive Polymer Composites Market Revenue (Million) Forecast, by Application 2020 & 2033
- Table 54: Germany Automotive Polymer Composites Market Volume (Million) Forecast, by Application 2020 & 2033
- Table 55: Italy Automotive Polymer Composites Market Revenue (Million) Forecast, by Application 2020 & 2033
- Table 56: Italy Automotive Polymer Composites Market Volume (Million) Forecast, by Application 2020 & 2033
- Table 57: Spain Automotive Polymer Composites Market Revenue (Million) Forecast, by Application 2020 & 2033
- Table 58: Spain Automotive Polymer Composites Market Volume (Million) Forecast, by Application 2020 & 2033
- Table 59: NORDIC Countries Automotive Polymer Composites Market Revenue (Million) Forecast, by Application 2020 & 2033
- Table 60: NORDIC Countries Automotive Polymer Composites Market Volume (Million) Forecast, by Application 2020 & 2033
- Table 61: Turkey Automotive Polymer Composites Market Revenue (Million) Forecast, by Application 2020 & 2033
- Table 62: Turkey Automotive Polymer Composites Market Volume (Million) Forecast, by Application 2020 & 2033
- Table 63: Russia Automotive Polymer Composites Market Revenue (Million) Forecast, by Application 2020 & 2033
- Table 64: Russia Automotive Polymer Composites Market Volume (Million) Forecast, by Application 2020 & 2033
- Table 65: Rest of Europe Automotive Polymer Composites Market Revenue (Million) Forecast, by Application 2020 & 2033
- Table 66: Rest of Europe Automotive Polymer Composites Market Volume (Million) Forecast, by Application 2020 & 2033
- Table 67: Global Automotive Polymer Composites Market Revenue Million Forecast, by Resin Type 2020 & 2033
- Table 68: Global Automotive Polymer Composites Market Volume Million Forecast, by Resin Type 2020 & 2033
- Table 69: Global Automotive Polymer Composites Market Revenue Million Forecast, by Vehicle Type 2020 & 2033
- Table 70: Global Automotive Polymer Composites Market Volume Million Forecast, by Vehicle Type 2020 & 2033
- Table 71: Global Automotive Polymer Composites Market Revenue Million Forecast, by Country 2020 & 2033
- Table 72: Global Automotive Polymer Composites Market Volume Million Forecast, by Country 2020 & 2033
- Table 73: Brazil Automotive Polymer Composites Market Revenue (Million) Forecast, by Application 2020 & 2033
- Table 74: Brazil Automotive Polymer Composites Market Volume (Million) Forecast, by Application 2020 & 2033
- Table 75: Argentina Automotive Polymer Composites Market Revenue (Million) Forecast, by Application 2020 & 2033
- Table 76: Argentina Automotive Polymer Composites Market Volume (Million) Forecast, by Application 2020 & 2033
- Table 77: Colombia Automotive Polymer Composites Market Revenue (Million) Forecast, by Application 2020 & 2033
- Table 78: Colombia Automotive Polymer Composites Market Volume (Million) Forecast, by Application 2020 & 2033
- Table 79: Rest of South America Automotive Polymer Composites Market Revenue (Million) Forecast, by Application 2020 & 2033
- Table 80: Rest of South America Automotive Polymer Composites Market Volume (Million) Forecast, by Application 2020 & 2033
- Table 81: Global Automotive Polymer Composites Market Revenue Million Forecast, by Resin Type 2020 & 2033
- Table 82: Global Automotive Polymer Composites Market Volume Million Forecast, by Resin Type 2020 & 2033
- Table 83: Global Automotive Polymer Composites Market Revenue Million Forecast, by Vehicle Type 2020 & 2033
- Table 84: Global Automotive Polymer Composites Market Volume Million Forecast, by Vehicle Type 2020 & 2033
- Table 85: Global Automotive Polymer Composites Market Revenue Million Forecast, by Country 2020 & 2033
- Table 86: Global Automotive Polymer Composites Market Volume Million Forecast, by Country 2020 & 2033
- Table 87: Morocco Automotive Polymer Composites Market Revenue (Million) Forecast, by Application 2020 & 2033
- Table 88: Morocco Automotive Polymer Composites Market Volume (Million) Forecast, by Application 2020 & 2033
- Table 89: South Africa Automotive Polymer Composites Market Revenue (Million) Forecast, by Application 2020 & 2033
- Table 90: South Africa Automotive Polymer Composites Market Volume (Million) Forecast, by Application 2020 & 2033
- Table 91: Nigeria Automotive Polymer Composites Market Revenue (Million) Forecast, by Application 2020 & 2033
- Table 92: Nigeria Automotive Polymer Composites Market Volume (Million) Forecast, by Application 2020 & 2033
- Table 93: Qatar Automotive Polymer Composites Market Revenue (Million) Forecast, by Application 2020 & 2033
- Table 94: Qatar Automotive Polymer Composites Market Volume (Million) Forecast, by Application 2020 & 2033
- Table 95: Egypt Automotive Polymer Composites Market Revenue (Million) Forecast, by Application 2020 & 2033
- Table 96: Egypt Automotive Polymer Composites Market Volume (Million) Forecast, by Application 2020 & 2033
- Table 97: UAE Automotive Polymer Composites Market Revenue (Million) Forecast, by Application 2020 & 2033
- Table 98: UAE Automotive Polymer Composites Market Volume (Million) Forecast, by Application 2020 & 2033
- Table 99: Rest of Middle East and Africa Automotive Polymer Composites Market Revenue (Million) Forecast, by Application 2020 & 2033
- Table 100: Rest of Middle East and Africa Automotive Polymer Composites Market Volume (Million) Forecast, by Application 2020 & 2033
Frequently Asked Questions
1. What is the projected Compound Annual Growth Rate (CAGR) of the Automotive Polymer Composites Market?
The projected CAGR is approximately > 5.00%.
2. Which companies are prominent players in the Automotive Polymer Composites Market?
Key companies in the market include SGL Carbon, Kolon Industries, Solvay, Mitsubishi Chemical Corporatio, Toray Advanced Composites, Teijin Carbon, Gurit Services AG, UFP Technologies Inc , Owens Corning, BASF SE, Plasan Sasa Ltd, DuPont, Hexcel Corporation, Covestro AG, Johns Manville, Pyrophobic Systems Ltd.
3. What are the main segments of the Automotive Polymer Composites Market?
The market segments include Resin Type, Vehicle Type.
4. Can you provide details about the market size?
The market size is estimated to be USD XX Million as of 2022.
5. What are some drivers contributing to market growth?
Increasing Use of Composite Material in Light Vehicle Segment; High Growth of the Electric Vehicles Industry; Other Drivers.
6. What are the notable trends driving market growth?
Increasing Use of Polymers in the Light Vehicle Segment.
7. Are there any restraints impacting market growth?
Safety Concerns about Fire Risk and Crashworthiness; High Processing and Manufacturing Costs.
8. Can you provide examples of recent developments in the market?
N/A
9. What pricing options are available for accessing the report?
Pricing options include single-user, multi-user, and enterprise licenses priced at USD 4750, USD 5250, and USD 8750 respectively.
10. Is the market size provided in terms of value or volume?
The market size is provided in terms of value, measured in Million and volume, measured in Million.
11. Are there any specific market keywords associated with the report?
Yes, the market keyword associated with the report is "Automotive Polymer Composites Market," which aids in identifying and referencing the specific market segment covered.
12. How do I determine which pricing option suits my needs best?
The pricing options vary based on user requirements and access needs. Individual users may opt for single-user licenses, while businesses requiring broader access may choose multi-user or enterprise licenses for cost-effective access to the report.
13. Are there any additional resources or data provided in the Automotive Polymer Composites Market report?
While the report offers comprehensive insights, it's advisable to review the specific contents or supplementary materials provided to ascertain if additional resources or data are available.
14. How can I stay updated on further developments or reports in the Automotive Polymer Composites Market?
To stay informed about further developments, trends, and reports in the Automotive Polymer Composites Market, consider subscribing to industry newsletters, following relevant companies and organizations, or regularly checking reputable industry news sources and publications.
Methodology
Step 1 - Identification of Relevant Samples Size from Population Database


Step 2 - Approaches for Defining Global Market Size (Value, Volume* & Price*)

Note*: In applicable scenarios
Step 3 - Data Sources
Primary Research
- Web Analytics
- Survey Reports
- Research Institute
- Latest Research Reports
- Opinion Leaders
Secondary Research
- Annual Reports
- White Paper
- Latest Press Release
- Industry Association
- Paid Database
- Investor Presentations

Step 4 - Data Triangulation
Involves using different sources of information in order to increase the validity of a study
These sources are likely to be stakeholders in a program - participants, other researchers, program staff, other community members, and so on.
Then we put all data in single framework & apply various statistical tools to find out the dynamic on the market.
During the analysis stage, feedback from the stakeholder groups would be compared to determine areas of agreement as well as areas of divergence