

Key Insights
The Indian Buy Now, Pay Later (BNPL) market is exhibiting substantial growth, driven by widespread smartphone adoption, enhanced digital literacy, and a rapidly expanding e-commerce sector. The market, projected to reach $21.95 billion by 2025, is anticipated to grow at a Compound Annual Growth Rate (CAGR) of 13.4% through 2033. This accelerated expansion is attributed to the inherent convenience and accessibility of BNPL for both online and offline transactions, especially among younger consumers. Aggressive marketing by numerous BNPL providers and their integration into major e-commerce platforms further fuel this growth. However, regulatory ambiguities and potential consumer debt risks present notable market restraints. The industry's segmentation highlights a diverse landscape, with established e-commerce players offering proprietary BNPL solutions and smaller fintech firms targeting niche markets. The competitive environment is intense, featuring prominent players like Paytm Postpaid and Flipkart Pay Later, alongside emerging companies such as Slice and Kreditbee.
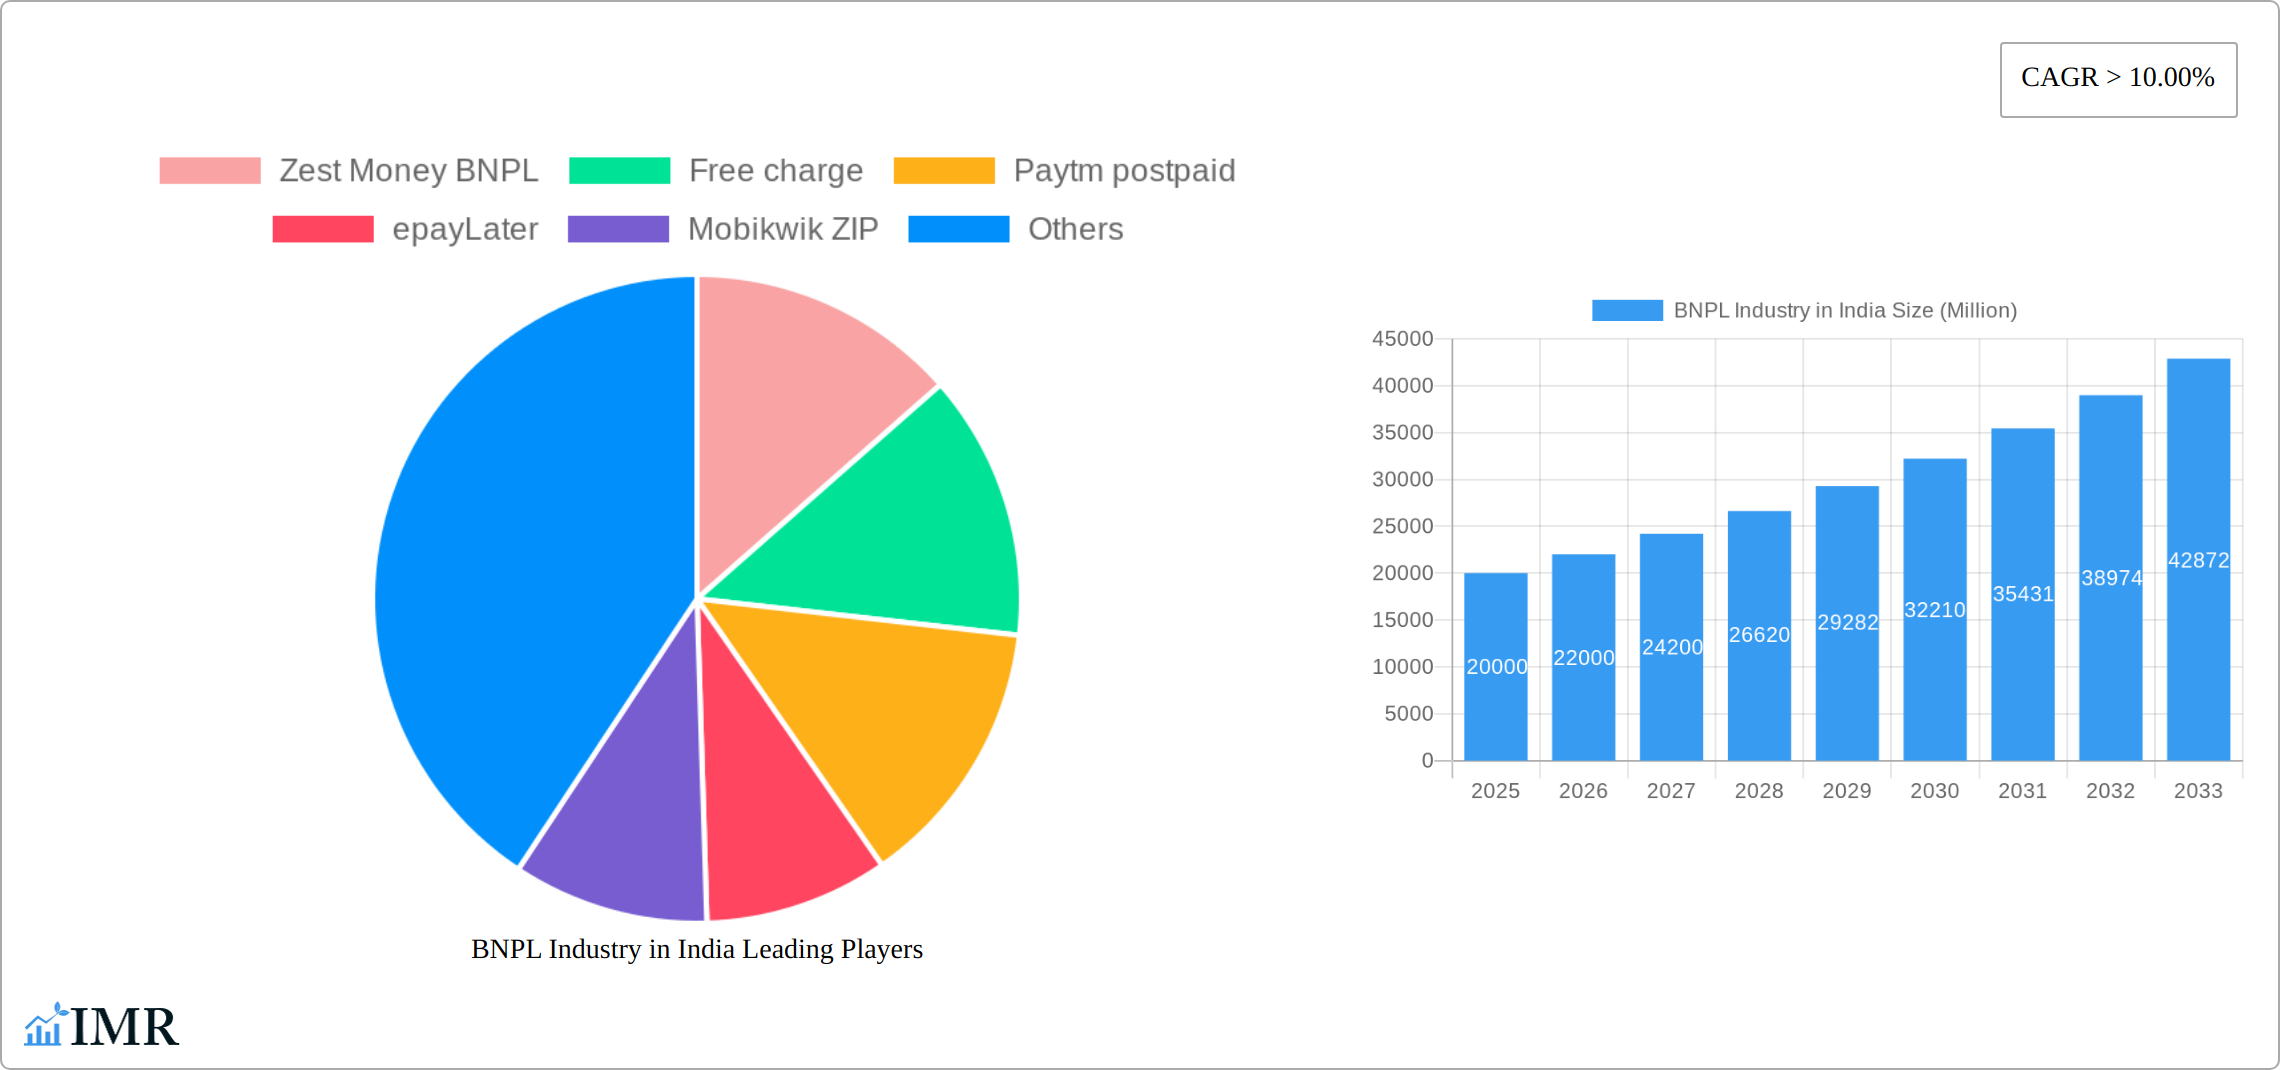
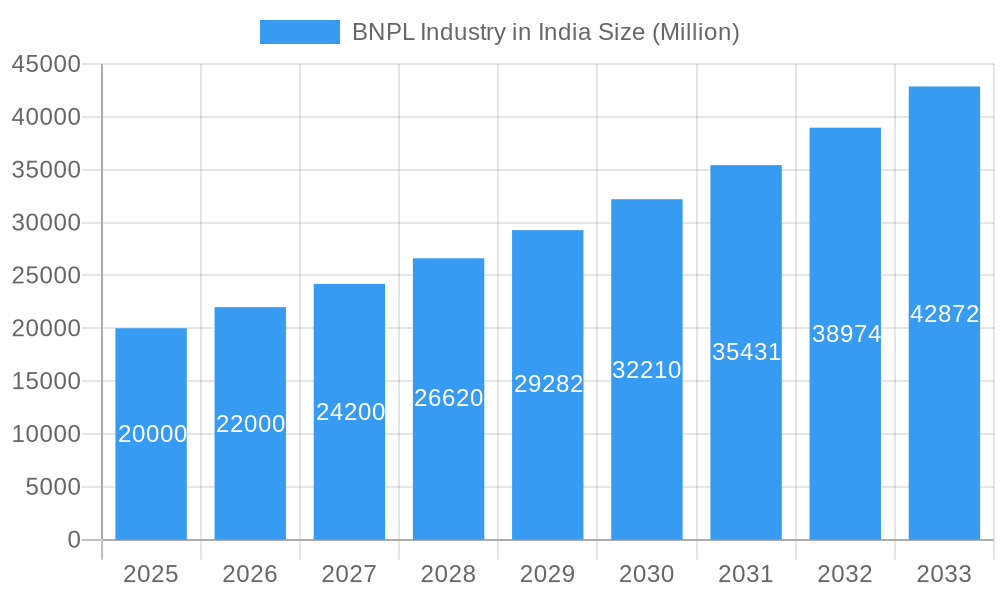
BNPL Industry in India Market Size (In Billion)
Future growth in the Indian BNPL market will be shaped by several key trends. The integration of embedded finance will embed BNPL solutions across a wider array of applications and platforms. Enhanced risk management strategies, encompassing advanced credit scoring and fraud detection, will be vital for mitigating potential risks. The establishment of a well-defined regulatory framework will be instrumental in ensuring sustainable market expansion and consumer protection. Diversifying BNPL services for underserved demographics and extending their reach into offline retail environments will also significantly influence the industry's trajectory. Despite ongoing challenges, the long-term outlook for the Indian BNPL market remains exceptionally promising, supported by robust economic expansion and the ongoing digitization of the Indian economy.
BNPL Industry in India Company Market Share
BNPL Industry in India: A Comprehensive Market Report (2019-2033)
This in-depth report provides a comprehensive analysis of the Buy Now Pay Later (BNPL) industry in India, covering market dynamics, growth trends, key players, and future outlook. With a study period spanning 2019-2033, a base year of 2025, and a forecast period of 2025-2033, this report is an essential resource for industry professionals, investors, and anyone seeking to understand this rapidly evolving market. The report utilizes data measured in millions of units.
BNPL Industry in India Market Dynamics & Structure
The Indian BNPL market exhibits a dynamic interplay of factors shaping its structure and growth. Market concentration is relatively high, with a few major players dominating, though numerous smaller players also contribute. Technological innovation, particularly in areas like AI-driven risk assessment and seamless integration with e-commerce platforms, is a key driver. The regulatory framework, while evolving, significantly impacts market operations and player strategies, influencing adoption rates and consumer protection measures. Competitive substitutes, such as traditional credit cards and personal loans, continuously challenge BNPL’s market share. The end-user demographic is largely skewed toward young, tech-savvy urban populations, though expansion to Tier II and III cities is underway. M&A activity has been significant, with larger players consolidating market share through acquisitions of smaller firms. The total M&A deal volume during the period 2020-2024 reached approximately xx Million.
- Market Concentration: High, with top 5 players holding ~xx% market share (2024).
- Technological Innovation: AI-driven risk management, seamless integration with e-commerce.
- Regulatory Framework: Evolving, impacting operations and consumer protection.
- Competitive Substitutes: Traditional credit cards, personal loans.
- End-User Demographics: Young, tech-savvy, predominantly urban.
- M&A Trends: Significant consolidation, xx Million in deal volume (2020-2024).
- Innovation Barriers: Data privacy concerns, regulatory uncertainty.
BNPL Industry in India Growth Trends & Insights
The Indian BNPL market has witnessed explosive growth in recent years. Driven by increasing smartphone penetration, rising e-commerce adoption, and a growing preference for flexible payment options, the market size expanded from xx Million in 2019 to xx Million in 2024. This translates to a Compound Annual Growth Rate (CAGR) of xx% during the historical period. Market penetration has also increased significantly, from xx% in 2019 to xx% in 2024. Technological disruptions, particularly the integration of BNPL into various online and offline platforms, further fuel this growth. Consumer behaviour shifts towards instant gratification and digital convenience have strongly contributed to the market’s expansion. The estimated market size in 2025 is xx Million, projected to reach xx Million by 2033, indicating a CAGR of xx% during the forecast period.
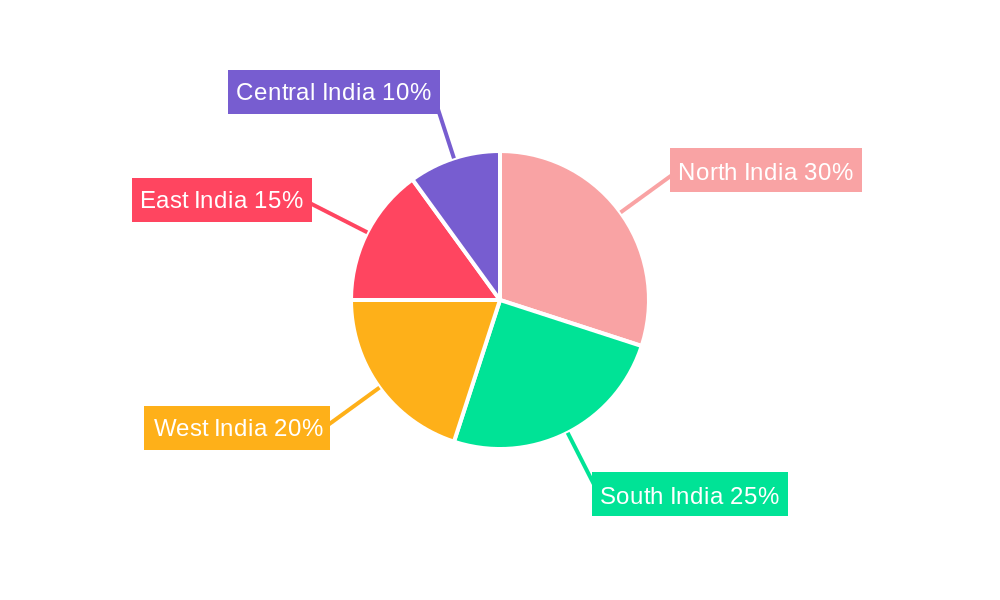
Dominant Regions, Countries, or Segments in BNPL Industry in India
The Indian BNPL market is currently concentrated in its **metropolitan hubs – Mumbai, Delhi, Bengaluru, and Chennai**. These urban centers account for a substantial portion, estimated to be over 70% of total BNPL transactions in 2024. This dominance is fueled by a confluence of factors: high smartphone and internet penetration, a large and digitally native young demographic actively participating in e-commerce, and the robust presence of major e-commerce platforms. A higher concentration of tech-savvy consumers in these cities further amplifies adoption. However, the landscape is evolving, with a significant push towards expansion into Tier II and III cities driven by increasing digital literacy and improving internet infrastructure. Key segments experiencing higher BNPL adoption rates include electronics, fashion, and travel, primarily due to their relatively higher transaction values, making flexible payment options particularly attractive.
- Key Drivers: Pervasive smartphone penetration, widespread internet access, a youthful demographic, and the burgeoning e-commerce ecosystem.
- Dominance Factors: High transaction volumes concentrated in urban centers, significant market share held by established players.
- Growth Potential: Active expansion into Tier II & III cities, tapping into the vast, yet largely untapped, rural markets.
BNPL Industry in India Product Landscape
The BNPL product landscape in India is characterized by diverse offerings, ranging from standalone apps to integrated payment solutions within e-commerce platforms. Products offer varying credit limits, repayment tenures, and interest rates, catering to diverse consumer needs. Innovation focuses on personalized credit scoring, AI-powered fraud detection, and seamless integration with various platforms. Unique selling propositions frequently involve zero-interest periods, cashback rewards, and flexible repayment options. Technological advancements continually improve user experience, security, and risk management capabilities.
Key Drivers, Barriers & Challenges in BNPL Industry in India
Key Drivers: The Indian BNPL industry is propelled by several significant forces. The continuous rise in e-commerce adoption is a primary catalyst, coupled with the ever-increasing smartphone penetration and a strong consumer preference for flexible, instant payment solutions. Furthermore, supportive government initiatives promoting digital payments and financial inclusion are acting as significant accelerators for growth.
Key Challenges: The sector faces notable hurdles, primarily stemming from regulatory uncertainty. The absence of a uniform, comprehensive regulatory framework across states can create operational complexities. Stringent KYC/AML compliance requirements add to operational costs and intricacies. Moreover, the intensely competitive market landscape and the critical need to effectively manage and minimize default rates present ongoing challenges for BNPL providers.
Emerging Opportunities in BNPL Industry in India
Untapped markets in Tier II and III cities present significant growth opportunities. The increasing adoption of BNPL in offline retail channels offers further potential. Innovations like embedded finance and BNPL integration into various fintech apps will create further opportunities. Tailoring products to address niche consumer segments like students and SMEs can drive growth.
Growth Accelerators in the BNPL Industry in India Industry
Strategic partnerships between BNPL providers and e-commerce platforms are crucial for market expansion. Technological advancements, like AI-powered risk assessment, improve efficiency and reduce defaults. Expansion into under-penetrated markets and diversification of product offerings (e.g., travel, education) will significantly accelerate growth.
Key Players Shaping the BNPL Industry in India Market
- ZestMoney
- Freecharge
- Paytm Postpaid
- epayLater
- Mobikwik ZIP
- Flipkart Pay Later
- OlaMoney Postpaid
- MoneyTap
- Simpl
- LazyPay
- Flexmoney
- Amazon Pay Later
- Capital Float
- Slice
- Kreditbee
- Postpe
List Not Exhaustive
Notable Milestones in BNPL Industry in India Sector
- May 2023: ZestMoney set ambitious plans to achieve profitability within a six-month timeframe and successfully secured a new investment round. This strategic shift towards an LSP (Lending Service Provider) model underscores a commitment to sustainable and scalable growth.
- February 2023: The lifting of the ban on several prominent lending applications, including those utilized by LazyPay and KreditBee, marked a significant positive development, leading to an improved and more stable operating environment for the entire BNPL sector in India.
In-Depth BNPL Industry in India Market Outlook
The Indian BNPL market is poised for substantial and sustained long-term growth. The ongoing penetration into previously underserved markets, coupled with continuous technological innovation and the formation of strategic partnerships, are identified as pivotal drivers for future expansion. The market is expected to benefit immensely from the sustained upward trajectory of e-commerce and the widespread adoption of digital payment methods across the nation. Furthermore, the competitive landscape will likely be shaped by strategic acquisitions and the ongoing development of novel, user-centric BNPL products designed to meet evolving consumer needs.
BNPL Industry in India Segmentation
-
1. Channel
- 1.1. Online
- 1.2. POS
-
2. Enterprise
- 2.1. Large Enterprise
- 2.2. Small & medium enterprise
-
3. End-user
- 3.1. Consmer electronics
- 3.2. Fashion & garments
- 3.3. Healthcare
- 3.4. Leisure & entertainment
- 3.5. Retail
- 3.6. Other End-users
BNPL Industry in India Segmentation By Geography
-
1. North America
- 1.1. United States
- 1.2. Canada
- 1.3. Mexico
-
2. South America
- 2.1. Brazil
- 2.2. Argentina
- 2.3. Rest of South America
-
3. Europe
- 3.1. United Kingdom
- 3.2. Germany
- 3.3. France
- 3.4. Italy
- 3.5. Spain
- 3.6. Russia
- 3.7. Benelux
- 3.8. Nordics
- 3.9. Rest of Europe
-
4. Middle East & Africa
- 4.1. Turkey
- 4.2. Israel
- 4.3. GCC
- 4.4. North Africa
- 4.5. South Africa
- 4.6. Rest of Middle East & Africa
-
5. Asia Pacific
- 5.1. China
- 5.2. India
- 5.3. Japan
- 5.4. South Korea
- 5.5. ASEAN
- 5.6. Oceania
- 5.7. Rest of Asia Pacific
BNPL Industry in India Regional Market Share
Geographic Coverage of BNPL Industry in India
BNPL Industry in India REPORT HIGHLIGHTS
| Aspects | Details |
|---|---|
| Study Period | 2020-2034 |
| Base Year | 2025 |
| Estimated Year | 2026 |
| Forecast Period | 2026-2034 |
| Historical Period | 2020-2025 |
| Growth Rate | CAGR of 13.4% from 2020-2034 |
| Segmentation |
|
Table of Contents
- 1. Introduction
- 1.1. Research Scope
- 1.2. Market Segmentation
- 1.3. Research Objective
- 1.4. Definitions and Assumptions
- 2. Executive Summary
- 2.1. Market Snapshot
- 3. Market Dynamics
- 3.1. Market Drivers
- 3.2. Market Restrains
- 3.3. Market Trends
- 3.4. Market Opportunities
- 4. Market Factor Analysis
- 4.1. Porters Five Forces
- 4.1.1. Bargaining Power of Suppliers
- 4.1.2. Bargaining Power of Buyers
- 4.1.3. Threat of New Entrants
- 4.1.4. Threat of Substitutes
- 4.1.5. Competitive Rivalry
- 4.2. PESTEL analysis
- 4.3. BCG Analysis
- 4.3.1. Stars (High Growth, High Market Share)
- 4.3.2. Cash Cows (Low Growth, High Market Share)
- 4.3.3. Question Mark (High Growth, Low Market Share)
- 4.3.4. Dogs (Low Growth, Low Market Share)
- 4.4. Ansoff Matrix Analysis
- 4.5. Supply Chain Analysis
- 4.6. Regulatory Landscape
- 4.7. Current Market Potential and Opportunity Assessment (TAM–SAM–SOM Framework)
- 4.8. IMR Analyst Note
- 4.1. Porters Five Forces
- 5. Market Analysis, Insights and Forecast 2021-2033
- 5.1. Market Analysis, Insights and Forecast - by Channel
- 5.1.1. Online
- 5.1.2. POS
- 5.2. Market Analysis, Insights and Forecast - by Enterprise
- 5.2.1. Large Enterprise
- 5.2.2. Small & medium enterprise
- 5.3. Market Analysis, Insights and Forecast - by End-user
- 5.3.1. Consmer electronics
- 5.3.2. Fashion & garments
- 5.3.3. Healthcare
- 5.3.4. Leisure & entertainment
- 5.3.5. Retail
- 5.3.6. Other End-users
- 5.4. Market Analysis, Insights and Forecast - by Region
- 5.4.1. North America
- 5.4.2. South America
- 5.4.3. Europe
- 5.4.4. Middle East & Africa
- 5.4.5. Asia Pacific
- 5.1. Market Analysis, Insights and Forecast - by Channel
- 6. Global BNPL Industry in India Analysis, Insights and Forecast, 2021-2033
- 6.1. Market Analysis, Insights and Forecast - by Channel
- 6.1.1. Online
- 6.1.2. POS
- 6.2. Market Analysis, Insights and Forecast - by Enterprise
- 6.2.1. Large Enterprise
- 6.2.2. Small & medium enterprise
- 6.3. Market Analysis, Insights and Forecast - by End-user
- 6.3.1. Consmer electronics
- 6.3.2. Fashion & garments
- 6.3.3. Healthcare
- 6.3.4. Leisure & entertainment
- 6.3.5. Retail
- 6.3.6. Other End-users
- 6.1. Market Analysis, Insights and Forecast - by Channel
- 7. North America BNPL Industry in India Analysis, Insights and Forecast, 2020-2032
- 7.1. Market Analysis, Insights and Forecast - by Channel
- 7.1.1. Online
- 7.1.2. POS
- 7.2. Market Analysis, Insights and Forecast - by Enterprise
- 7.2.1. Large Enterprise
- 7.2.2. Small & medium enterprise
- 7.3. Market Analysis, Insights and Forecast - by End-user
- 7.3.1. Consmer electronics
- 7.3.2. Fashion & garments
- 7.3.3. Healthcare
- 7.3.4. Leisure & entertainment
- 7.3.5. Retail
- 7.3.6. Other End-users
- 7.1. Market Analysis, Insights and Forecast - by Channel
- 8. South America BNPL Industry in India Analysis, Insights and Forecast, 2020-2032
- 8.1. Market Analysis, Insights and Forecast - by Channel
- 8.1.1. Online
- 8.1.2. POS
- 8.2. Market Analysis, Insights and Forecast - by Enterprise
- 8.2.1. Large Enterprise
- 8.2.2. Small & medium enterprise
- 8.3. Market Analysis, Insights and Forecast - by End-user
- 8.3.1. Consmer electronics
- 8.3.2. Fashion & garments
- 8.3.3. Healthcare
- 8.3.4. Leisure & entertainment
- 8.3.5. Retail
- 8.3.6. Other End-users
- 8.1. Market Analysis, Insights and Forecast - by Channel
- 9. Europe BNPL Industry in India Analysis, Insights and Forecast, 2020-2032
- 9.1. Market Analysis, Insights and Forecast - by Channel
- 9.1.1. Online
- 9.1.2. POS
- 9.2. Market Analysis, Insights and Forecast - by Enterprise
- 9.2.1. Large Enterprise
- 9.2.2. Small & medium enterprise
- 9.3. Market Analysis, Insights and Forecast - by End-user
- 9.3.1. Consmer electronics
- 9.3.2. Fashion & garments
- 9.3.3. Healthcare
- 9.3.4. Leisure & entertainment
- 9.3.5. Retail
- 9.3.6. Other End-users
- 9.1. Market Analysis, Insights and Forecast - by Channel
- 10. Middle East & Africa BNPL Industry in India Analysis, Insights and Forecast, 2020-2032
- 10.1. Market Analysis, Insights and Forecast - by Channel
- 10.1.1. Online
- 10.1.2. POS
- 10.2. Market Analysis, Insights and Forecast - by Enterprise
- 10.2.1. Large Enterprise
- 10.2.2. Small & medium enterprise
- 10.3. Market Analysis, Insights and Forecast - by End-user
- 10.3.1. Consmer electronics
- 10.3.2. Fashion & garments
- 10.3.3. Healthcare
- 10.3.4. Leisure & entertainment
- 10.3.5. Retail
- 10.3.6. Other End-users
- 10.1. Market Analysis, Insights and Forecast - by Channel
- 11. Asia Pacific BNPL Industry in India Analysis, Insights and Forecast, 2020-2032
- 11.1. Market Analysis, Insights and Forecast - by Channel
- 11.1.1. Online
- 11.1.2. POS
- 11.2. Market Analysis, Insights and Forecast - by Enterprise
- 11.2.1. Large Enterprise
- 11.2.2. Small & medium enterprise
- 11.3. Market Analysis, Insights and Forecast - by End-user
- 11.3.1. Consmer electronics
- 11.3.2. Fashion & garments
- 11.3.3. Healthcare
- 11.3.4. Leisure & entertainment
- 11.3.5. Retail
- 11.3.6. Other End-users
- 11.1. Market Analysis, Insights and Forecast - by Channel
- 12. Competitive Analysis
- 12.1. Company Profiles
- 12.1.1 Zest Money BNPL
- 12.1.1.1. Company Overview
- 12.1.1.2. Products
- 12.1.1.3. Company Financials
- 12.1.1.4. SWOT Analysis
- 12.1.2 Free charge
- 12.1.2.1. Company Overview
- 12.1.2.2. Products
- 12.1.2.3. Company Financials
- 12.1.2.4. SWOT Analysis
- 12.1.3 Paytm postpaid
- 12.1.3.1. Company Overview
- 12.1.3.2. Products
- 12.1.3.3. Company Financials
- 12.1.3.4. SWOT Analysis
- 12.1.4 epayLater
- 12.1.4.1. Company Overview
- 12.1.4.2. Products
- 12.1.4.3. Company Financials
- 12.1.4.4. SWOT Analysis
- 12.1.5 Mobikwik ZIP
- 12.1.5.1. Company Overview
- 12.1.5.2. Products
- 12.1.5.3. Company Financials
- 12.1.5.4. SWOT Analysis
- 12.1.6 Flipkart pay later
- 12.1.6.1. Company Overview
- 12.1.6.2. Products
- 12.1.6.3. Company Financials
- 12.1.6.4. SWOT Analysis
- 12.1.7 Olamoney Postpaid
- 12.1.7.1. Company Overview
- 12.1.7.2. Products
- 12.1.7.3. Company Financials
- 12.1.7.4. SWOT Analysis
- 12.1.8 Money Tap
- 12.1.8.1. Company Overview
- 12.1.8.2. Products
- 12.1.8.3. Company Financials
- 12.1.8.4. SWOT Analysis
- 12.1.9 Simpl
- 12.1.9.1. Company Overview
- 12.1.9.2. Products
- 12.1.9.3. Company Financials
- 12.1.9.4. SWOT Analysis
- 12.1.10 Lazy Pay
- 12.1.10.1. Company Overview
- 12.1.10.2. Products
- 12.1.10.3. Company Financials
- 12.1.10.4. SWOT Analysis
- 12.1.11 Flexmoney
- 12.1.11.1. Company Overview
- 12.1.11.2. Products
- 12.1.11.3. Company Financials
- 12.1.11.4. SWOT Analysis
- 12.1.12 Amazon Pay later
- 12.1.12.1. Company Overview
- 12.1.12.2. Products
- 12.1.12.3. Company Financials
- 12.1.12.4. SWOT Analysis
- 12.1.13 Capital float
- 12.1.13.1. Company Overview
- 12.1.13.2. Products
- 12.1.13.3. Company Financials
- 12.1.13.4. SWOT Analysis
- 12.1.14 Slice
- 12.1.14.1. Company Overview
- 12.1.14.2. Products
- 12.1.14.3. Company Financials
- 12.1.14.4. SWOT Analysis
- 12.1.15 Kreditbee
- 12.1.15.1. Company Overview
- 12.1.15.2. Products
- 12.1.15.3. Company Financials
- 12.1.15.4. SWOT Analysis
- 12.1.16 Postpe**List Not Exhaustive
- 12.1.16.1. Company Overview
- 12.1.16.2. Products
- 12.1.16.3. Company Financials
- 12.1.16.4. SWOT Analysis
- 12.1.1 Zest Money BNPL
- 12.2. Market Entropy
- 12.2.1 Company's Key Areas Served
- 12.2.2 Recent Developments
- 12.3. Company Market Share Analysis 2025
- 12.3.1 Top 5 Companies Market Share Analysis
- 12.3.2 Top 3 Companies Market Share Analysis
- 12.4. List of Potential Customers
- 13. Research Methodology
List of Figures
- Figure 1: Global BNPL Industry in India Revenue Breakdown (billion, %) by Region 2025 & 2033
- Figure 2: North America BNPL Industry in India Revenue (billion), by Channel 2025 & 2033
- Figure 3: North America BNPL Industry in India Revenue Share (%), by Channel 2025 & 2033
- Figure 4: North America BNPL Industry in India Revenue (billion), by Enterprise 2025 & 2033
- Figure 5: North America BNPL Industry in India Revenue Share (%), by Enterprise 2025 & 2033
- Figure 6: North America BNPL Industry in India Revenue (billion), by End-user 2025 & 2033
- Figure 7: North America BNPL Industry in India Revenue Share (%), by End-user 2025 & 2033
- Figure 8: North America BNPL Industry in India Revenue (billion), by Country 2025 & 2033
- Figure 9: North America BNPL Industry in India Revenue Share (%), by Country 2025 & 2033
- Figure 10: South America BNPL Industry in India Revenue (billion), by Channel 2025 & 2033
- Figure 11: South America BNPL Industry in India Revenue Share (%), by Channel 2025 & 2033
- Figure 12: South America BNPL Industry in India Revenue (billion), by Enterprise 2025 & 2033
- Figure 13: South America BNPL Industry in India Revenue Share (%), by Enterprise 2025 & 2033
- Figure 14: South America BNPL Industry in India Revenue (billion), by End-user 2025 & 2033
- Figure 15: South America BNPL Industry in India Revenue Share (%), by End-user 2025 & 2033
- Figure 16: South America BNPL Industry in India Revenue (billion), by Country 2025 & 2033
- Figure 17: South America BNPL Industry in India Revenue Share (%), by Country 2025 & 2033
- Figure 18: Europe BNPL Industry in India Revenue (billion), by Channel 2025 & 2033
- Figure 19: Europe BNPL Industry in India Revenue Share (%), by Channel 2025 & 2033
- Figure 20: Europe BNPL Industry in India Revenue (billion), by Enterprise 2025 & 2033
- Figure 21: Europe BNPL Industry in India Revenue Share (%), by Enterprise 2025 & 2033
- Figure 22: Europe BNPL Industry in India Revenue (billion), by End-user 2025 & 2033
- Figure 23: Europe BNPL Industry in India Revenue Share (%), by End-user 2025 & 2033
- Figure 24: Europe BNPL Industry in India Revenue (billion), by Country 2025 & 2033
- Figure 25: Europe BNPL Industry in India Revenue Share (%), by Country 2025 & 2033
- Figure 26: Middle East & Africa BNPL Industry in India Revenue (billion), by Channel 2025 & 2033
- Figure 27: Middle East & Africa BNPL Industry in India Revenue Share (%), by Channel 2025 & 2033
- Figure 28: Middle East & Africa BNPL Industry in India Revenue (billion), by Enterprise 2025 & 2033
- Figure 29: Middle East & Africa BNPL Industry in India Revenue Share (%), by Enterprise 2025 & 2033
- Figure 30: Middle East & Africa BNPL Industry in India Revenue (billion), by End-user 2025 & 2033
- Figure 31: Middle East & Africa BNPL Industry in India Revenue Share (%), by End-user 2025 & 2033
- Figure 32: Middle East & Africa BNPL Industry in India Revenue (billion), by Country 2025 & 2033
- Figure 33: Middle East & Africa BNPL Industry in India Revenue Share (%), by Country 2025 & 2033
- Figure 34: Asia Pacific BNPL Industry in India Revenue (billion), by Channel 2025 & 2033
- Figure 35: Asia Pacific BNPL Industry in India Revenue Share (%), by Channel 2025 & 2033
- Figure 36: Asia Pacific BNPL Industry in India Revenue (billion), by Enterprise 2025 & 2033
- Figure 37: Asia Pacific BNPL Industry in India Revenue Share (%), by Enterprise 2025 & 2033
- Figure 38: Asia Pacific BNPL Industry in India Revenue (billion), by End-user 2025 & 2033
- Figure 39: Asia Pacific BNPL Industry in India Revenue Share (%), by End-user 2025 & 2033
- Figure 40: Asia Pacific BNPL Industry in India Revenue (billion), by Country 2025 & 2033
- Figure 41: Asia Pacific BNPL Industry in India Revenue Share (%), by Country 2025 & 2033
List of Tables
- Table 1: Global BNPL Industry in India Revenue billion Forecast, by Channel 2020 & 2033
- Table 2: Global BNPL Industry in India Revenue billion Forecast, by Enterprise 2020 & 2033
- Table 3: Global BNPL Industry in India Revenue billion Forecast, by End-user 2020 & 2033
- Table 4: Global BNPL Industry in India Revenue billion Forecast, by Region 2020 & 2033
- Table 5: Global BNPL Industry in India Revenue billion Forecast, by Channel 2020 & 2033
- Table 6: Global BNPL Industry in India Revenue billion Forecast, by Enterprise 2020 & 2033
- Table 7: Global BNPL Industry in India Revenue billion Forecast, by End-user 2020 & 2033
- Table 8: Global BNPL Industry in India Revenue billion Forecast, by Country 2020 & 2033
- Table 9: United States BNPL Industry in India Revenue (billion) Forecast, by Application 2020 & 2033
- Table 10: Canada BNPL Industry in India Revenue (billion) Forecast, by Application 2020 & 2033
- Table 11: Mexico BNPL Industry in India Revenue (billion) Forecast, by Application 2020 & 2033
- Table 12: Global BNPL Industry in India Revenue billion Forecast, by Channel 2020 & 2033
- Table 13: Global BNPL Industry in India Revenue billion Forecast, by Enterprise 2020 & 2033
- Table 14: Global BNPL Industry in India Revenue billion Forecast, by End-user 2020 & 2033
- Table 15: Global BNPL Industry in India Revenue billion Forecast, by Country 2020 & 2033
- Table 16: Brazil BNPL Industry in India Revenue (billion) Forecast, by Application 2020 & 2033
- Table 17: Argentina BNPL Industry in India Revenue (billion) Forecast, by Application 2020 & 2033
- Table 18: Rest of South America BNPL Industry in India Revenue (billion) Forecast, by Application 2020 & 2033
- Table 19: Global BNPL Industry in India Revenue billion Forecast, by Channel 2020 & 2033
- Table 20: Global BNPL Industry in India Revenue billion Forecast, by Enterprise 2020 & 2033
- Table 21: Global BNPL Industry in India Revenue billion Forecast, by End-user 2020 & 2033
- Table 22: Global BNPL Industry in India Revenue billion Forecast, by Country 2020 & 2033
- Table 23: United Kingdom BNPL Industry in India Revenue (billion) Forecast, by Application 2020 & 2033
- Table 24: Germany BNPL Industry in India Revenue (billion) Forecast, by Application 2020 & 2033
- Table 25: France BNPL Industry in India Revenue (billion) Forecast, by Application 2020 & 2033
- Table 26: Italy BNPL Industry in India Revenue (billion) Forecast, by Application 2020 & 2033
- Table 27: Spain BNPL Industry in India Revenue (billion) Forecast, by Application 2020 & 2033
- Table 28: Russia BNPL Industry in India Revenue (billion) Forecast, by Application 2020 & 2033
- Table 29: Benelux BNPL Industry in India Revenue (billion) Forecast, by Application 2020 & 2033
- Table 30: Nordics BNPL Industry in India Revenue (billion) Forecast, by Application 2020 & 2033
- Table 31: Rest of Europe BNPL Industry in India Revenue (billion) Forecast, by Application 2020 & 2033
- Table 32: Global BNPL Industry in India Revenue billion Forecast, by Channel 2020 & 2033
- Table 33: Global BNPL Industry in India Revenue billion Forecast, by Enterprise 2020 & 2033
- Table 34: Global BNPL Industry in India Revenue billion Forecast, by End-user 2020 & 2033
- Table 35: Global BNPL Industry in India Revenue billion Forecast, by Country 2020 & 2033
- Table 36: Turkey BNPL Industry in India Revenue (billion) Forecast, by Application 2020 & 2033
- Table 37: Israel BNPL Industry in India Revenue (billion) Forecast, by Application 2020 & 2033
- Table 38: GCC BNPL Industry in India Revenue (billion) Forecast, by Application 2020 & 2033
- Table 39: North Africa BNPL Industry in India Revenue (billion) Forecast, by Application 2020 & 2033
- Table 40: South Africa BNPL Industry in India Revenue (billion) Forecast, by Application 2020 & 2033
- Table 41: Rest of Middle East & Africa BNPL Industry in India Revenue (billion) Forecast, by Application 2020 & 2033
- Table 42: Global BNPL Industry in India Revenue billion Forecast, by Channel 2020 & 2033
- Table 43: Global BNPL Industry in India Revenue billion Forecast, by Enterprise 2020 & 2033
- Table 44: Global BNPL Industry in India Revenue billion Forecast, by End-user 2020 & 2033
- Table 45: Global BNPL Industry in India Revenue billion Forecast, by Country 2020 & 2033
- Table 46: China BNPL Industry in India Revenue (billion) Forecast, by Application 2020 & 2033
- Table 47: India BNPL Industry in India Revenue (billion) Forecast, by Application 2020 & 2033
- Table 48: Japan BNPL Industry in India Revenue (billion) Forecast, by Application 2020 & 2033
- Table 49: South Korea BNPL Industry in India Revenue (billion) Forecast, by Application 2020 & 2033
- Table 50: ASEAN BNPL Industry in India Revenue (billion) Forecast, by Application 2020 & 2033
- Table 51: Oceania BNPL Industry in India Revenue (billion) Forecast, by Application 2020 & 2033
- Table 52: Rest of Asia Pacific BNPL Industry in India Revenue (billion) Forecast, by Application 2020 & 2033
Frequently Asked Questions
1. What is the projected Compound Annual Growth Rate (CAGR) of the BNPL Industry in India?
The projected CAGR is approximately 13.4%.
2. Which companies are prominent players in the BNPL Industry in India?
Key companies in the market include Zest Money BNPL, Free charge, Paytm postpaid, epayLater, Mobikwik ZIP, Flipkart pay later, Olamoney Postpaid, Money Tap, Simpl, Lazy Pay, Flexmoney, Amazon Pay later, Capital float, Slice, Kreditbee, Postpe**List Not Exhaustive.
3. What are the main segments of the BNPL Industry in India?
The market segments include Channel, Enterprise, End-user.
4. Can you provide details about the market size?
The market size is estimated to be USD 21.95 billion as of 2022.
5. What are some drivers contributing to market growth?
Increasing e-commerce adoption; Rising middle class and disposable income; Access to credit and financial inclusion.
6. What are the notable trends driving market growth?
Surging E-commerce and Digital P2M Payments Boosting the Market.
7. Are there any restraints impacting market growth?
Increasing e-commerce adoption; Rising middle class and disposable income; Access to credit and financial inclusion.
8. Can you provide examples of recent developments in the market?
May 2023: ZestMoney plans to be profitable in 6 months. The fintech firm is said to be finalizing a new investment round from its existing shareholders, including Quona Capital, Zip, Omidyar Network India, Flourish VC, and Scarlet Digital. To ensure business continuity, ZestMoney plans to operate as a lending service provider (LSP), partnering with banks and NBFCs to write out loans rather than lending directly from its balance sheet.
9. What pricing options are available for accessing the report?
Pricing options include single-user, multi-user, and enterprise licenses priced at USD 3800, USD 4500, and USD 5800 respectively.
10. Is the market size provided in terms of value or volume?
The market size is provided in terms of value, measured in billion.
11. Are there any specific market keywords associated with the report?
Yes, the market keyword associated with the report is "BNPL Industry in India," which aids in identifying and referencing the specific market segment covered.
12. How do I determine which pricing option suits my needs best?
The pricing options vary based on user requirements and access needs. Individual users may opt for single-user licenses, while businesses requiring broader access may choose multi-user or enterprise licenses for cost-effective access to the report.
13. Are there any additional resources or data provided in the BNPL Industry in India report?
While the report offers comprehensive insights, it's advisable to review the specific contents or supplementary materials provided to ascertain if additional resources or data are available.
14. How can I stay updated on further developments or reports in the BNPL Industry in India?
To stay informed about further developments, trends, and reports in the BNPL Industry in India, consider subscribing to industry newsletters, following relevant companies and organizations, or regularly checking reputable industry news sources and publications.
Methodology
Step 1 - Identification of Relevant Samples Size from Population Database


Step 2 - Approaches for Defining Global Market Size (Value, Volume* & Price*)

Note*: In applicable scenarios
Step 3 - Data Sources
Primary Research
- Web Analytics
- Survey Reports
- Research Institute
- Latest Research Reports
- Opinion Leaders
Secondary Research
- Annual Reports
- White Paper
- Latest Press Release
- Industry Association
- Paid Database
- Investor Presentations

Step 4 - Data Triangulation
Involves using different sources of information in order to increase the validity of a study
These sources are likely to be stakeholders in a program - participants, other researchers, program staff, other community members, and so on.
Then we put all data in single framework & apply various statistical tools to find out the dynamic on the market.
During the analysis stage, feedback from the stakeholder groups would be compared to determine areas of agreement as well as areas of divergence