

Key Insights
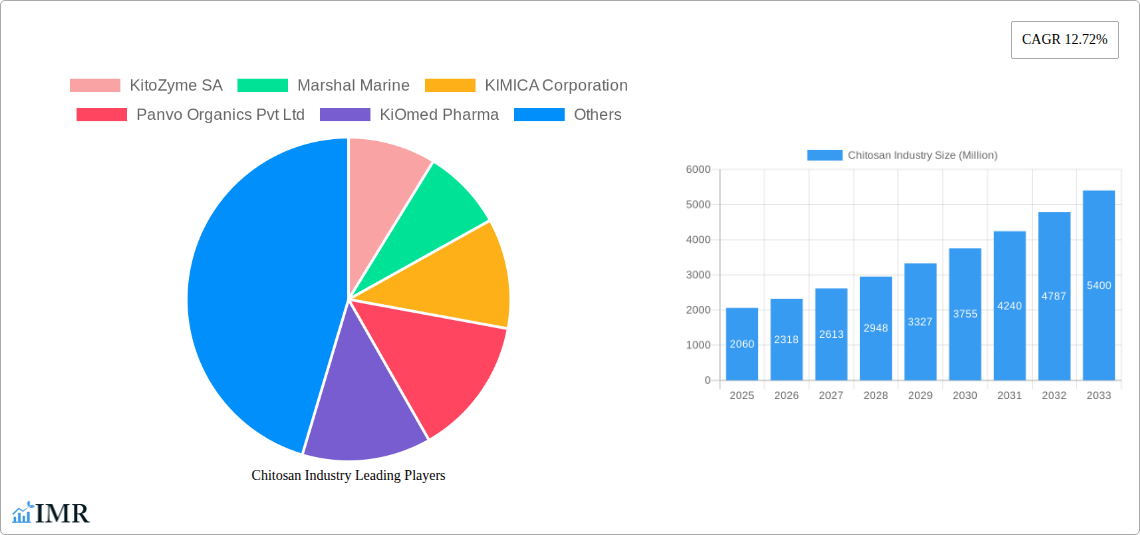
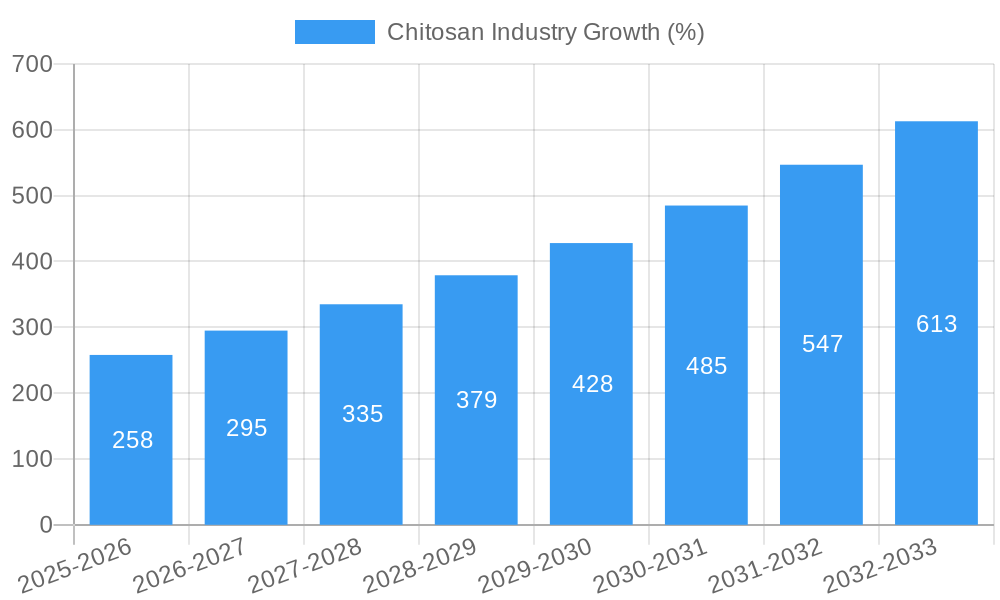
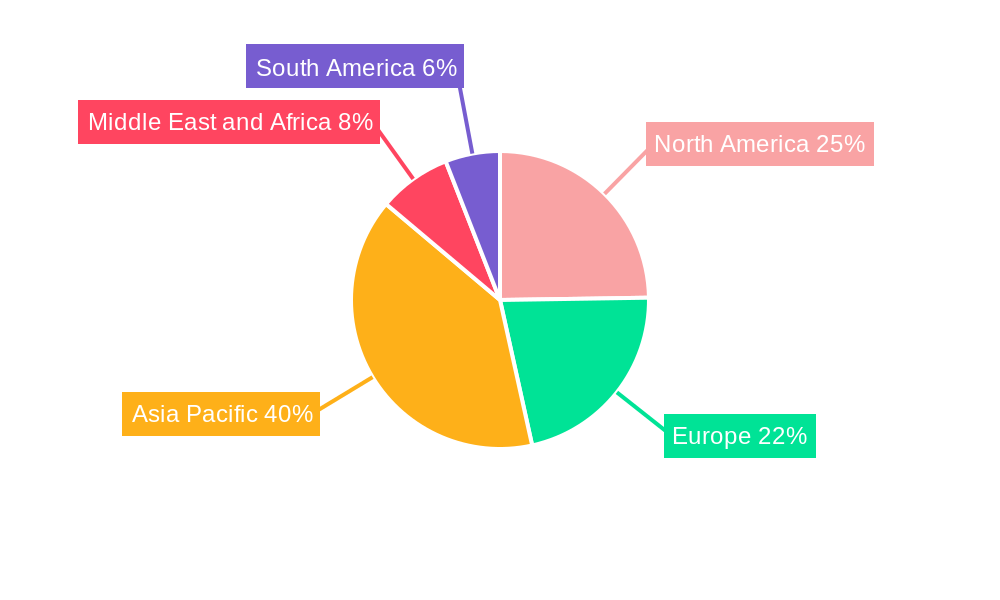
The chitosan market, valued at $2.06 billion in 2025, is experiencing robust growth, projected to expand at a Compound Annual Growth Rate (CAGR) of 12.72% from 2025 to 2033. This significant expansion is driven by the increasing demand for chitosan across diverse applications, particularly in water treatment, where its biodegradability and effectiveness in removing pollutants are highly valued. The burgeoning cosmetics and pharmaceutical industries also contribute significantly to market growth, with chitosan utilized as a film-forming agent, emulsifier, and bioactive component in various products. Furthermore, the food and beverage sector's growing interest in natural preservatives and thickening agents is fueling demand. The shrimp and prawn processing industry serves as a primary source of chitosan, though crabs and other sources are also contributing. Geographic distribution shows strong growth in Asia-Pacific, driven by expanding industrial activity and rising consumer awareness of natural ingredients. North America and Europe also hold significant market shares, driven by established industries and stringent regulatory frameworks. While potential supply chain constraints related to raw material sourcing could pose a challenge, ongoing research and development efforts aimed at optimizing extraction processes and exploring alternative sources are mitigating this risk. The market's segmentation by application and source allows for targeted growth strategies, with companies like KitoZyme SA, Marshal Marine, and KIMICA Corporation leading the innovation and supply.
The forecast period of 2025-2033 anticipates continued strong growth, fueled by advancements in chitosan technology and its increasing integration into various applications. Market expansion is expected across all regions, with Asia-Pacific likely to maintain its leading position due to the region's growing population, increasing industrialization, and rising demand for sustainable and eco-friendly solutions. However, pricing volatility related to raw material costs and competitive pressures from synthetic alternatives will need to be carefully managed for sustained growth. Future developments will likely focus on improving chitosan's functionality, broadening its applications, and enhancing its cost-effectiveness to drive further penetration in existing and emerging markets. This includes exploring new applications within biomedicine and expanding into niche markets driven by specific consumer needs.
Chitosan Industry Market Report: 2019-2033
This comprehensive report provides an in-depth analysis of the global chitosan market, encompassing market dynamics, growth trends, regional segmentation, competitive landscape, and future outlook. The study period spans 2019-2033, with 2025 as the base year and forecast period from 2025-2033. This report is crucial for businesses, investors, and researchers seeking to understand this rapidly evolving industry. The report covers both parent markets (biopolymers, specialty chemicals) and child markets (water treatment, cosmetics, pharmaceuticals) to provide a holistic view. Estimated market value in Million Units.
Chitosan Industry Market Dynamics & Structure
The global chitosan market, valued at xx Million in 2025, exhibits a moderately concentrated structure with key players holding significant market share. Technological innovation, driven by advancements in extraction methods and application development, is a primary growth driver. Stringent regulatory frameworks, particularly concerning food safety and biomedical applications, influence market dynamics. Competitive pressures arise from substitute materials, including other biopolymers and synthetic polymers. End-user demographics, especially the rising demand from the healthcare and cosmetic sectors, further shape market trends. Mergers and acquisitions (M&A) activities are moderate, with a few significant deals reported in the recent past.
- Market Concentration: Moderately concentrated, with top 5 players holding approximately xx% market share in 2025.
- Technological Innovation: Focus on sustainable extraction, improved purity, and novel applications.
- Regulatory Landscape: Stringent regulations, especially in pharmaceuticals and food sectors.
- Competitive Substitutes: Presence of alternative biopolymers and synthetic polymers.
- M&A Activity: Moderate activity, with xx major deals recorded between 2019 and 2024.
- Innovation Barriers: High R&D costs and regulatory hurdles.
Chitosan Industry Growth Trends & Insights
The chitosan market experienced robust growth during the historical period (2019-2024), with a CAGR of xx%. This growth is attributed to increasing demand across diverse applications, including water treatment, cosmetics, and pharmaceuticals. Technological advancements, such as improved extraction techniques and the development of novel chitosan derivatives, have further fueled market expansion. Shifting consumer preferences towards natural and sustainable products have positively impacted market adoption. The forecast period (2025-2033) anticipates continued growth, driven by rising health consciousness and expanding applications in emerging markets. Market penetration is expected to increase significantly in the coming years, particularly in developing economies. Technological disruptions, like the emergence of bio-based chitosan alternatives, could impact market dynamics.
Dominant Regions, Countries, or Segments in Chitosan Industry
The Asia-Pacific region dominates the global chitosan market, driven by high demand from countries like China and India. The pharmaceutical and biomedical segments show the highest growth potential due to chitosan's unique biocompatible properties and its applications in drug delivery systems and wound healing. Within applications, the water treatment segment holds a significant market share, while cosmetics and food and beverage sectors contribute substantially to market growth. Shrimp is the leading source of chitosan globally.
- Key Drivers (Asia-Pacific): Rapid economic growth, rising disposable incomes, and expanding healthcare infrastructure.
- Key Drivers (Pharmaceutical & Biomedical): Growing prevalence of chronic diseases and increasing demand for advanced drug delivery systems.
- Dominant Segments: Pharmaceutical and biomedical, Water Treatment, Shrimp as the primary source.
- Growth Potential: High growth potential in emerging markets, especially in Africa and Latin America.
Chitosan Industry Product Landscape
The chitosan market offers a diverse range of products, including chitosan powder, flakes, and solutions, each tailored to specific applications. Innovations focus on enhancing purity, improving solubility, and developing novel derivatives with enhanced functionalities. These advancements provide unique selling propositions, such as improved biocompatibility, targeted drug delivery, and enhanced water treatment capabilities. Technological advancements are primarily concentrated on optimizing production processes to reduce costs and enhance sustainability.
Key Drivers, Barriers & Challenges in Chitosan Industry
Key Drivers: Growing demand from healthcare and environmental sectors, increasing consumer preference for natural products, technological advancements leading to improved product efficacy and cost reduction.
Challenges: Fluctuations in raw material prices (shrimp shells), stringent regulatory approvals, competition from substitute materials, and potential supply chain disruptions. The impact of these challenges could lead to price volatility and potentially slower market growth if not addressed effectively. Estimated impact: xx% reduction in projected growth if supply chain issues are not mitigated.
Emerging Opportunities in Chitosan Industry
Emerging opportunities lie in expanding applications of chitosan in novel fields such as tissue engineering, agriculture (biopesticides), and advanced wound care. Untapped markets in developing economies present significant growth potential. Furthermore, evolving consumer preferences towards sustainable and eco-friendly products offer strong prospects for chitosan's adoption in various industries.
Growth Accelerators in the Chitosan Industry
Technological breakthroughs in chitosan extraction and modification methods are driving cost reduction and enhancing product performance. Strategic partnerships between chitosan producers and end-users are accelerating market penetration. Expansion strategies into emerging markets and diversification into new applications are crucial for sustaining long-term growth.
Key Players Shaping the Chitosan Industry Market
- KitoZyme SA
- Marshal Marine
- KIMICA Corporation
- Panvo Organics Pvt Ltd
- KiOmed Pharma
- Meron Biopolymers
- ChitoTech
- Qingdao Yunzhou
- Austanz Chitin Pty Ltd
- BIO21 Co Ltd
- Dainichiseika Color & Chemicals Mfg Co Ltd
- Heppe Medical Chitosan GmbH
Notable Milestones in Chitosan Industry Sector
- 2020: KitoZyme SA launched a new line of high-purity chitosan for pharmaceutical applications.
- 2022: Merger between two key players resulted in a larger market presence.
- 2023: Significant investment in R&D for sustainable chitosan extraction methods.
In-Depth Chitosan Industry Market Outlook
The chitosan market is poised for significant growth over the forecast period (2025-2033), driven by continued innovation and expanding applications. Strategic investments in R&D, coupled with strategic partnerships and market expansion initiatives, will be crucial for capturing market share. The focus on sustainable and eco-friendly production methods will further drive market growth and ensure long-term sustainability.
Chitosan Industry Segmentation
-
1. Source
- 1.1. Shrimps
- 1.2. Prawns
- 1.3. Crabs
- 1.4. Other Sources
-
2. Application
- 2.1. Water treatment
- 2.2. Cosmetics
- 2.3. Pharmaceutical and Biomedical
- 2.4. Food and Beverage
- 2.5. Other Applications
Chitosan Industry Segmentation By Geography
-
1. North America
- 1.1. United States
- 1.2. Canada
- 1.3. Mexico
-
2. Europe
- 2.1. Germany
- 2.2. United Kingdom
- 2.3. France
- 2.4. Italy
- 2.5. Spain
- 2.6. Rest of Europe
-
3. Asia Pacific
- 3.1. China
- 3.2. Japan
- 3.3. India
- 3.4. Australia
- 3.5. South Korea
- 3.6. Rest of Asia Pacific
-
4. Middle East and Africa
- 4.1. GCC
- 4.2. South Africa
- 4.3. Rest of Middle East and Africa
-
5. South America
- 5.1. Brazil
- 5.2. Argentina
- 5.3. Rest of South America
Chitosan Industry REPORT HIGHLIGHTS
| Aspects | Details |
|---|---|
| Study Period | 2019-2033 |
| Base Year | 2024 |
| Estimated Year | 2025 |
| Forecast Period | 2025-2033 |
| Historical Period | 2019-2024 |
| Growth Rate | CAGR of 12.72% from 2019-2033 |
| Segmentation |
|
Table of Contents
- 1. Introduction
- 1.1. Research Scope
- 1.2. Market Segmentation
- 1.3. Research Methodology
- 1.4. Definitions and Assumptions
- 2. Executive Summary
- 2.1. Introduction
- 3. Market Dynamics
- 3.1. Introduction
- 3.2. Market Drivers
- 3.2.1 Rising Water Treatment Activities; Growing Product Application in the Biomedical
- 3.2.2 Cosmetics
- 3.2.3 and Food and Beverage Industries; Strong Advancements in the Healthcare/Medical Industry
- 3.3. Market Restrains
- 3.3.1. Regulatory Framework
- 3.4. Market Trends
- 3.4.1 Under Application
- 3.4.2 Water Treatment is Expected to Witness a Healthy Growth Rate Over the Forecast Period
- 4. Market Factor Analysis
- 4.1. Porters Five Forces
- 4.2. Supply/Value Chain
- 4.3. PESTEL analysis
- 4.4. Market Entropy
- 4.5. Patent/Trademark Analysis
- 5. Global Chitosan Industry Analysis, Insights and Forecast, 2019-2031
- 5.1. Market Analysis, Insights and Forecast - by Source
- 5.1.1. Shrimps
- 5.1.2. Prawns
- 5.1.3. Crabs
- 5.1.4. Other Sources
- 5.2. Market Analysis, Insights and Forecast - by Application
- 5.2.1. Water treatment
- 5.2.2. Cosmetics
- 5.2.3. Pharmaceutical and Biomedical
- 5.2.4. Food and Beverage
- 5.2.5. Other Applications
- 5.3. Market Analysis, Insights and Forecast - by Region
- 5.3.1. North America
- 5.3.2. Europe
- 5.3.3. Asia Pacific
- 5.3.4. Middle East and Africa
- 5.3.5. South America
- 5.1. Market Analysis, Insights and Forecast - by Source
- 6. North America Chitosan Industry Analysis, Insights and Forecast, 2019-2031
- 6.1. Market Analysis, Insights and Forecast - by Source
- 6.1.1. Shrimps
- 6.1.2. Prawns
- 6.1.3. Crabs
- 6.1.4. Other Sources
- 6.2. Market Analysis, Insights and Forecast - by Application
- 6.2.1. Water treatment
- 6.2.2. Cosmetics
- 6.2.3. Pharmaceutical and Biomedical
- 6.2.4. Food and Beverage
- 6.2.5. Other Applications
- 6.1. Market Analysis, Insights and Forecast - by Source
- 7. Europe Chitosan Industry Analysis, Insights and Forecast, 2019-2031
- 7.1. Market Analysis, Insights and Forecast - by Source
- 7.1.1. Shrimps
- 7.1.2. Prawns
- 7.1.3. Crabs
- 7.1.4. Other Sources
- 7.2. Market Analysis, Insights and Forecast - by Application
- 7.2.1. Water treatment
- 7.2.2. Cosmetics
- 7.2.3. Pharmaceutical and Biomedical
- 7.2.4. Food and Beverage
- 7.2.5. Other Applications
- 7.1. Market Analysis, Insights and Forecast - by Source
- 8. Asia Pacific Chitosan Industry Analysis, Insights and Forecast, 2019-2031
- 8.1. Market Analysis, Insights and Forecast - by Source
- 8.1.1. Shrimps
- 8.1.2. Prawns
- 8.1.3. Crabs
- 8.1.4. Other Sources
- 8.2. Market Analysis, Insights and Forecast - by Application
- 8.2.1. Water treatment
- 8.2.2. Cosmetics
- 8.2.3. Pharmaceutical and Biomedical
- 8.2.4. Food and Beverage
- 8.2.5. Other Applications
- 8.1. Market Analysis, Insights and Forecast - by Source
- 9. Middle East and Africa Chitosan Industry Analysis, Insights and Forecast, 2019-2031
- 9.1. Market Analysis, Insights and Forecast - by Source
- 9.1.1. Shrimps
- 9.1.2. Prawns
- 9.1.3. Crabs
- 9.1.4. Other Sources
- 9.2. Market Analysis, Insights and Forecast - by Application
- 9.2.1. Water treatment
- 9.2.2. Cosmetics
- 9.2.3. Pharmaceutical and Biomedical
- 9.2.4. Food and Beverage
- 9.2.5. Other Applications
- 9.1. Market Analysis, Insights and Forecast - by Source
- 10. South America Chitosan Industry Analysis, Insights and Forecast, 2019-2031
- 10.1. Market Analysis, Insights and Forecast - by Source
- 10.1.1. Shrimps
- 10.1.2. Prawns
- 10.1.3. Crabs
- 10.1.4. Other Sources
- 10.2. Market Analysis, Insights and Forecast - by Application
- 10.2.1. Water treatment
- 10.2.2. Cosmetics
- 10.2.3. Pharmaceutical and Biomedical
- 10.2.4. Food and Beverage
- 10.2.5. Other Applications
- 10.1. Market Analysis, Insights and Forecast - by Source
- 11. North America Chitosan Industry Analysis, Insights and Forecast, 2019-2031
- 11.1. Market Analysis, Insights and Forecast - By Country/Sub-region
- 11.1.1 United States
- 11.1.2 Canada
- 11.1.3 Mexico
- 12. Europe Chitosan Industry Analysis, Insights and Forecast, 2019-2031
- 12.1. Market Analysis, Insights and Forecast - By Country/Sub-region
- 12.1.1 Germany
- 12.1.2 United Kingdom
- 12.1.3 France
- 12.1.4 Italy
- 12.1.5 Spain
- 12.1.6 Rest of Europe
- 13. Asia Pacific Chitosan Industry Analysis, Insights and Forecast, 2019-2031
- 13.1. Market Analysis, Insights and Forecast - By Country/Sub-region
- 13.1.1 China
- 13.1.2 Japan
- 13.1.3 India
- 13.1.4 Australia
- 13.1.5 South Korea
- 13.1.6 Rest of Asia Pacific
- 14. Middle East and Africa Chitosan Industry Analysis, Insights and Forecast, 2019-2031
- 14.1. Market Analysis, Insights and Forecast - By Country/Sub-region
- 14.1.1 GCC
- 14.1.2 South Africa
- 14.1.3 Rest of Middle East and Africa
- 15. South America Chitosan Industry Analysis, Insights and Forecast, 2019-2031
- 15.1. Market Analysis, Insights and Forecast - By Country/Sub-region
- 15.1.1 Brazil
- 15.1.2 Argentina
- 15.1.3 Rest of South America
- 16. Competitive Analysis
- 16.1. Global Market Share Analysis 2024
- 16.2. Company Profiles
- 16.2.1 KitoZyme SA
- 16.2.1.1. Overview
- 16.2.1.2. Products
- 16.2.1.3. SWOT Analysis
- 16.2.1.4. Recent Developments
- 16.2.1.5. Financials (Based on Availability)
- 16.2.2 Marshal Marine
- 16.2.2.1. Overview
- 16.2.2.2. Products
- 16.2.2.3. SWOT Analysis
- 16.2.2.4. Recent Developments
- 16.2.2.5. Financials (Based on Availability)
- 16.2.3 KIMICA Corporation
- 16.2.3.1. Overview
- 16.2.3.2. Products
- 16.2.3.3. SWOT Analysis
- 16.2.3.4. Recent Developments
- 16.2.3.5. Financials (Based on Availability)
- 16.2.4 Panvo Organics Pvt Ltd
- 16.2.4.1. Overview
- 16.2.4.2. Products
- 16.2.4.3. SWOT Analysis
- 16.2.4.4. Recent Developments
- 16.2.4.5. Financials (Based on Availability)
- 16.2.5 KiOmed Pharma
- 16.2.5.1. Overview
- 16.2.5.2. Products
- 16.2.5.3. SWOT Analysis
- 16.2.5.4. Recent Developments
- 16.2.5.5. Financials (Based on Availability)
- 16.2.6 Meron Biopolymers
- 16.2.6.1. Overview
- 16.2.6.2. Products
- 16.2.6.3. SWOT Analysis
- 16.2.6.4. Recent Developments
- 16.2.6.5. Financials (Based on Availability)
- 16.2.7 ChitoTech
- 16.2.7.1. Overview
- 16.2.7.2. Products
- 16.2.7.3. SWOT Analysis
- 16.2.7.4. Recent Developments
- 16.2.7.5. Financials (Based on Availability)
- 16.2.8 Qingdao Yunzhou
- 16.2.8.1. Overview
- 16.2.8.2. Products
- 16.2.8.3. SWOT Analysis
- 16.2.8.4. Recent Developments
- 16.2.8.5. Financials (Based on Availability)
- 16.2.9 Austanz Chitin Pty Ltd
- 16.2.9.1. Overview
- 16.2.9.2. Products
- 16.2.9.3. SWOT Analysis
- 16.2.9.4. Recent Developments
- 16.2.9.5. Financials (Based on Availability)
- 16.2.10 BIO21 Co Ltd
- 16.2.10.1. Overview
- 16.2.10.2. Products
- 16.2.10.3. SWOT Analysis
- 16.2.10.4. Recent Developments
- 16.2.10.5. Financials (Based on Availability)
- 16.2.11 Dainichiseika Color & Chemicals Mfg Co Ltd
- 16.2.11.1. Overview
- 16.2.11.2. Products
- 16.2.11.3. SWOT Analysis
- 16.2.11.4. Recent Developments
- 16.2.11.5. Financials (Based on Availability)
- 16.2.12 Heppe Medical Chitosan GmbH
- 16.2.12.1. Overview
- 16.2.12.2. Products
- 16.2.12.3. SWOT Analysis
- 16.2.12.4. Recent Developments
- 16.2.12.5. Financials (Based on Availability)
- 16.2.1 KitoZyme SA
List of Figures
- Figure 1: Global Chitosan Industry Revenue Breakdown (Million, %) by Region 2024 & 2032
- Figure 2: Global Chitosan Industry Volume Breakdown (K Unit, %) by Region 2024 & 2032
- Figure 3: North America Chitosan Industry Revenue (Million), by Country 2024 & 2032
- Figure 4: North America Chitosan Industry Volume (K Unit), by Country 2024 & 2032
- Figure 5: North America Chitosan Industry Revenue Share (%), by Country 2024 & 2032
- Figure 6: North America Chitosan Industry Volume Share (%), by Country 2024 & 2032
- Figure 7: Europe Chitosan Industry Revenue (Million), by Country 2024 & 2032
- Figure 8: Europe Chitosan Industry Volume (K Unit), by Country 2024 & 2032
- Figure 9: Europe Chitosan Industry Revenue Share (%), by Country 2024 & 2032
- Figure 10: Europe Chitosan Industry Volume Share (%), by Country 2024 & 2032
- Figure 11: Asia Pacific Chitosan Industry Revenue (Million), by Country 2024 & 2032
- Figure 12: Asia Pacific Chitosan Industry Volume (K Unit), by Country 2024 & 2032
- Figure 13: Asia Pacific Chitosan Industry Revenue Share (%), by Country 2024 & 2032
- Figure 14: Asia Pacific Chitosan Industry Volume Share (%), by Country 2024 & 2032
- Figure 15: Middle East and Africa Chitosan Industry Revenue (Million), by Country 2024 & 2032
- Figure 16: Middle East and Africa Chitosan Industry Volume (K Unit), by Country 2024 & 2032
- Figure 17: Middle East and Africa Chitosan Industry Revenue Share (%), by Country 2024 & 2032
- Figure 18: Middle East and Africa Chitosan Industry Volume Share (%), by Country 2024 & 2032
- Figure 19: South America Chitosan Industry Revenue (Million), by Country 2024 & 2032
- Figure 20: South America Chitosan Industry Volume (K Unit), by Country 2024 & 2032
- Figure 21: South America Chitosan Industry Revenue Share (%), by Country 2024 & 2032
- Figure 22: South America Chitosan Industry Volume Share (%), by Country 2024 & 2032
- Figure 23: North America Chitosan Industry Revenue (Million), by Source 2024 & 2032
- Figure 24: North America Chitosan Industry Volume (K Unit), by Source 2024 & 2032
- Figure 25: North America Chitosan Industry Revenue Share (%), by Source 2024 & 2032
- Figure 26: North America Chitosan Industry Volume Share (%), by Source 2024 & 2032
- Figure 27: North America Chitosan Industry Revenue (Million), by Application 2024 & 2032
- Figure 28: North America Chitosan Industry Volume (K Unit), by Application 2024 & 2032
- Figure 29: North America Chitosan Industry Revenue Share (%), by Application 2024 & 2032
- Figure 30: North America Chitosan Industry Volume Share (%), by Application 2024 & 2032
- Figure 31: North America Chitosan Industry Revenue (Million), by Country 2024 & 2032
- Figure 32: North America Chitosan Industry Volume (K Unit), by Country 2024 & 2032
- Figure 33: North America Chitosan Industry Revenue Share (%), by Country 2024 & 2032
- Figure 34: North America Chitosan Industry Volume Share (%), by Country 2024 & 2032
- Figure 35: Europe Chitosan Industry Revenue (Million), by Source 2024 & 2032
- Figure 36: Europe Chitosan Industry Volume (K Unit), by Source 2024 & 2032
- Figure 37: Europe Chitosan Industry Revenue Share (%), by Source 2024 & 2032
- Figure 38: Europe Chitosan Industry Volume Share (%), by Source 2024 & 2032
- Figure 39: Europe Chitosan Industry Revenue (Million), by Application 2024 & 2032
- Figure 40: Europe Chitosan Industry Volume (K Unit), by Application 2024 & 2032
- Figure 41: Europe Chitosan Industry Revenue Share (%), by Application 2024 & 2032
- Figure 42: Europe Chitosan Industry Volume Share (%), by Application 2024 & 2032
- Figure 43: Europe Chitosan Industry Revenue (Million), by Country 2024 & 2032
- Figure 44: Europe Chitosan Industry Volume (K Unit), by Country 2024 & 2032
- Figure 45: Europe Chitosan Industry Revenue Share (%), by Country 2024 & 2032
- Figure 46: Europe Chitosan Industry Volume Share (%), by Country 2024 & 2032
- Figure 47: Asia Pacific Chitosan Industry Revenue (Million), by Source 2024 & 2032
- Figure 48: Asia Pacific Chitosan Industry Volume (K Unit), by Source 2024 & 2032
- Figure 49: Asia Pacific Chitosan Industry Revenue Share (%), by Source 2024 & 2032
- Figure 50: Asia Pacific Chitosan Industry Volume Share (%), by Source 2024 & 2032
- Figure 51: Asia Pacific Chitosan Industry Revenue (Million), by Application 2024 & 2032
- Figure 52: Asia Pacific Chitosan Industry Volume (K Unit), by Application 2024 & 2032
- Figure 53: Asia Pacific Chitosan Industry Revenue Share (%), by Application 2024 & 2032
- Figure 54: Asia Pacific Chitosan Industry Volume Share (%), by Application 2024 & 2032
- Figure 55: Asia Pacific Chitosan Industry Revenue (Million), by Country 2024 & 2032
- Figure 56: Asia Pacific Chitosan Industry Volume (K Unit), by Country 2024 & 2032
- Figure 57: Asia Pacific Chitosan Industry Revenue Share (%), by Country 2024 & 2032
- Figure 58: Asia Pacific Chitosan Industry Volume Share (%), by Country 2024 & 2032
- Figure 59: Middle East and Africa Chitosan Industry Revenue (Million), by Source 2024 & 2032
- Figure 60: Middle East and Africa Chitosan Industry Volume (K Unit), by Source 2024 & 2032
- Figure 61: Middle East and Africa Chitosan Industry Revenue Share (%), by Source 2024 & 2032
- Figure 62: Middle East and Africa Chitosan Industry Volume Share (%), by Source 2024 & 2032
- Figure 63: Middle East and Africa Chitosan Industry Revenue (Million), by Application 2024 & 2032
- Figure 64: Middle East and Africa Chitosan Industry Volume (K Unit), by Application 2024 & 2032
- Figure 65: Middle East and Africa Chitosan Industry Revenue Share (%), by Application 2024 & 2032
- Figure 66: Middle East and Africa Chitosan Industry Volume Share (%), by Application 2024 & 2032
- Figure 67: Middle East and Africa Chitosan Industry Revenue (Million), by Country 2024 & 2032
- Figure 68: Middle East and Africa Chitosan Industry Volume (K Unit), by Country 2024 & 2032
- Figure 69: Middle East and Africa Chitosan Industry Revenue Share (%), by Country 2024 & 2032
- Figure 70: Middle East and Africa Chitosan Industry Volume Share (%), by Country 2024 & 2032
- Figure 71: South America Chitosan Industry Revenue (Million), by Source 2024 & 2032
- Figure 72: South America Chitosan Industry Volume (K Unit), by Source 2024 & 2032
- Figure 73: South America Chitosan Industry Revenue Share (%), by Source 2024 & 2032
- Figure 74: South America Chitosan Industry Volume Share (%), by Source 2024 & 2032
- Figure 75: South America Chitosan Industry Revenue (Million), by Application 2024 & 2032
- Figure 76: South America Chitosan Industry Volume (K Unit), by Application 2024 & 2032
- Figure 77: South America Chitosan Industry Revenue Share (%), by Application 2024 & 2032
- Figure 78: South America Chitosan Industry Volume Share (%), by Application 2024 & 2032
- Figure 79: South America Chitosan Industry Revenue (Million), by Country 2024 & 2032
- Figure 80: South America Chitosan Industry Volume (K Unit), by Country 2024 & 2032
- Figure 81: South America Chitosan Industry Revenue Share (%), by Country 2024 & 2032
- Figure 82: South America Chitosan Industry Volume Share (%), by Country 2024 & 2032
List of Tables
- Table 1: Global Chitosan Industry Revenue Million Forecast, by Region 2019 & 2032
- Table 2: Global Chitosan Industry Volume K Unit Forecast, by Region 2019 & 2032
- Table 3: Global Chitosan Industry Revenue Million Forecast, by Source 2019 & 2032
- Table 4: Global Chitosan Industry Volume K Unit Forecast, by Source 2019 & 2032
- Table 5: Global Chitosan Industry Revenue Million Forecast, by Application 2019 & 2032
- Table 6: Global Chitosan Industry Volume K Unit Forecast, by Application 2019 & 2032
- Table 7: Global Chitosan Industry Revenue Million Forecast, by Region 2019 & 2032
- Table 8: Global Chitosan Industry Volume K Unit Forecast, by Region 2019 & 2032
- Table 9: Global Chitosan Industry Revenue Million Forecast, by Country 2019 & 2032
- Table 10: Global Chitosan Industry Volume K Unit Forecast, by Country 2019 & 2032
- Table 11: United States Chitosan Industry Revenue (Million) Forecast, by Application 2019 & 2032
- Table 12: United States Chitosan Industry Volume (K Unit) Forecast, by Application 2019 & 2032
- Table 13: Canada Chitosan Industry Revenue (Million) Forecast, by Application 2019 & 2032
- Table 14: Canada Chitosan Industry Volume (K Unit) Forecast, by Application 2019 & 2032
- Table 15: Mexico Chitosan Industry Revenue (Million) Forecast, by Application 2019 & 2032
- Table 16: Mexico Chitosan Industry Volume (K Unit) Forecast, by Application 2019 & 2032
- Table 17: Global Chitosan Industry Revenue Million Forecast, by Country 2019 & 2032
- Table 18: Global Chitosan Industry Volume K Unit Forecast, by Country 2019 & 2032
- Table 19: Germany Chitosan Industry Revenue (Million) Forecast, by Application 2019 & 2032
- Table 20: Germany Chitosan Industry Volume (K Unit) Forecast, by Application 2019 & 2032
- Table 21: United Kingdom Chitosan Industry Revenue (Million) Forecast, by Application 2019 & 2032
- Table 22: United Kingdom Chitosan Industry Volume (K Unit) Forecast, by Application 2019 & 2032
- Table 23: France Chitosan Industry Revenue (Million) Forecast, by Application 2019 & 2032
- Table 24: France Chitosan Industry Volume (K Unit) Forecast, by Application 2019 & 2032
- Table 25: Italy Chitosan Industry Revenue (Million) Forecast, by Application 2019 & 2032
- Table 26: Italy Chitosan Industry Volume (K Unit) Forecast, by Application 2019 & 2032
- Table 27: Spain Chitosan Industry Revenue (Million) Forecast, by Application 2019 & 2032
- Table 28: Spain Chitosan Industry Volume (K Unit) Forecast, by Application 2019 & 2032
- Table 29: Rest of Europe Chitosan Industry Revenue (Million) Forecast, by Application 2019 & 2032
- Table 30: Rest of Europe Chitosan Industry Volume (K Unit) Forecast, by Application 2019 & 2032
- Table 31: Global Chitosan Industry Revenue Million Forecast, by Country 2019 & 2032
- Table 32: Global Chitosan Industry Volume K Unit Forecast, by Country 2019 & 2032
- Table 33: China Chitosan Industry Revenue (Million) Forecast, by Application 2019 & 2032
- Table 34: China Chitosan Industry Volume (K Unit) Forecast, by Application 2019 & 2032
- Table 35: Japan Chitosan Industry Revenue (Million) Forecast, by Application 2019 & 2032
- Table 36: Japan Chitosan Industry Volume (K Unit) Forecast, by Application 2019 & 2032
- Table 37: India Chitosan Industry Revenue (Million) Forecast, by Application 2019 & 2032
- Table 38: India Chitosan Industry Volume (K Unit) Forecast, by Application 2019 & 2032
- Table 39: Australia Chitosan Industry Revenue (Million) Forecast, by Application 2019 & 2032
- Table 40: Australia Chitosan Industry Volume (K Unit) Forecast, by Application 2019 & 2032
- Table 41: South Korea Chitosan Industry Revenue (Million) Forecast, by Application 2019 & 2032
- Table 42: South Korea Chitosan Industry Volume (K Unit) Forecast, by Application 2019 & 2032
- Table 43: Rest of Asia Pacific Chitosan Industry Revenue (Million) Forecast, by Application 2019 & 2032
- Table 44: Rest of Asia Pacific Chitosan Industry Volume (K Unit) Forecast, by Application 2019 & 2032
- Table 45: Global Chitosan Industry Revenue Million Forecast, by Country 2019 & 2032
- Table 46: Global Chitosan Industry Volume K Unit Forecast, by Country 2019 & 2032
- Table 47: GCC Chitosan Industry Revenue (Million) Forecast, by Application 2019 & 2032
- Table 48: GCC Chitosan Industry Volume (K Unit) Forecast, by Application 2019 & 2032
- Table 49: South Africa Chitosan Industry Revenue (Million) Forecast, by Application 2019 & 2032
- Table 50: South Africa Chitosan Industry Volume (K Unit) Forecast, by Application 2019 & 2032
- Table 51: Rest of Middle East and Africa Chitosan Industry Revenue (Million) Forecast, by Application 2019 & 2032
- Table 52: Rest of Middle East and Africa Chitosan Industry Volume (K Unit) Forecast, by Application 2019 & 2032
- Table 53: Global Chitosan Industry Revenue Million Forecast, by Country 2019 & 2032
- Table 54: Global Chitosan Industry Volume K Unit Forecast, by Country 2019 & 2032
- Table 55: Brazil Chitosan Industry Revenue (Million) Forecast, by Application 2019 & 2032
- Table 56: Brazil Chitosan Industry Volume (K Unit) Forecast, by Application 2019 & 2032
- Table 57: Argentina Chitosan Industry Revenue (Million) Forecast, by Application 2019 & 2032
- Table 58: Argentina Chitosan Industry Volume (K Unit) Forecast, by Application 2019 & 2032
- Table 59: Rest of South America Chitosan Industry Revenue (Million) Forecast, by Application 2019 & 2032
- Table 60: Rest of South America Chitosan Industry Volume (K Unit) Forecast, by Application 2019 & 2032
- Table 61: Global Chitosan Industry Revenue Million Forecast, by Source 2019 & 2032
- Table 62: Global Chitosan Industry Volume K Unit Forecast, by Source 2019 & 2032
- Table 63: Global Chitosan Industry Revenue Million Forecast, by Application 2019 & 2032
- Table 64: Global Chitosan Industry Volume K Unit Forecast, by Application 2019 & 2032
- Table 65: Global Chitosan Industry Revenue Million Forecast, by Country 2019 & 2032
- Table 66: Global Chitosan Industry Volume K Unit Forecast, by Country 2019 & 2032
- Table 67: United States Chitosan Industry Revenue (Million) Forecast, by Application 2019 & 2032
- Table 68: United States Chitosan Industry Volume (K Unit) Forecast, by Application 2019 & 2032
- Table 69: Canada Chitosan Industry Revenue (Million) Forecast, by Application 2019 & 2032
- Table 70: Canada Chitosan Industry Volume (K Unit) Forecast, by Application 2019 & 2032
- Table 71: Mexico Chitosan Industry Revenue (Million) Forecast, by Application 2019 & 2032
- Table 72: Mexico Chitosan Industry Volume (K Unit) Forecast, by Application 2019 & 2032
- Table 73: Global Chitosan Industry Revenue Million Forecast, by Source 2019 & 2032
- Table 74: Global Chitosan Industry Volume K Unit Forecast, by Source 2019 & 2032
- Table 75: Global Chitosan Industry Revenue Million Forecast, by Application 2019 & 2032
- Table 76: Global Chitosan Industry Volume K Unit Forecast, by Application 2019 & 2032
- Table 77: Global Chitosan Industry Revenue Million Forecast, by Country 2019 & 2032
- Table 78: Global Chitosan Industry Volume K Unit Forecast, by Country 2019 & 2032
- Table 79: Germany Chitosan Industry Revenue (Million) Forecast, by Application 2019 & 2032
- Table 80: Germany Chitosan Industry Volume (K Unit) Forecast, by Application 2019 & 2032
- Table 81: United Kingdom Chitosan Industry Revenue (Million) Forecast, by Application 2019 & 2032
- Table 82: United Kingdom Chitosan Industry Volume (K Unit) Forecast, by Application 2019 & 2032
- Table 83: France Chitosan Industry Revenue (Million) Forecast, by Application 2019 & 2032
- Table 84: France Chitosan Industry Volume (K Unit) Forecast, by Application 2019 & 2032
- Table 85: Italy Chitosan Industry Revenue (Million) Forecast, by Application 2019 & 2032
- Table 86: Italy Chitosan Industry Volume (K Unit) Forecast, by Application 2019 & 2032
- Table 87: Spain Chitosan Industry Revenue (Million) Forecast, by Application 2019 & 2032
- Table 88: Spain Chitosan Industry Volume (K Unit) Forecast, by Application 2019 & 2032
- Table 89: Rest of Europe Chitosan Industry Revenue (Million) Forecast, by Application 2019 & 2032
- Table 90: Rest of Europe Chitosan Industry Volume (K Unit) Forecast, by Application 2019 & 2032
- Table 91: Global Chitosan Industry Revenue Million Forecast, by Source 2019 & 2032
- Table 92: Global Chitosan Industry Volume K Unit Forecast, by Source 2019 & 2032
- Table 93: Global Chitosan Industry Revenue Million Forecast, by Application 2019 & 2032
- Table 94: Global Chitosan Industry Volume K Unit Forecast, by Application 2019 & 2032
- Table 95: Global Chitosan Industry Revenue Million Forecast, by Country 2019 & 2032
- Table 96: Global Chitosan Industry Volume K Unit Forecast, by Country 2019 & 2032
- Table 97: China Chitosan Industry Revenue (Million) Forecast, by Application 2019 & 2032
- Table 98: China Chitosan Industry Volume (K Unit) Forecast, by Application 2019 & 2032
- Table 99: Japan Chitosan Industry Revenue (Million) Forecast, by Application 2019 & 2032
- Table 100: Japan Chitosan Industry Volume (K Unit) Forecast, by Application 2019 & 2032
- Table 101: India Chitosan Industry Revenue (Million) Forecast, by Application 2019 & 2032
- Table 102: India Chitosan Industry Volume (K Unit) Forecast, by Application 2019 & 2032
- Table 103: Australia Chitosan Industry Revenue (Million) Forecast, by Application 2019 & 2032
- Table 104: Australia Chitosan Industry Volume (K Unit) Forecast, by Application 2019 & 2032
- Table 105: South Korea Chitosan Industry Revenue (Million) Forecast, by Application 2019 & 2032
- Table 106: South Korea Chitosan Industry Volume (K Unit) Forecast, by Application 2019 & 2032
- Table 107: Rest of Asia Pacific Chitosan Industry Revenue (Million) Forecast, by Application 2019 & 2032
- Table 108: Rest of Asia Pacific Chitosan Industry Volume (K Unit) Forecast, by Application 2019 & 2032
- Table 109: Global Chitosan Industry Revenue Million Forecast, by Source 2019 & 2032
- Table 110: Global Chitosan Industry Volume K Unit Forecast, by Source 2019 & 2032
- Table 111: Global Chitosan Industry Revenue Million Forecast, by Application 2019 & 2032
- Table 112: Global Chitosan Industry Volume K Unit Forecast, by Application 2019 & 2032
- Table 113: Global Chitosan Industry Revenue Million Forecast, by Country 2019 & 2032
- Table 114: Global Chitosan Industry Volume K Unit Forecast, by Country 2019 & 2032
- Table 115: GCC Chitosan Industry Revenue (Million) Forecast, by Application 2019 & 2032
- Table 116: GCC Chitosan Industry Volume (K Unit) Forecast, by Application 2019 & 2032
- Table 117: South Africa Chitosan Industry Revenue (Million) Forecast, by Application 2019 & 2032
- Table 118: South Africa Chitosan Industry Volume (K Unit) Forecast, by Application 2019 & 2032
- Table 119: Rest of Middle East and Africa Chitosan Industry Revenue (Million) Forecast, by Application 2019 & 2032
- Table 120: Rest of Middle East and Africa Chitosan Industry Volume (K Unit) Forecast, by Application 2019 & 2032
- Table 121: Global Chitosan Industry Revenue Million Forecast, by Source 2019 & 2032
- Table 122: Global Chitosan Industry Volume K Unit Forecast, by Source 2019 & 2032
- Table 123: Global Chitosan Industry Revenue Million Forecast, by Application 2019 & 2032
- Table 124: Global Chitosan Industry Volume K Unit Forecast, by Application 2019 & 2032
- Table 125: Global Chitosan Industry Revenue Million Forecast, by Country 2019 & 2032
- Table 126: Global Chitosan Industry Volume K Unit Forecast, by Country 2019 & 2032
- Table 127: Brazil Chitosan Industry Revenue (Million) Forecast, by Application 2019 & 2032
- Table 128: Brazil Chitosan Industry Volume (K Unit) Forecast, by Application 2019 & 2032
- Table 129: Argentina Chitosan Industry Revenue (Million) Forecast, by Application 2019 & 2032
- Table 130: Argentina Chitosan Industry Volume (K Unit) Forecast, by Application 2019 & 2032
- Table 131: Rest of South America Chitosan Industry Revenue (Million) Forecast, by Application 2019 & 2032
- Table 132: Rest of South America Chitosan Industry Volume (K Unit) Forecast, by Application 2019 & 2032
Frequently Asked Questions
1. What is the projected Compound Annual Growth Rate (CAGR) of the Chitosan Industry?
The projected CAGR is approximately 12.72%.
2. Which companies are prominent players in the Chitosan Industry?
Key companies in the market include KitoZyme SA, Marshal Marine, KIMICA Corporation, Panvo Organics Pvt Ltd, KiOmed Pharma, Meron Biopolymers, ChitoTech, Qingdao Yunzhou, Austanz Chitin Pty Ltd, BIO21 Co Ltd, Dainichiseika Color & Chemicals Mfg Co Ltd, Heppe Medical Chitosan GmbH.
3. What are the main segments of the Chitosan Industry?
The market segments include Source, Application.
4. Can you provide details about the market size?
The market size is estimated to be USD 2.06 Million as of 2022.
5. What are some drivers contributing to market growth?
Rising Water Treatment Activities; Growing Product Application in the Biomedical. Cosmetics. and Food and Beverage Industries; Strong Advancements in the Healthcare/Medical Industry.
6. What are the notable trends driving market growth?
Under Application. Water Treatment is Expected to Witness a Healthy Growth Rate Over the Forecast Period.
7. Are there any restraints impacting market growth?
Regulatory Framework.
8. Can you provide examples of recent developments in the market?
N/A
9. What pricing options are available for accessing the report?
Pricing options include single-user, multi-user, and enterprise licenses priced at USD 4750, USD 5250, and USD 8750 respectively.
10. Is the market size provided in terms of value or volume?
The market size is provided in terms of value, measured in Million and volume, measured in K Unit.
11. Are there any specific market keywords associated with the report?
Yes, the market keyword associated with the report is "Chitosan Industry," which aids in identifying and referencing the specific market segment covered.
12. How do I determine which pricing option suits my needs best?
The pricing options vary based on user requirements and access needs. Individual users may opt for single-user licenses, while businesses requiring broader access may choose multi-user or enterprise licenses for cost-effective access to the report.
13. Are there any additional resources or data provided in the Chitosan Industry report?
While the report offers comprehensive insights, it's advisable to review the specific contents or supplementary materials provided to ascertain if additional resources or data are available.
14. How can I stay updated on further developments or reports in the Chitosan Industry?
To stay informed about further developments, trends, and reports in the Chitosan Industry, consider subscribing to industry newsletters, following relevant companies and organizations, or regularly checking reputable industry news sources and publications.
Methodology
Step 1 - Identification of Relevant Samples Size from Population Database


Step 2 - Approaches for Defining Global Market Size (Value, Volume* & Price*)

Note*: In applicable scenarios
Step 3 - Data Sources
Primary Research
- Web Analytics
- Survey Reports
- Research Institute
- Latest Research Reports
- Opinion Leaders
Secondary Research
- Annual Reports
- White Paper
- Latest Press Release
- Industry Association
- Paid Database
- Investor Presentations

Step 4 - Data Triangulation
Involves using different sources of information in order to increase the validity of a study
These sources are likely to be stakeholders in a program - participants, other researchers, program staff, other community members, and so on.
Then we put all data in single framework & apply various statistical tools to find out the dynamic on the market.
During the analysis stage, feedback from the stakeholder groups would be compared to determine areas of agreement as well as areas of divergence
