

Key Insights
The global e-brokerage market is experiencing robust growth, driven by the increasing adoption of online trading platforms and a rising number of retail investors, particularly among millennials and Gen Z. The market's Compound Annual Growth Rate (CAGR) exceeding 6.50% from 2019-2033 indicates a consistently expanding market, projected to reach substantial value within the forecast period. This growth is fueled by several key factors: the convenience and accessibility of online trading, the proliferation of mobile trading apps, the reduced cost of trading compared to traditional brokerage firms, and the increasing popularity of investment products like ETFs and fractional shares. Furthermore, technological advancements, including artificial intelligence (AI)-powered trading tools and sophisticated analytics, are enhancing the user experience and attracting new investors. However, challenges such as regulatory scrutiny, cybersecurity threats, and the potential for market volatility remain significant considerations. The market is segmented by various factors including service offerings (e.g., full-service vs. discount brokerages), target customer demographics (e.g., retail vs. institutional investors), and geographic regions. Leading players like Interactive Brokers, Charles Schwab, Fidelity Investments, and TD Ameritrade are constantly innovating and expanding their offerings to maintain a competitive edge. Competitive pricing strategies and technological improvements are key differentiators in this highly competitive landscape.
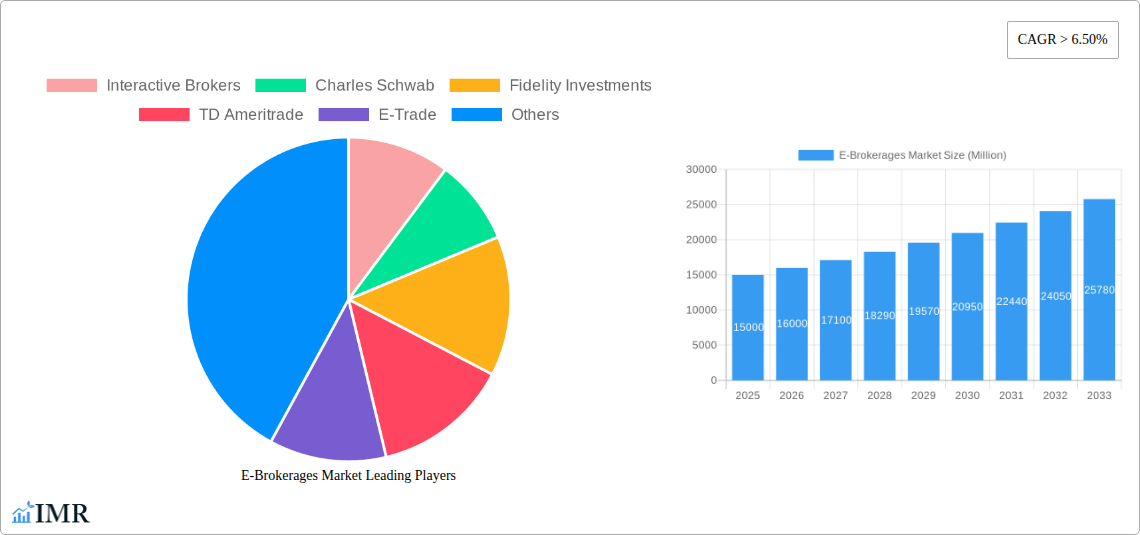
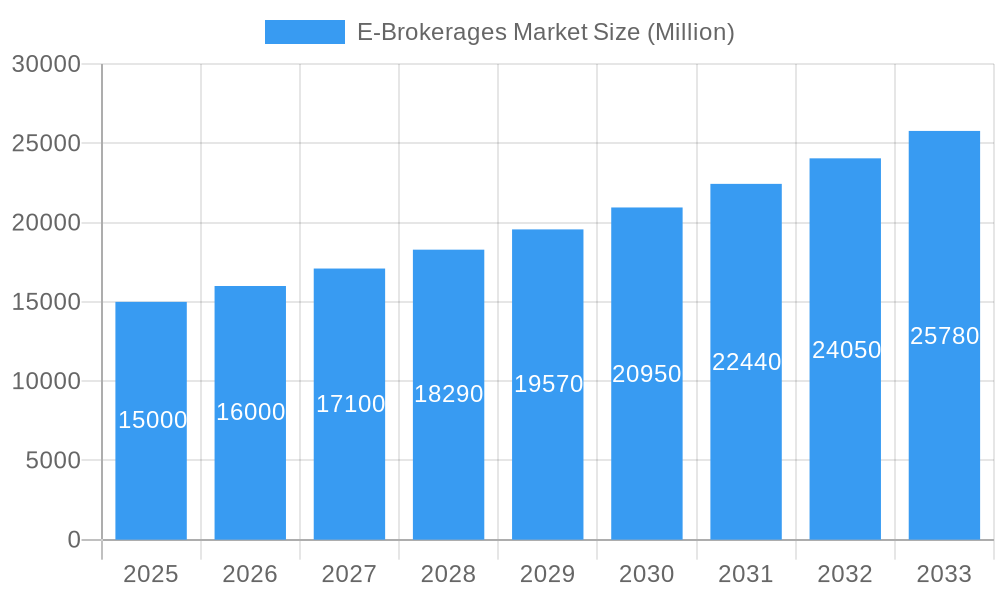
E-Brokerages Market Market Size (In Billion)
The competitive landscape is marked by a blend of established players and emerging fintech companies. Established firms like Fidelity and Schwab leverage brand recognition and extensive customer bases, while newer entrants often focus on niche services, innovative technology, or targeting specific demographic segments. Geographical expansion continues to be a significant strategy, with companies looking to tap into emerging markets with high growth potential. Despite the positive growth trajectory, the market faces potential headwinds, including increased regulatory compliance costs, the risk of cybersecurity breaches, and potential economic downturns that may impact investor confidence and trading activity. However, the overall outlook remains positive, with the e-brokerage market poised for continued expansion and diversification in the coming years. The increasing financial literacy and the growing accessibility to digital platforms worldwide are expected to further accelerate the market's growth.
E-Brokerages Market Company Market Share
E-Brokerages Market: A Comprehensive Market Report (2019-2033)
This in-depth report provides a comprehensive analysis of the global E-Brokerages market, encompassing market dynamics, growth trends, regional landscapes, competitive analysis, and future outlook. The study period covers 2019-2033, with 2025 as the base and estimated year. The report delves into the parent market of online financial services and the child market of retail brokerage services, offering granular insights for industry professionals, investors, and strategists. Market size is presented in millions of units.
E-Brokerages Market Dynamics & Structure
The e-brokerage market is characterized by a dynamic interplay of factors shaping its structure and growth trajectory. Market concentration is moderate, with several key players dominating significant market share, yet smaller, specialized firms also carving out niches. Technological innovation is a critical driver, with advancements in trading platforms, mobile accessibility, and AI-powered tools constantly reshaping the competitive landscape. Regulatory frameworks, varying across jurisdictions, significantly impact operational costs and compliance requirements. Competitive substitutes, such as traditional brick-and-mortar brokerages and peer-to-peer lending platforms, exert pressure on market share. End-user demographics are expanding, with younger, tech-savvy investors increasingly driving market growth. Mergers and acquisitions (M&A) activity reflects consolidation and strategic expansion efforts within the sector.
- Market Concentration: Moderately concentrated, with top 5 players holding approximately xx% market share in 2025 (estimated).
- Technological Innovation: Key drivers include algorithmic trading, mobile trading apps, and AI-powered investment advice. Barriers include high development costs and cybersecurity concerns.
- Regulatory Framework: Varying regulations across regions impact compliance costs and market access.
- Competitive Substitutes: Traditional brokerage firms and peer-to-peer lending platforms offer alternatives.
- End-User Demographics: Growth is driven by younger, digitally native investors, alongside increasing participation from older demographics.
- M&A Trends: Consolidation is evident, with xx M&A deals recorded between 2019 and 2024, indicating strategic expansion and competitive consolidation.
E-Brokerages Market Growth Trends & Insights
The e-brokerage market exhibits robust growth, driven by several key factors. Market size has expanded significantly from xx million in 2019 to an estimated xx million in 2025, showcasing a Compound Annual Growth Rate (CAGR) of xx% during the historical period. This growth is fueled by increasing internet and smartphone penetration, along with rising financial literacy and a growing preference for convenient, cost-effective investment solutions. Technological disruptions, such as the rise of robo-advisors and algorithmic trading, are accelerating market adoption. Consumer behavior shifts towards self-directed investing and diversified portfolios further contribute to market expansion. Market penetration continues to increase, reaching an estimated xx% in 2025, with significant potential for further growth.
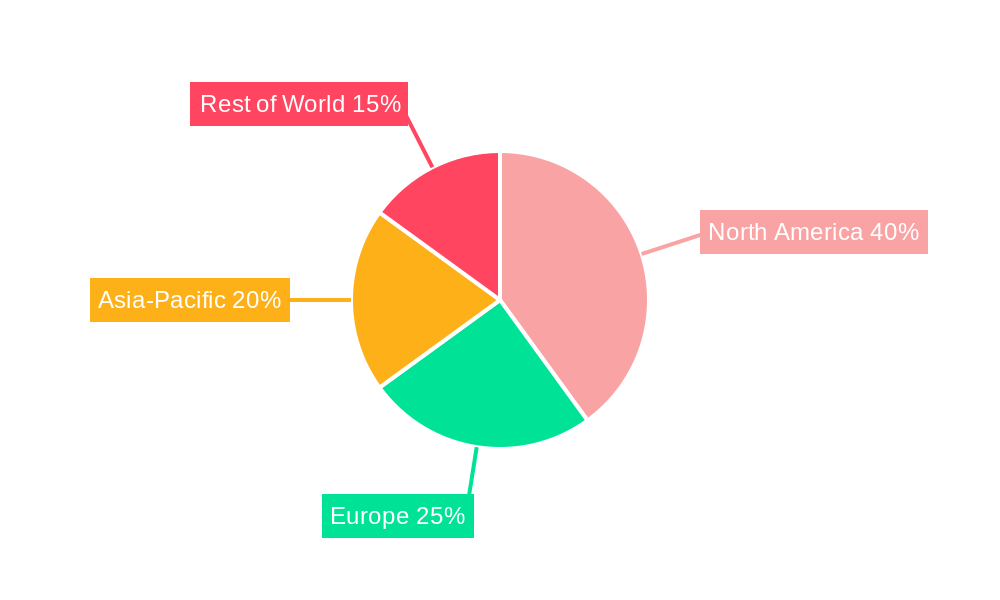
Dominant Regions, Countries, or Segments in E-Brokerages Market
North America currently dominates the e-brokerage market, driven by factors including robust financial markets, high internet penetration, and a strong culture of individual investment. However, Asia-Pacific is projected to experience the fastest growth in the forecast period.
- North America: Strong regulatory framework, high adoption rates, and established players contribute to market leadership.
- Asia-Pacific: Rapid economic growth, increasing smartphone penetration, and a burgeoning middle class fuel growth.
- Europe: Maturing market with increasing regulatory scrutiny and technological adoption.
Market dominance is attributed to factors such as robust regulatory frameworks, high financial literacy rates, and early adoption of technology. Growth potential is further analyzed considering economic growth prospects and evolving regulatory landscape in each region.
E-Brokerages Market Product Landscape
The e-brokerage product landscape is marked by a wide range of offerings, from basic online trading platforms to sophisticated robo-advisors providing automated investment management. Key innovations include mobile-first trading platforms, advanced charting tools, AI-driven investment recommendations, and fractional share trading. These advancements enhance the user experience, cater to diverse investment styles, and boost accessibility. Unique selling propositions (USPs) range from low commission fees and user-friendly interfaces to specialized features and educational resources.
Key Drivers, Barriers & Challenges in E-Brokerages Market
Key Drivers:
- Increasing smartphone penetration and internet access.
- Growing preference for self-directed investing.
- Technological advancements such as AI-powered trading tools.
- Favorable regulatory environments in certain regions.
Challenges:
- Cybersecurity risks and data breaches.
- Regulatory compliance and changes in financial regulations.
- Intense competition among established and emerging players.
- Potential for market volatility impacting investor confidence. The impact of these challenges is estimated to reduce annual market growth by approximately xx% in 2025 (estimated).
Emerging Opportunities in E-Brokerages Market
Emerging opportunities lie in expanding into untapped markets, particularly in developing economies with growing internet access and investment potential. Innovation in areas such as decentralized finance (DeFi) and blockchain technology offers new avenues for growth. The increasing demand for personalized investment advice through hybrid models combining human and AI-driven services creates opportunities for differentiated offerings. Moreover, catering to the needs of specific investor segments with customized products and services presents significant potential.
Growth Accelerators in the E-Brokerages Market Industry
Long-term growth is fueled by technological advancements, strategic partnerships, and global market expansion. The integration of AI and machine learning into trading platforms enhances efficiency and decision-making, while strategic partnerships with financial institutions and fintech firms expand market reach and service offerings. Global expansion into emerging markets and the diversification of product offerings to cater to diverse investor needs are further catalysts driving sustained growth.
Key Players Shaping the E-Brokerages Market Market
- Interactive Brokers
- Charles Schwab
- Fidelity Investments
- TD Ameritrade
- E-Trade
- TastyWorks
- Etoro
- X-Trade Brokers
- IC Markets
- Eoption
- First Prudential Markets
Notable Milestones in E-Brokerages Market Sector
- May 2022: Interactive Brokers partnered with TradingView, enhancing client trading experience.
- May 2022: Fidelity International partnered with Conquest, expanding its financial planning software reach.
- August 2022: eToro acquired Gatsby for USD 50 million, strengthening its market position.
In-Depth E-Brokerages Market Market Outlook
The e-brokerage market is poised for continued expansion, driven by technological innovation, strategic partnerships, and the increasing adoption of online investing platforms across various demographics and geographies. Future market potential is significant, with opportunities for growth in emerging markets and through the development of innovative products and services catering to evolving investor needs. Strategic partnerships with fintech firms and the expansion of financial technology will play a crucial role in shaping the future of the e-brokerage landscape.
E-Brokerages Market Segmentation
-
1. Client
- 1.1. Retailers
- 1.2. Institutional
-
2. Services Provided
- 2.1. Full Time Brokers
- 2.2. Discounted Brokers
-
3. Ownership
- 3.1. Privately Held
- 3.2. Publicly Held
E-Brokerages Market Segmentation By Geography
- 1. North America
- 2. Europe
- 3. Asia Pacific
- 4. South America
- 5. Middle East and Africa
E-Brokerages Market Regional Market Share
Geographic Coverage of E-Brokerages Market
E-Brokerages Market REPORT HIGHLIGHTS
| Aspects | Details |
|---|---|
| Study Period | 2020-2034 |
| Base Year | 2025 |
| Estimated Year | 2026 |
| Forecast Period | 2026-2034 |
| Historical Period | 2020-2025 |
| Growth Rate | CAGR of > 6.50% from 2020-2034 |
| Segmentation |
|
Table of Contents
- 1. Introduction
- 1.1. Research Scope
- 1.2. Market Segmentation
- 1.3. Research Objective
- 1.4. Definitions and Assumptions
- 2. Executive Summary
- 2.1. Market Snapshot
- 3. Market Dynamics
- 3.1. Market Drivers
- 3.2. Market Restrains
- 3.3. Market Trends
- 3.4. Market Opportunities
- 4. Market Factor Analysis
- 4.1. Porters Five Forces
- 4.1.1. Bargaining Power of Suppliers
- 4.1.2. Bargaining Power of Buyers
- 4.1.3. Threat of New Entrants
- 4.1.4. Threat of Substitutes
- 4.1.5. Competitive Rivalry
- 4.2. PESTEL analysis
- 4.3. BCG Analysis
- 4.3.1. Stars (High Growth, High Market Share)
- 4.3.2. Cash Cows (Low Growth, High Market Share)
- 4.3.3. Question Mark (High Growth, Low Market Share)
- 4.3.4. Dogs (Low Growth, Low Market Share)
- 4.4. Ansoff Matrix Analysis
- 4.5. Supply Chain Analysis
- 4.6. Regulatory Landscape
- 4.7. Current Market Potential and Opportunity Assessment (TAM–SAM–SOM Framework)
- 4.8. IMR Analyst Note
- 4.1. Porters Five Forces
- 5. Market Analysis, Insights and Forecast 2021-2033
- 5.1. Market Analysis, Insights and Forecast - by Client
- 5.1.1. Retailers
- 5.1.2. Institutional
- 5.2. Market Analysis, Insights and Forecast - by Services Provided
- 5.2.1. Full Time Brokers
- 5.2.2. Discounted Brokers
- 5.3. Market Analysis, Insights and Forecast - by Ownership
- 5.3.1. Privately Held
- 5.3.2. Publicly Held
- 5.4. Market Analysis, Insights and Forecast - by Region
- 5.4.1. North America
- 5.4.2. Europe
- 5.4.3. Asia Pacific
- 5.4.4. South America
- 5.4.5. Middle East and Africa
- 5.1. Market Analysis, Insights and Forecast - by Client
- 6. Global E-Brokerages Market Analysis, Insights and Forecast, 2021-2033
- 6.1. Market Analysis, Insights and Forecast - by Client
- 6.1.1. Retailers
- 6.1.2. Institutional
- 6.2. Market Analysis, Insights and Forecast - by Services Provided
- 6.2.1. Full Time Brokers
- 6.2.2. Discounted Brokers
- 6.3. Market Analysis, Insights and Forecast - by Ownership
- 6.3.1. Privately Held
- 6.3.2. Publicly Held
- 6.1. Market Analysis, Insights and Forecast - by Client
- 7. North America E-Brokerages Market Analysis, Insights and Forecast, 2020-2032
- 7.1. Market Analysis, Insights and Forecast - by Client
- 7.1.1. Retailers
- 7.1.2. Institutional
- 7.2. Market Analysis, Insights and Forecast - by Services Provided
- 7.2.1. Full Time Brokers
- 7.2.2. Discounted Brokers
- 7.3. Market Analysis, Insights and Forecast - by Ownership
- 7.3.1. Privately Held
- 7.3.2. Publicly Held
- 7.1. Market Analysis, Insights and Forecast - by Client
- 8. Europe E-Brokerages Market Analysis, Insights and Forecast, 2020-2032
- 8.1. Market Analysis, Insights and Forecast - by Client
- 8.1.1. Retailers
- 8.1.2. Institutional
- 8.2. Market Analysis, Insights and Forecast - by Services Provided
- 8.2.1. Full Time Brokers
- 8.2.2. Discounted Brokers
- 8.3. Market Analysis, Insights and Forecast - by Ownership
- 8.3.1. Privately Held
- 8.3.2. Publicly Held
- 8.1. Market Analysis, Insights and Forecast - by Client
- 9. Asia Pacific E-Brokerages Market Analysis, Insights and Forecast, 2020-2032
- 9.1. Market Analysis, Insights and Forecast - by Client
- 9.1.1. Retailers
- 9.1.2. Institutional
- 9.2. Market Analysis, Insights and Forecast - by Services Provided
- 9.2.1. Full Time Brokers
- 9.2.2. Discounted Brokers
- 9.3. Market Analysis, Insights and Forecast - by Ownership
- 9.3.1. Privately Held
- 9.3.2. Publicly Held
- 9.1. Market Analysis, Insights and Forecast - by Client
- 10. South America E-Brokerages Market Analysis, Insights and Forecast, 2020-2032
- 10.1. Market Analysis, Insights and Forecast - by Client
- 10.1.1. Retailers
- 10.1.2. Institutional
- 10.2. Market Analysis, Insights and Forecast - by Services Provided
- 10.2.1. Full Time Brokers
- 10.2.2. Discounted Brokers
- 10.3. Market Analysis, Insights and Forecast - by Ownership
- 10.3.1. Privately Held
- 10.3.2. Publicly Held
- 10.1. Market Analysis, Insights and Forecast - by Client
- 11. Middle East and Africa E-Brokerages Market Analysis, Insights and Forecast, 2020-2032
- 11.1. Market Analysis, Insights and Forecast - by Client
- 11.1.1. Retailers
- 11.1.2. Institutional
- 11.2. Market Analysis, Insights and Forecast - by Services Provided
- 11.2.1. Full Time Brokers
- 11.2.2. Discounted Brokers
- 11.3. Market Analysis, Insights and Forecast - by Ownership
- 11.3.1. Privately Held
- 11.3.2. Publicly Held
- 11.1. Market Analysis, Insights and Forecast - by Client
- 12. Competitive Analysis
- 12.1. Company Profiles
- 12.1.1 Interactive Brokers
- 12.1.1.1. Company Overview
- 12.1.1.2. Products
- 12.1.1.3. Company Financials
- 12.1.1.4. SWOT Analysis
- 12.1.2 Charles Schwab
- 12.1.2.1. Company Overview
- 12.1.2.2. Products
- 12.1.2.3. Company Financials
- 12.1.2.4. SWOT Analysis
- 12.1.3 Fidelity Investments
- 12.1.3.1. Company Overview
- 12.1.3.2. Products
- 12.1.3.3. Company Financials
- 12.1.3.4. SWOT Analysis
- 12.1.4 TD Ameritrade
- 12.1.4.1. Company Overview
- 12.1.4.2. Products
- 12.1.4.3. Company Financials
- 12.1.4.4. SWOT Analysis
- 12.1.5 E-Trade
- 12.1.5.1. Company Overview
- 12.1.5.2. Products
- 12.1.5.3. Company Financials
- 12.1.5.4. SWOT Analysis
- 12.1.6 TastyWorks
- 12.1.6.1. Company Overview
- 12.1.6.2. Products
- 12.1.6.3. Company Financials
- 12.1.6.4. SWOT Analysis
- 12.1.7 Etoro
- 12.1.7.1. Company Overview
- 12.1.7.2. Products
- 12.1.7.3. Company Financials
- 12.1.7.4. SWOT Analysis
- 12.1.8 X-Trade Brokers
- 12.1.8.1. Company Overview
- 12.1.8.2. Products
- 12.1.8.3. Company Financials
- 12.1.8.4. SWOT Analysis
- 12.1.9 IC Markets
- 12.1.9.1. Company Overview
- 12.1.9.2. Products
- 12.1.9.3. Company Financials
- 12.1.9.4. SWOT Analysis
- 12.1.10 Eoption
- 12.1.10.1. Company Overview
- 12.1.10.2. Products
- 12.1.10.3. Company Financials
- 12.1.10.4. SWOT Analysis
- 12.1.11 First Prudential Markets**List Not Exhaustive
- 12.1.11.1. Company Overview
- 12.1.11.2. Products
- 12.1.11.3. Company Financials
- 12.1.11.4. SWOT Analysis
- 12.1.1 Interactive Brokers
- 12.2. Market Entropy
- 12.2.1 Company's Key Areas Served
- 12.2.2 Recent Developments
- 12.3. Company Market Share Analysis 2025
- 12.3.1 Top 5 Companies Market Share Analysis
- 12.3.2 Top 3 Companies Market Share Analysis
- 12.4. List of Potential Customers
- 13. Research Methodology
List of Figures
- Figure 1: Global E-Brokerages Market Revenue Breakdown (Million, %) by Region 2025 & 2033
- Figure 2: North America E-Brokerages Market Revenue (Million), by Client 2025 & 2033
- Figure 3: North America E-Brokerages Market Revenue Share (%), by Client 2025 & 2033
- Figure 4: North America E-Brokerages Market Revenue (Million), by Services Provided 2025 & 2033
- Figure 5: North America E-Brokerages Market Revenue Share (%), by Services Provided 2025 & 2033
- Figure 6: North America E-Brokerages Market Revenue (Million), by Ownership 2025 & 2033
- Figure 7: North America E-Brokerages Market Revenue Share (%), by Ownership 2025 & 2033
- Figure 8: North America E-Brokerages Market Revenue (Million), by Country 2025 & 2033
- Figure 9: North America E-Brokerages Market Revenue Share (%), by Country 2025 & 2033
- Figure 10: Europe E-Brokerages Market Revenue (Million), by Client 2025 & 2033
- Figure 11: Europe E-Brokerages Market Revenue Share (%), by Client 2025 & 2033
- Figure 12: Europe E-Brokerages Market Revenue (Million), by Services Provided 2025 & 2033
- Figure 13: Europe E-Brokerages Market Revenue Share (%), by Services Provided 2025 & 2033
- Figure 14: Europe E-Brokerages Market Revenue (Million), by Ownership 2025 & 2033
- Figure 15: Europe E-Brokerages Market Revenue Share (%), by Ownership 2025 & 2033
- Figure 16: Europe E-Brokerages Market Revenue (Million), by Country 2025 & 2033
- Figure 17: Europe E-Brokerages Market Revenue Share (%), by Country 2025 & 2033
- Figure 18: Asia Pacific E-Brokerages Market Revenue (Million), by Client 2025 & 2033
- Figure 19: Asia Pacific E-Brokerages Market Revenue Share (%), by Client 2025 & 2033
- Figure 20: Asia Pacific E-Brokerages Market Revenue (Million), by Services Provided 2025 & 2033
- Figure 21: Asia Pacific E-Brokerages Market Revenue Share (%), by Services Provided 2025 & 2033
- Figure 22: Asia Pacific E-Brokerages Market Revenue (Million), by Ownership 2025 & 2033
- Figure 23: Asia Pacific E-Brokerages Market Revenue Share (%), by Ownership 2025 & 2033
- Figure 24: Asia Pacific E-Brokerages Market Revenue (Million), by Country 2025 & 2033
- Figure 25: Asia Pacific E-Brokerages Market Revenue Share (%), by Country 2025 & 2033
- Figure 26: South America E-Brokerages Market Revenue (Million), by Client 2025 & 2033
- Figure 27: South America E-Brokerages Market Revenue Share (%), by Client 2025 & 2033
- Figure 28: South America E-Brokerages Market Revenue (Million), by Services Provided 2025 & 2033
- Figure 29: South America E-Brokerages Market Revenue Share (%), by Services Provided 2025 & 2033
- Figure 30: South America E-Brokerages Market Revenue (Million), by Ownership 2025 & 2033
- Figure 31: South America E-Brokerages Market Revenue Share (%), by Ownership 2025 & 2033
- Figure 32: South America E-Brokerages Market Revenue (Million), by Country 2025 & 2033
- Figure 33: South America E-Brokerages Market Revenue Share (%), by Country 2025 & 2033
- Figure 34: Middle East and Africa E-Brokerages Market Revenue (Million), by Client 2025 & 2033
- Figure 35: Middle East and Africa E-Brokerages Market Revenue Share (%), by Client 2025 & 2033
- Figure 36: Middle East and Africa E-Brokerages Market Revenue (Million), by Services Provided 2025 & 2033
- Figure 37: Middle East and Africa E-Brokerages Market Revenue Share (%), by Services Provided 2025 & 2033
- Figure 38: Middle East and Africa E-Brokerages Market Revenue (Million), by Ownership 2025 & 2033
- Figure 39: Middle East and Africa E-Brokerages Market Revenue Share (%), by Ownership 2025 & 2033
- Figure 40: Middle East and Africa E-Brokerages Market Revenue (Million), by Country 2025 & 2033
- Figure 41: Middle East and Africa E-Brokerages Market Revenue Share (%), by Country 2025 & 2033
List of Tables
- Table 1: Global E-Brokerages Market Revenue Million Forecast, by Client 2020 & 2033
- Table 2: Global E-Brokerages Market Revenue Million Forecast, by Services Provided 2020 & 2033
- Table 3: Global E-Brokerages Market Revenue Million Forecast, by Ownership 2020 & 2033
- Table 4: Global E-Brokerages Market Revenue Million Forecast, by Region 2020 & 2033
- Table 5: Global E-Brokerages Market Revenue Million Forecast, by Client 2020 & 2033
- Table 6: Global E-Brokerages Market Revenue Million Forecast, by Services Provided 2020 & 2033
- Table 7: Global E-Brokerages Market Revenue Million Forecast, by Ownership 2020 & 2033
- Table 8: Global E-Brokerages Market Revenue Million Forecast, by Country 2020 & 2033
- Table 9: Global E-Brokerages Market Revenue Million Forecast, by Client 2020 & 2033
- Table 10: Global E-Brokerages Market Revenue Million Forecast, by Services Provided 2020 & 2033
- Table 11: Global E-Brokerages Market Revenue Million Forecast, by Ownership 2020 & 2033
- Table 12: Global E-Brokerages Market Revenue Million Forecast, by Country 2020 & 2033
- Table 13: Global E-Brokerages Market Revenue Million Forecast, by Client 2020 & 2033
- Table 14: Global E-Brokerages Market Revenue Million Forecast, by Services Provided 2020 & 2033
- Table 15: Global E-Brokerages Market Revenue Million Forecast, by Ownership 2020 & 2033
- Table 16: Global E-Brokerages Market Revenue Million Forecast, by Country 2020 & 2033
- Table 17: Global E-Brokerages Market Revenue Million Forecast, by Client 2020 & 2033
- Table 18: Global E-Brokerages Market Revenue Million Forecast, by Services Provided 2020 & 2033
- Table 19: Global E-Brokerages Market Revenue Million Forecast, by Ownership 2020 & 2033
- Table 20: Global E-Brokerages Market Revenue Million Forecast, by Country 2020 & 2033
- Table 21: Global E-Brokerages Market Revenue Million Forecast, by Client 2020 & 2033
- Table 22: Global E-Brokerages Market Revenue Million Forecast, by Services Provided 2020 & 2033
- Table 23: Global E-Brokerages Market Revenue Million Forecast, by Ownership 2020 & 2033
- Table 24: Global E-Brokerages Market Revenue Million Forecast, by Country 2020 & 2033
Frequently Asked Questions
1. What is the projected Compound Annual Growth Rate (CAGR) of the E-Brokerages Market?
The projected CAGR is approximately > 6.50%.
2. Which companies are prominent players in the E-Brokerages Market?
Key companies in the market include Interactive Brokers, Charles Schwab, Fidelity Investments, TD Ameritrade, E-Trade, TastyWorks, Etoro, X-Trade Brokers, IC Markets, Eoption, First Prudential Markets**List Not Exhaustive.
3. What are the main segments of the E-Brokerages Market?
The market segments include Client, Services Provided, Ownership.
4. Can you provide details about the market size?
The market size is estimated to be USD XX Million as of 2022.
5. What are some drivers contributing to market growth?
N/A
6. What are the notable trends driving market growth?
Zero commission in United States equity markets change market dynamics.
7. Are there any restraints impacting market growth?
N/A
8. Can you provide examples of recent developments in the market?
May 2022: Interactive Brokers partnered with TradingView. The new partnership was like a win-win for all parties, particularly for Interactive broker clients as they were now trading directly from their TradingView workspaces and charts.
9. What pricing options are available for accessing the report?
Pricing options include single-user, multi-user, and enterprise licenses priced at USD 4750, USD 5250, and USD 8750 respectively.
10. Is the market size provided in terms of value or volume?
The market size is provided in terms of value, measured in Million.
11. Are there any specific market keywords associated with the report?
Yes, the market keyword associated with the report is "E-Brokerages Market," which aids in identifying and referencing the specific market segment covered.
12. How do I determine which pricing option suits my needs best?
The pricing options vary based on user requirements and access needs. Individual users may opt for single-user licenses, while businesses requiring broader access may choose multi-user or enterprise licenses for cost-effective access to the report.
13. Are there any additional resources or data provided in the E-Brokerages Market report?
While the report offers comprehensive insights, it's advisable to review the specific contents or supplementary materials provided to ascertain if additional resources or data are available.
14. How can I stay updated on further developments or reports in the E-Brokerages Market?
To stay informed about further developments, trends, and reports in the E-Brokerages Market, consider subscribing to industry newsletters, following relevant companies and organizations, or regularly checking reputable industry news sources and publications.
Methodology
Step 1 - Identification of Relevant Samples Size from Population Database


Step 2 - Approaches for Defining Global Market Size (Value, Volume* & Price*)

Note*: In applicable scenarios
Step 3 - Data Sources
Primary Research
- Web Analytics
- Survey Reports
- Research Institute
- Latest Research Reports
- Opinion Leaders
Secondary Research
- Annual Reports
- White Paper
- Latest Press Release
- Industry Association
- Paid Database
- Investor Presentations

Step 4 - Data Triangulation
Involves using different sources of information in order to increase the validity of a study
These sources are likely to be stakeholders in a program - participants, other researchers, program staff, other community members, and so on.
Then we put all data in single framework & apply various statistical tools to find out the dynamic on the market.
During the analysis stage, feedback from the stakeholder groups would be compared to determine areas of agreement as well as areas of divergence