

Key Insights
The European e-brokerage market is poised for significant expansion, driven by increasing digital adoption and investor engagement. With an estimated Compound Annual Growth Rate (CAGR) of 9.4%, the market is projected to reach a size of $14.1 billion by 2024. This growth is fueled by enhanced accessibility through widespread smartphone and internet penetration, alongside the proliferation of user-friendly trading platforms offering advanced features and fractional trading. A robust regulatory environment that prioritizes transparency and investor protection further bolsters market confidence. Intense competition among established and emerging players ensures innovation and competitive pricing, attracting a diverse investor base.
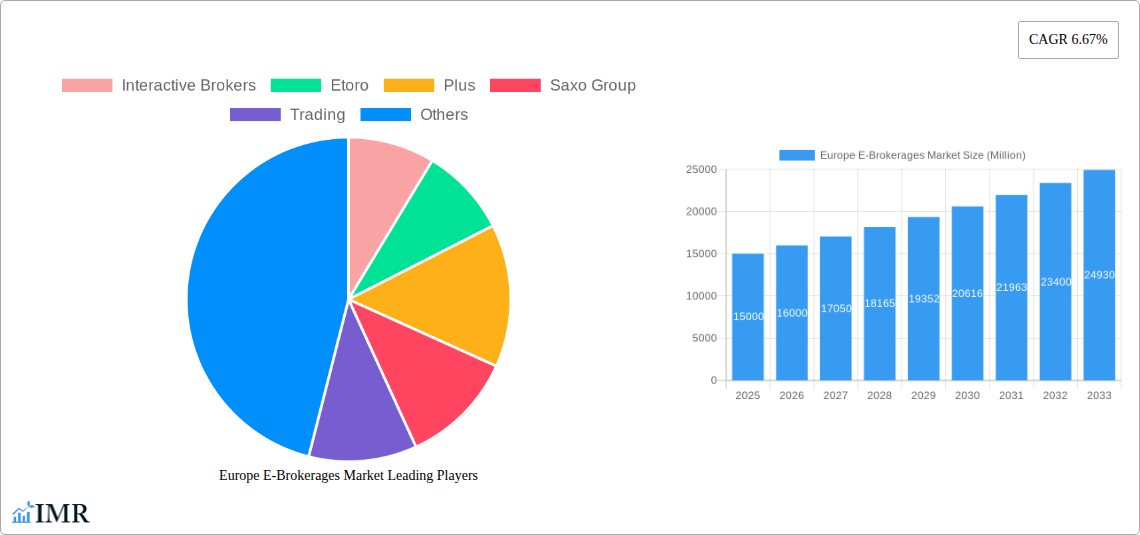
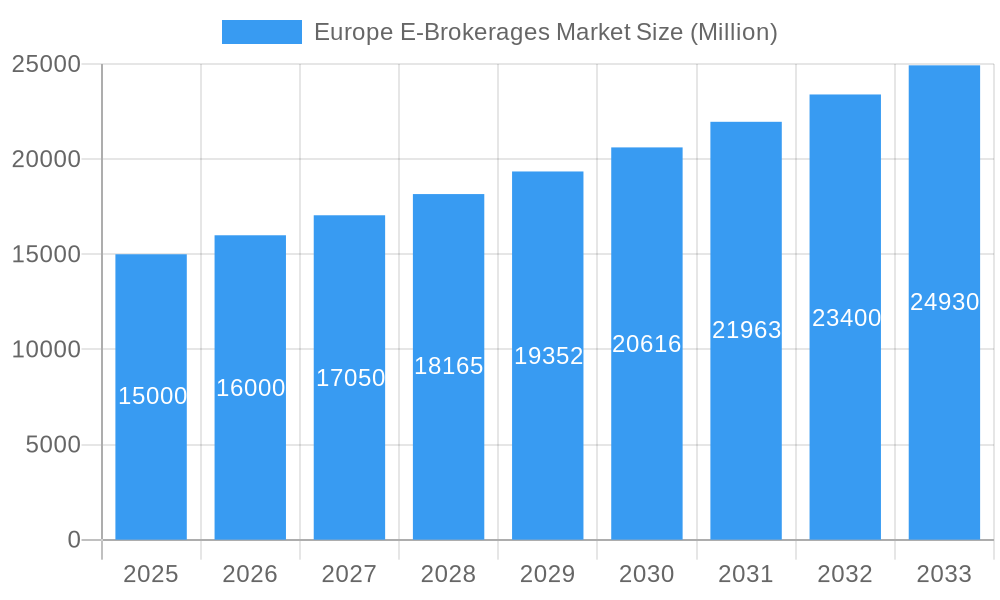
Europe E-Brokerages Market Market Size (In Billion)
Looking beyond 2024, the European e-brokerage market is expected to sustain its upward trajectory. Key drivers include the ongoing digitization of financial services, rising financial literacy, and the increasing participation of millennial and Gen Z demographics. Continuous investment in cybersecurity and proactive adaptation to evolving regulatory frameworks will be paramount for sustained success. Market segmentation likely includes retail and institutional investors, with potential specializations in asset classes such as cryptocurrencies and forex. Regional adoption rates may differ, with more mature economies potentially exhibiting higher penetration. Future market performance will hinge on ongoing technological innovation, regulatory clarity, and sustained investor trust.
Europe E-Brokerages Market Company Market Share
Europe E-Brokerages Market Analysis: Projections and Opportunities (2024-2033)
This report delivers an in-depth examination of the European e-brokerages market, covering market dynamics, growth trajectories, regional insights, product offerings, competitive landscape, and future prospects. The analysis spans from 2024 to 2033, with 2024 serving as the base year. This comprehensive study is an essential resource for investors, industry stakeholders, and those seeking to comprehend this dynamic sector. The report scrutinizes the broader Online Trading market and its specific e-brokerages segment within Europe. Market valuations are presented in billions.
Europe E-Brokerages Market Market Dynamics & Structure
The European e-brokerages market is characterized by intense competition, rapid technological advancements, and evolving regulatory landscapes. Market concentration is moderate, with a few major players holding significant market share, but a large number of smaller, specialized firms also contributing to the overall market. This analysis covers the period from 2019 to 2024.
- Market Concentration: The top 5 players account for approximately xx% of the market share in 2024. This demonstrates a moderately consolidated market with opportunities for smaller players to specialize and gain traction.
- Technological Innovation: The market is driven by continuous innovation in trading platforms, algorithmic trading tools, and mobile applications, enhancing user experience and expanding market reach. However, integration complexities and security concerns pose barriers to innovation.
- Regulatory Frameworks: Stringent regulations regarding investor protection, data privacy, and anti-money laundering (AML) compliance heavily influence market operations. Regulatory changes and compliance costs can significantly impact profitability.
- Competitive Product Substitutes: Traditional brokerage firms and investment platforms represent key substitutes. The competitive landscape is further diversified by the emergence of robo-advisors and specialized trading platforms.
- End-User Demographics: The market caters to a diverse range of users, from retail investors and high-net-worth individuals to institutional clients. Changing demographics and evolving investor preferences are driving market segmentation.
- M&A Trends: The past five years have witnessed xx M&A deals in the European e-brokerages market. Consolidation through mergers and acquisitions is expected to continue, shaping the competitive landscape. Larger firms are acquiring smaller companies to enhance their technology, broaden their product portfolio, and expand into new markets.
Europe E-Brokerages Market Growth Trends & Insights
The European e-brokerages market is experiencing robust growth, fueled by several key factors. The market size is projected to reach xx million by 2025 and xx million by 2033, exhibiting a CAGR of xx% during the forecast period (2025-2033). This growth is attributed to the increasing adoption of online trading platforms, rising retail investor participation driven by financial technology (fintech) advancements, and favorable regulatory environments in certain regions. Increased mobile penetration and user-friendly interfaces are also significantly contributing to the widespread adoption of online brokerage services. However, macroeconomic fluctuations and geopolitical uncertainties might influence investment behavior and market growth in the coming years.
Dominant Regions, Countries, or Segments in Europe E-Brokerages Market
The United Kingdom and Germany are currently leading the European e-brokerages market, accounting for a combined xx% of the total market share in 2024. This dominance can be attributed to factors such as:
- Developed Financial Infrastructure: The UK and Germany boast robust financial infrastructure, facilitating efficient and secure online trading operations.
- High Internet and Smartphone Penetration: High rates of internet and smartphone adoption provide widespread access to online brokerage services.
- Strong Regulatory Frameworks: Though stringent, established regulatory frameworks foster investor confidence and market stability.
- Growing Retail Investor Base: The increasing participation of retail investors in online trading is driving market growth within these countries.
- Favorable Economic Conditions (Historically): Relatively stable economic conditions in these regions historically contributed to increased investor activity. However, future economic outlook might affect this.
Other significant markets include France, Italy, and the Nordic countries, which are expected to witness considerable growth in the coming years.
Europe E-Brokerages Market Product Landscape
E-brokerage platforms are constantly evolving, offering enhanced functionalities, including advanced charting tools, sophisticated order types, educational resources, and improved mobile apps. The integration of artificial intelligence (AI) and machine learning (ML) is transforming the trading experience, enabling personalized recommendations, risk management tools, and automated trading strategies. Key product differentiators include commission structures, trading fees, platform usability, and the range of investment products offered.
Key Drivers, Barriers & Challenges in Europe E-Brokerages Market
Key Drivers:
- The proliferation of mobile trading apps and user-friendly interfaces has significantly increased accessibility and adoption.
- Regulatory measures aiming to increase investor protection and transparency are driving confidence in the market.
- Increasing popularity of fractional share trading among new investors.
- The increasing availability of educational resources and online investment courses.
Challenges and Restraints:
- Intense competition among established players and emerging fintech companies creates downward pricing pressure.
- Maintaining robust cybersecurity infrastructure to mitigate risks of data breaches and fraud is crucial.
- Regulatory scrutiny and compliance requirements can pose significant operational and financial challenges.
- Market volatility and economic downturns impact investor sentiment and trading activity.
Emerging Opportunities in Europe E-Brokerages Market
- Expansion into untapped markets within Eastern Europe presents a significant growth opportunity.
- Development of specialized platforms catering to specific investor segments, such as sustainable investing or cryptocurrency trading.
- Leveraging AI and ML for personalized investment advice and risk management solutions.
- Partnering with financial institutions to offer bundled financial products.
Growth Accelerators in the Europe E-Brokerages Market Industry
Strategic partnerships between e-brokerages and financial institutions can unlock access to wider client bases and product offerings. Continuous technological innovation, particularly in AI-powered trading tools and personalized investment advice, will be key growth drivers. Expansion into underserved markets within Europe and the development of niche product offerings tailored to specific investor needs will further accelerate market growth.
Key Players Shaping the Europe E-Brokerages Market Market
- Interactive Brokers
- Etoro
- Plus500
- Saxo Group
- Trading 212
- Degiro
- Exante
- X-Trade Brokers
- Robinhood
- SwissQuote
- BUX
- Vanguard
- Capital.com
- Tradestation
- Freetrade
- Hargreaves Lansdown
- IC Markets
- Other Key Players (List Not Exhaustive)
Notable Milestones in Europe E-Brokerages Market Sector
- February 2023: Interactive Brokers launched its new IBUSOPT order destination to improve price execution for options trades.
- January 2023: Etoro launched ValueGurus, a portfolio offering long-term exposure to value investing strategies.
In-Depth Europe E-Brokerages Market Market Outlook
The European e-brokerages market is poised for sustained growth, driven by technological advancements, increasing retail investor participation, and strategic market expansion. The continued development of user-friendly platforms, innovative trading tools, and tailored investment solutions will attract a broader range of investors, fueling market expansion. Strategic partnerships and mergers and acquisitions will further shape the market landscape, creating opportunities for both established players and emerging fintech companies.
Europe E-Brokerages Market Segmentation
-
1. Investor Type
- 1.1. Retail
- 1.2. Institutional
-
2. Services Offered
- 2.1. Full Time Brokers
- 2.2. Discount Brokers
-
3. Operation
- 3.1. Domestic
- 3.2. Foreign
Europe E-Brokerages Market Segmentation By Geography
- 1. Germany
- 2. United Kingdom
- 3. Russia
- 4. Spain
- 5. Netherlands
- 6. Denmark
- 7. Sweden
- 8. Finland
- 9. Norway
- 10. Rest of Europe
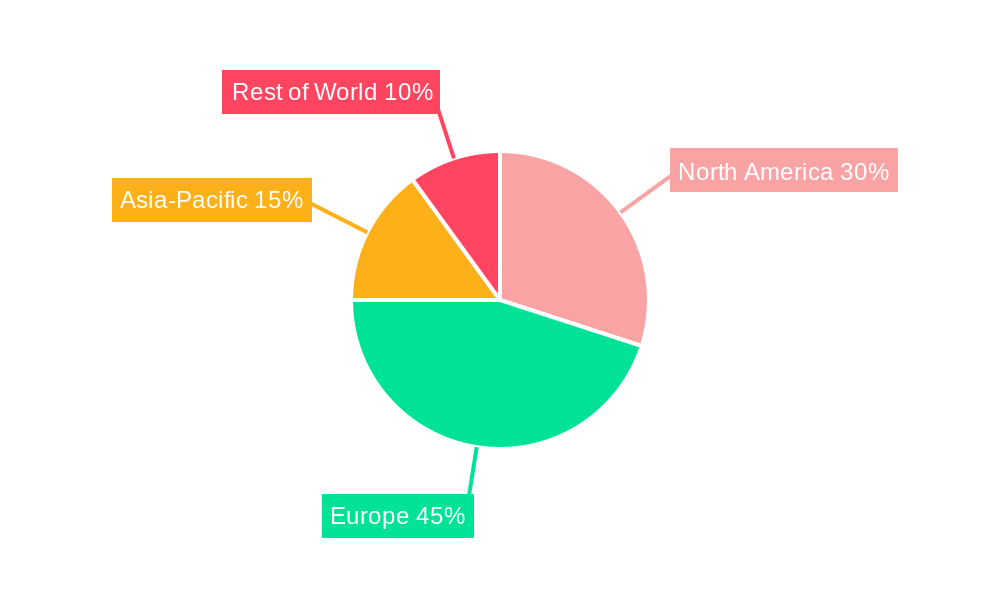
Europe E-Brokerages Market Regional Market Share
Geographic Coverage of Europe E-Brokerages Market
Europe E-Brokerages Market REPORT HIGHLIGHTS
| Aspects | Details |
|---|---|
| Study Period | 2020-2034 |
| Base Year | 2025 |
| Estimated Year | 2026 |
| Forecast Period | 2026-2034 |
| Historical Period | 2020-2025 |
| Growth Rate | CAGR of 9.4% from 2020-2034 |
| Segmentation |
|
Table of Contents
- 1. Introduction
- 1.1. Research Scope
- 1.2. Market Segmentation
- 1.3. Research Objective
- 1.4. Definitions and Assumptions
- 2. Executive Summary
- 2.1. Market Snapshot
- 3. Market Dynamics
- 3.1. Market Drivers
- 3.2. Market Restrains
- 3.3. Market Trends
- 3.4. Market Opportunities
- 4. Market Factor Analysis
- 4.1. Porters Five Forces
- 4.1.1. Bargaining Power of Suppliers
- 4.1.2. Bargaining Power of Buyers
- 4.1.3. Threat of New Entrants
- 4.1.4. Threat of Substitutes
- 4.1.5. Competitive Rivalry
- 4.2. PESTEL analysis
- 4.3. BCG Analysis
- 4.3.1. Stars (High Growth, High Market Share)
- 4.3.2. Cash Cows (Low Growth, High Market Share)
- 4.3.3. Question Mark (High Growth, Low Market Share)
- 4.3.4. Dogs (Low Growth, Low Market Share)
- 4.4. Ansoff Matrix Analysis
- 4.5. Supply Chain Analysis
- 4.6. Regulatory Landscape
- 4.7. Current Market Potential and Opportunity Assessment (TAM–SAM–SOM Framework)
- 4.8. IMR Analyst Note
- 4.1. Porters Five Forces
- 5. Market Analysis, Insights and Forecast 2021-2033
- 5.1. Market Analysis, Insights and Forecast - by Investor Type
- 5.1.1. Retail
- 5.1.2. Institutional
- 5.2. Market Analysis, Insights and Forecast - by Services Offered
- 5.2.1. Full Time Brokers
- 5.2.2. Discount Brokers
- 5.3. Market Analysis, Insights and Forecast - by Operation
- 5.3.1. Domestic
- 5.3.2. Foreign
- 5.4. Market Analysis, Insights and Forecast - by Region
- 5.4.1. Germany
- 5.4.2. United Kingdom
- 5.4.3. Russia
- 5.4.4. Spain
- 5.4.5. Netherlands
- 5.4.6. Denmark
- 5.4.7. Sweden
- 5.4.8. Finland
- 5.4.9. Norway
- 5.4.10. Rest of Europe
- 5.1. Market Analysis, Insights and Forecast - by Investor Type
- 6. Global Europe E-Brokerages Market Analysis, Insights and Forecast, 2021-2033
- 6.1. Market Analysis, Insights and Forecast - by Investor Type
- 6.1.1. Retail
- 6.1.2. Institutional
- 6.2. Market Analysis, Insights and Forecast - by Services Offered
- 6.2.1. Full Time Brokers
- 6.2.2. Discount Brokers
- 6.3. Market Analysis, Insights and Forecast - by Operation
- 6.3.1. Domestic
- 6.3.2. Foreign
- 6.1. Market Analysis, Insights and Forecast - by Investor Type
- 7. Germany Europe E-Brokerages Market Analysis, Insights and Forecast, 2020-2032
- 7.1. Market Analysis, Insights and Forecast - by Investor Type
- 7.1.1. Retail
- 7.1.2. Institutional
- 7.2. Market Analysis, Insights and Forecast - by Services Offered
- 7.2.1. Full Time Brokers
- 7.2.2. Discount Brokers
- 7.3. Market Analysis, Insights and Forecast - by Operation
- 7.3.1. Domestic
- 7.3.2. Foreign
- 7.1. Market Analysis, Insights and Forecast - by Investor Type
- 8. United Kingdom Europe E-Brokerages Market Analysis, Insights and Forecast, 2020-2032
- 8.1. Market Analysis, Insights and Forecast - by Investor Type
- 8.1.1. Retail
- 8.1.2. Institutional
- 8.2. Market Analysis, Insights and Forecast - by Services Offered
- 8.2.1. Full Time Brokers
- 8.2.2. Discount Brokers
- 8.3. Market Analysis, Insights and Forecast - by Operation
- 8.3.1. Domestic
- 8.3.2. Foreign
- 8.1. Market Analysis, Insights and Forecast - by Investor Type
- 9. Russia Europe E-Brokerages Market Analysis, Insights and Forecast, 2020-2032
- 9.1. Market Analysis, Insights and Forecast - by Investor Type
- 9.1.1. Retail
- 9.1.2. Institutional
- 9.2. Market Analysis, Insights and Forecast - by Services Offered
- 9.2.1. Full Time Brokers
- 9.2.2. Discount Brokers
- 9.3. Market Analysis, Insights and Forecast - by Operation
- 9.3.1. Domestic
- 9.3.2. Foreign
- 9.1. Market Analysis, Insights and Forecast - by Investor Type
- 10. Spain Europe E-Brokerages Market Analysis, Insights and Forecast, 2020-2032
- 10.1. Market Analysis, Insights and Forecast - by Investor Type
- 10.1.1. Retail
- 10.1.2. Institutional
- 10.2. Market Analysis, Insights and Forecast - by Services Offered
- 10.2.1. Full Time Brokers
- 10.2.2. Discount Brokers
- 10.3. Market Analysis, Insights and Forecast - by Operation
- 10.3.1. Domestic
- 10.3.2. Foreign
- 10.1. Market Analysis, Insights and Forecast - by Investor Type
- 11. Netherlands Europe E-Brokerages Market Analysis, Insights and Forecast, 2020-2032
- 11.1. Market Analysis, Insights and Forecast - by Investor Type
- 11.1.1. Retail
- 11.1.2. Institutional
- 11.2. Market Analysis, Insights and Forecast - by Services Offered
- 11.2.1. Full Time Brokers
- 11.2.2. Discount Brokers
- 11.3. Market Analysis, Insights and Forecast - by Operation
- 11.3.1. Domestic
- 11.3.2. Foreign
- 11.1. Market Analysis, Insights and Forecast - by Investor Type
- 12. Denmark Europe E-Brokerages Market Analysis, Insights and Forecast, 2020-2032
- 12.1. Market Analysis, Insights and Forecast - by Investor Type
- 12.1.1. Retail
- 12.1.2. Institutional
- 12.2. Market Analysis, Insights and Forecast - by Services Offered
- 12.2.1. Full Time Brokers
- 12.2.2. Discount Brokers
- 12.3. Market Analysis, Insights and Forecast - by Operation
- 12.3.1. Domestic
- 12.3.2. Foreign
- 12.1. Market Analysis, Insights and Forecast - by Investor Type
- 13. Sweden Europe E-Brokerages Market Analysis, Insights and Forecast, 2020-2032
- 13.1. Market Analysis, Insights and Forecast - by Investor Type
- 13.1.1. Retail
- 13.1.2. Institutional
- 13.2. Market Analysis, Insights and Forecast - by Services Offered
- 13.2.1. Full Time Brokers
- 13.2.2. Discount Brokers
- 13.3. Market Analysis, Insights and Forecast - by Operation
- 13.3.1. Domestic
- 13.3.2. Foreign
- 13.1. Market Analysis, Insights and Forecast - by Investor Type
- 14. Finland Europe E-Brokerages Market Analysis, Insights and Forecast, 2020-2032
- 14.1. Market Analysis, Insights and Forecast - by Investor Type
- 14.1.1. Retail
- 14.1.2. Institutional
- 14.2. Market Analysis, Insights and Forecast - by Services Offered
- 14.2.1. Full Time Brokers
- 14.2.2. Discount Brokers
- 14.3. Market Analysis, Insights and Forecast - by Operation
- 14.3.1. Domestic
- 14.3.2. Foreign
- 14.1. Market Analysis, Insights and Forecast - by Investor Type
- 15. Norway Europe E-Brokerages Market Analysis, Insights and Forecast, 2020-2032
- 15.1. Market Analysis, Insights and Forecast - by Investor Type
- 15.1.1. Retail
- 15.1.2. Institutional
- 15.2. Market Analysis, Insights and Forecast - by Services Offered
- 15.2.1. Full Time Brokers
- 15.2.2. Discount Brokers
- 15.3. Market Analysis, Insights and Forecast - by Operation
- 15.3.1. Domestic
- 15.3.2. Foreign
- 15.1. Market Analysis, Insights and Forecast - by Investor Type
- 16. Rest of Europe Europe E-Brokerages Market Analysis, Insights and Forecast, 2020-2032
- 16.1. Market Analysis, Insights and Forecast - by Investor Type
- 16.1.1. Retail
- 16.1.2. Institutional
- 16.2. Market Analysis, Insights and Forecast - by Services Offered
- 16.2.1. Full Time Brokers
- 16.2.2. Discount Brokers
- 16.3. Market Analysis, Insights and Forecast - by Operation
- 16.3.1. Domestic
- 16.3.2. Foreign
- 16.1. Market Analysis, Insights and Forecast - by Investor Type
- 17. Competitive Analysis
- 17.1. Company Profiles
- 17.1.1 Interactive Brokers
- 17.1.1.1. Company Overview
- 17.1.1.2. Products
- 17.1.1.3. Company Financials
- 17.1.1.4. SWOT Analysis
- 17.1.2 Etoro
- 17.1.2.1. Company Overview
- 17.1.2.2. Products
- 17.1.2.3. Company Financials
- 17.1.2.4. SWOT Analysis
- 17.1.3 Plus
- 17.1.3.1. Company Overview
- 17.1.3.2. Products
- 17.1.3.3. Company Financials
- 17.1.3.4. SWOT Analysis
- 17.1.4 Saxo Group
- 17.1.4.1. Company Overview
- 17.1.4.2. Products
- 17.1.4.3. Company Financials
- 17.1.4.4. SWOT Analysis
- 17.1.5 Trading
- 17.1.5.1. Company Overview
- 17.1.5.2. Products
- 17.1.5.3. Company Financials
- 17.1.5.4. SWOT Analysis
- 17.1.6 Degiro
- 17.1.6.1. Company Overview
- 17.1.6.2. Products
- 17.1.6.3. Company Financials
- 17.1.6.4. SWOT Analysis
- 17.1.7 Exante
- 17.1.7.1. Company Overview
- 17.1.7.2. Products
- 17.1.7.3. Company Financials
- 17.1.7.4. SWOT Analysis
- 17.1.8 X-Trade Brokers
- 17.1.8.1. Company Overview
- 17.1.8.2. Products
- 17.1.8.3. Company Financials
- 17.1.8.4. SWOT Analysis
- 17.1.9 Robinhood
- 17.1.9.1. Company Overview
- 17.1.9.2. Products
- 17.1.9.3. Company Financials
- 17.1.9.4. SWOT Analysis
- 17.1.10 SwissQuote
- 17.1.10.1. Company Overview
- 17.1.10.2. Products
- 17.1.10.3. Company Financials
- 17.1.10.4. SWOT Analysis
- 17.1.11 BUX
- 17.1.11.1. Company Overview
- 17.1.11.2. Products
- 17.1.11.3. Company Financials
- 17.1.11.4. SWOT Analysis
- 17.1.12 Vanguard
- 17.1.12.1. Company Overview
- 17.1.12.2. Products
- 17.1.12.3. Company Financials
- 17.1.12.4. SWOT Analysis
- 17.1.13 Capital Com
- 17.1.13.1. Company Overview
- 17.1.13.2. Products
- 17.1.13.3. Company Financials
- 17.1.13.4. SWOT Analysis
- 17.1.14 Tradestation
- 17.1.14.1. Company Overview
- 17.1.14.2. Products
- 17.1.14.3. Company Financials
- 17.1.14.4. SWOT Analysis
- 17.1.15 Freetrade
- 17.1.15.1. Company Overview
- 17.1.15.2. Products
- 17.1.15.3. Company Financials
- 17.1.15.4. SWOT Analysis
- 17.1.16 Hargreaves Lansdown
- 17.1.16.1. Company Overview
- 17.1.16.2. Products
- 17.1.16.3. Company Financials
- 17.1.16.4. SWOT Analysis
- 17.1.17 IC Market
- 17.1.17.1. Company Overview
- 17.1.17.2. Products
- 17.1.17.3. Company Financials
- 17.1.17.4. SWOT Analysis
- 17.1.18 Other Key Players**List Not Exhaustive
- 17.1.18.1. Company Overview
- 17.1.18.2. Products
- 17.1.18.3. Company Financials
- 17.1.18.4. SWOT Analysis
- 17.1.1 Interactive Brokers
- 17.2. Market Entropy
- 17.2.1 Company's Key Areas Served
- 17.2.2 Recent Developments
- 17.3. Company Market Share Analysis 2025
- 17.3.1 Top 5 Companies Market Share Analysis
- 17.3.2 Top 3 Companies Market Share Analysis
- 17.4. List of Potential Customers
- 18. Research Methodology
List of Figures
- Figure 1: Global Europe E-Brokerages Market Revenue Breakdown (billion, %) by Region 2025 & 2033
- Figure 2: Germany Europe E-Brokerages Market Revenue (billion), by Investor Type 2025 & 2033
- Figure 3: Germany Europe E-Brokerages Market Revenue Share (%), by Investor Type 2025 & 2033
- Figure 4: Germany Europe E-Brokerages Market Revenue (billion), by Services Offered 2025 & 2033
- Figure 5: Germany Europe E-Brokerages Market Revenue Share (%), by Services Offered 2025 & 2033
- Figure 6: Germany Europe E-Brokerages Market Revenue (billion), by Operation 2025 & 2033
- Figure 7: Germany Europe E-Brokerages Market Revenue Share (%), by Operation 2025 & 2033
- Figure 8: Germany Europe E-Brokerages Market Revenue (billion), by Country 2025 & 2033
- Figure 9: Germany Europe E-Brokerages Market Revenue Share (%), by Country 2025 & 2033
- Figure 10: United Kingdom Europe E-Brokerages Market Revenue (billion), by Investor Type 2025 & 2033
- Figure 11: United Kingdom Europe E-Brokerages Market Revenue Share (%), by Investor Type 2025 & 2033
- Figure 12: United Kingdom Europe E-Brokerages Market Revenue (billion), by Services Offered 2025 & 2033
- Figure 13: United Kingdom Europe E-Brokerages Market Revenue Share (%), by Services Offered 2025 & 2033
- Figure 14: United Kingdom Europe E-Brokerages Market Revenue (billion), by Operation 2025 & 2033
- Figure 15: United Kingdom Europe E-Brokerages Market Revenue Share (%), by Operation 2025 & 2033
- Figure 16: United Kingdom Europe E-Brokerages Market Revenue (billion), by Country 2025 & 2033
- Figure 17: United Kingdom Europe E-Brokerages Market Revenue Share (%), by Country 2025 & 2033
- Figure 18: Russia Europe E-Brokerages Market Revenue (billion), by Investor Type 2025 & 2033
- Figure 19: Russia Europe E-Brokerages Market Revenue Share (%), by Investor Type 2025 & 2033
- Figure 20: Russia Europe E-Brokerages Market Revenue (billion), by Services Offered 2025 & 2033
- Figure 21: Russia Europe E-Brokerages Market Revenue Share (%), by Services Offered 2025 & 2033
- Figure 22: Russia Europe E-Brokerages Market Revenue (billion), by Operation 2025 & 2033
- Figure 23: Russia Europe E-Brokerages Market Revenue Share (%), by Operation 2025 & 2033
- Figure 24: Russia Europe E-Brokerages Market Revenue (billion), by Country 2025 & 2033
- Figure 25: Russia Europe E-Brokerages Market Revenue Share (%), by Country 2025 & 2033
- Figure 26: Spain Europe E-Brokerages Market Revenue (billion), by Investor Type 2025 & 2033
- Figure 27: Spain Europe E-Brokerages Market Revenue Share (%), by Investor Type 2025 & 2033
- Figure 28: Spain Europe E-Brokerages Market Revenue (billion), by Services Offered 2025 & 2033
- Figure 29: Spain Europe E-Brokerages Market Revenue Share (%), by Services Offered 2025 & 2033
- Figure 30: Spain Europe E-Brokerages Market Revenue (billion), by Operation 2025 & 2033
- Figure 31: Spain Europe E-Brokerages Market Revenue Share (%), by Operation 2025 & 2033
- Figure 32: Spain Europe E-Brokerages Market Revenue (billion), by Country 2025 & 2033
- Figure 33: Spain Europe E-Brokerages Market Revenue Share (%), by Country 2025 & 2033
- Figure 34: Netherlands Europe E-Brokerages Market Revenue (billion), by Investor Type 2025 & 2033
- Figure 35: Netherlands Europe E-Brokerages Market Revenue Share (%), by Investor Type 2025 & 2033
- Figure 36: Netherlands Europe E-Brokerages Market Revenue (billion), by Services Offered 2025 & 2033
- Figure 37: Netherlands Europe E-Brokerages Market Revenue Share (%), by Services Offered 2025 & 2033
- Figure 38: Netherlands Europe E-Brokerages Market Revenue (billion), by Operation 2025 & 2033
- Figure 39: Netherlands Europe E-Brokerages Market Revenue Share (%), by Operation 2025 & 2033
- Figure 40: Netherlands Europe E-Brokerages Market Revenue (billion), by Country 2025 & 2033
- Figure 41: Netherlands Europe E-Brokerages Market Revenue Share (%), by Country 2025 & 2033
- Figure 42: Denmark Europe E-Brokerages Market Revenue (billion), by Investor Type 2025 & 2033
- Figure 43: Denmark Europe E-Brokerages Market Revenue Share (%), by Investor Type 2025 & 2033
- Figure 44: Denmark Europe E-Brokerages Market Revenue (billion), by Services Offered 2025 & 2033
- Figure 45: Denmark Europe E-Brokerages Market Revenue Share (%), by Services Offered 2025 & 2033
- Figure 46: Denmark Europe E-Brokerages Market Revenue (billion), by Operation 2025 & 2033
- Figure 47: Denmark Europe E-Brokerages Market Revenue Share (%), by Operation 2025 & 2033
- Figure 48: Denmark Europe E-Brokerages Market Revenue (billion), by Country 2025 & 2033
- Figure 49: Denmark Europe E-Brokerages Market Revenue Share (%), by Country 2025 & 2033
- Figure 50: Sweden Europe E-Brokerages Market Revenue (billion), by Investor Type 2025 & 2033
- Figure 51: Sweden Europe E-Brokerages Market Revenue Share (%), by Investor Type 2025 & 2033
- Figure 52: Sweden Europe E-Brokerages Market Revenue (billion), by Services Offered 2025 & 2033
- Figure 53: Sweden Europe E-Brokerages Market Revenue Share (%), by Services Offered 2025 & 2033
- Figure 54: Sweden Europe E-Brokerages Market Revenue (billion), by Operation 2025 & 2033
- Figure 55: Sweden Europe E-Brokerages Market Revenue Share (%), by Operation 2025 & 2033
- Figure 56: Sweden Europe E-Brokerages Market Revenue (billion), by Country 2025 & 2033
- Figure 57: Sweden Europe E-Brokerages Market Revenue Share (%), by Country 2025 & 2033
- Figure 58: Finland Europe E-Brokerages Market Revenue (billion), by Investor Type 2025 & 2033
- Figure 59: Finland Europe E-Brokerages Market Revenue Share (%), by Investor Type 2025 & 2033
- Figure 60: Finland Europe E-Brokerages Market Revenue (billion), by Services Offered 2025 & 2033
- Figure 61: Finland Europe E-Brokerages Market Revenue Share (%), by Services Offered 2025 & 2033
- Figure 62: Finland Europe E-Brokerages Market Revenue (billion), by Operation 2025 & 2033
- Figure 63: Finland Europe E-Brokerages Market Revenue Share (%), by Operation 2025 & 2033
- Figure 64: Finland Europe E-Brokerages Market Revenue (billion), by Country 2025 & 2033
- Figure 65: Finland Europe E-Brokerages Market Revenue Share (%), by Country 2025 & 2033
- Figure 66: Norway Europe E-Brokerages Market Revenue (billion), by Investor Type 2025 & 2033
- Figure 67: Norway Europe E-Brokerages Market Revenue Share (%), by Investor Type 2025 & 2033
- Figure 68: Norway Europe E-Brokerages Market Revenue (billion), by Services Offered 2025 & 2033
- Figure 69: Norway Europe E-Brokerages Market Revenue Share (%), by Services Offered 2025 & 2033
- Figure 70: Norway Europe E-Brokerages Market Revenue (billion), by Operation 2025 & 2033
- Figure 71: Norway Europe E-Brokerages Market Revenue Share (%), by Operation 2025 & 2033
- Figure 72: Norway Europe E-Brokerages Market Revenue (billion), by Country 2025 & 2033
- Figure 73: Norway Europe E-Brokerages Market Revenue Share (%), by Country 2025 & 2033
- Figure 74: Rest of Europe Europe E-Brokerages Market Revenue (billion), by Investor Type 2025 & 2033
- Figure 75: Rest of Europe Europe E-Brokerages Market Revenue Share (%), by Investor Type 2025 & 2033
- Figure 76: Rest of Europe Europe E-Brokerages Market Revenue (billion), by Services Offered 2025 & 2033
- Figure 77: Rest of Europe Europe E-Brokerages Market Revenue Share (%), by Services Offered 2025 & 2033
- Figure 78: Rest of Europe Europe E-Brokerages Market Revenue (billion), by Operation 2025 & 2033
- Figure 79: Rest of Europe Europe E-Brokerages Market Revenue Share (%), by Operation 2025 & 2033
- Figure 80: Rest of Europe Europe E-Brokerages Market Revenue (billion), by Country 2025 & 2033
- Figure 81: Rest of Europe Europe E-Brokerages Market Revenue Share (%), by Country 2025 & 2033
List of Tables
- Table 1: Global Europe E-Brokerages Market Revenue billion Forecast, by Investor Type 2020 & 2033
- Table 2: Global Europe E-Brokerages Market Revenue billion Forecast, by Services Offered 2020 & 2033
- Table 3: Global Europe E-Brokerages Market Revenue billion Forecast, by Operation 2020 & 2033
- Table 4: Global Europe E-Brokerages Market Revenue billion Forecast, by Region 2020 & 2033
- Table 5: Global Europe E-Brokerages Market Revenue billion Forecast, by Investor Type 2020 & 2033
- Table 6: Global Europe E-Brokerages Market Revenue billion Forecast, by Services Offered 2020 & 2033
- Table 7: Global Europe E-Brokerages Market Revenue billion Forecast, by Operation 2020 & 2033
- Table 8: Global Europe E-Brokerages Market Revenue billion Forecast, by Country 2020 & 2033
- Table 9: Global Europe E-Brokerages Market Revenue billion Forecast, by Investor Type 2020 & 2033
- Table 10: Global Europe E-Brokerages Market Revenue billion Forecast, by Services Offered 2020 & 2033
- Table 11: Global Europe E-Brokerages Market Revenue billion Forecast, by Operation 2020 & 2033
- Table 12: Global Europe E-Brokerages Market Revenue billion Forecast, by Country 2020 & 2033
- Table 13: Global Europe E-Brokerages Market Revenue billion Forecast, by Investor Type 2020 & 2033
- Table 14: Global Europe E-Brokerages Market Revenue billion Forecast, by Services Offered 2020 & 2033
- Table 15: Global Europe E-Brokerages Market Revenue billion Forecast, by Operation 2020 & 2033
- Table 16: Global Europe E-Brokerages Market Revenue billion Forecast, by Country 2020 & 2033
- Table 17: Global Europe E-Brokerages Market Revenue billion Forecast, by Investor Type 2020 & 2033
- Table 18: Global Europe E-Brokerages Market Revenue billion Forecast, by Services Offered 2020 & 2033
- Table 19: Global Europe E-Brokerages Market Revenue billion Forecast, by Operation 2020 & 2033
- Table 20: Global Europe E-Brokerages Market Revenue billion Forecast, by Country 2020 & 2033
- Table 21: Global Europe E-Brokerages Market Revenue billion Forecast, by Investor Type 2020 & 2033
- Table 22: Global Europe E-Brokerages Market Revenue billion Forecast, by Services Offered 2020 & 2033
- Table 23: Global Europe E-Brokerages Market Revenue billion Forecast, by Operation 2020 & 2033
- Table 24: Global Europe E-Brokerages Market Revenue billion Forecast, by Country 2020 & 2033
- Table 25: Global Europe E-Brokerages Market Revenue billion Forecast, by Investor Type 2020 & 2033
- Table 26: Global Europe E-Brokerages Market Revenue billion Forecast, by Services Offered 2020 & 2033
- Table 27: Global Europe E-Brokerages Market Revenue billion Forecast, by Operation 2020 & 2033
- Table 28: Global Europe E-Brokerages Market Revenue billion Forecast, by Country 2020 & 2033
- Table 29: Global Europe E-Brokerages Market Revenue billion Forecast, by Investor Type 2020 & 2033
- Table 30: Global Europe E-Brokerages Market Revenue billion Forecast, by Services Offered 2020 & 2033
- Table 31: Global Europe E-Brokerages Market Revenue billion Forecast, by Operation 2020 & 2033
- Table 32: Global Europe E-Brokerages Market Revenue billion Forecast, by Country 2020 & 2033
- Table 33: Global Europe E-Brokerages Market Revenue billion Forecast, by Investor Type 2020 & 2033
- Table 34: Global Europe E-Brokerages Market Revenue billion Forecast, by Services Offered 2020 & 2033
- Table 35: Global Europe E-Brokerages Market Revenue billion Forecast, by Operation 2020 & 2033
- Table 36: Global Europe E-Brokerages Market Revenue billion Forecast, by Country 2020 & 2033
- Table 37: Global Europe E-Brokerages Market Revenue billion Forecast, by Investor Type 2020 & 2033
- Table 38: Global Europe E-Brokerages Market Revenue billion Forecast, by Services Offered 2020 & 2033
- Table 39: Global Europe E-Brokerages Market Revenue billion Forecast, by Operation 2020 & 2033
- Table 40: Global Europe E-Brokerages Market Revenue billion Forecast, by Country 2020 & 2033
- Table 41: Global Europe E-Brokerages Market Revenue billion Forecast, by Investor Type 2020 & 2033
- Table 42: Global Europe E-Brokerages Market Revenue billion Forecast, by Services Offered 2020 & 2033
- Table 43: Global Europe E-Brokerages Market Revenue billion Forecast, by Operation 2020 & 2033
- Table 44: Global Europe E-Brokerages Market Revenue billion Forecast, by Country 2020 & 2033
Frequently Asked Questions
1. What is the projected Compound Annual Growth Rate (CAGR) of the Europe E-Brokerages Market?
The projected CAGR is approximately 9.4%.
2. Which companies are prominent players in the Europe E-Brokerages Market?
Key companies in the market include Interactive Brokers, Etoro, Plus, Saxo Group, Trading, Degiro, Exante, X-Trade Brokers, Robinhood, SwissQuote, BUX, Vanguard, Capital Com, Tradestation, Freetrade, Hargreaves Lansdown, IC Market, Other Key Players**List Not Exhaustive.
3. What are the main segments of the Europe E-Brokerages Market?
The market segments include Investor Type, Services Offered, Operation.
4. Can you provide details about the market size?
The market size is estimated to be USD 14.1 billion as of 2022.
5. What are some drivers contributing to market growth?
N/A
6. What are the notable trends driving market growth?
Growing Retail Investors in The Region is Driving The E-Brokerages Market.
7. Are there any restraints impacting market growth?
N/A
8. Can you provide examples of recent developments in the market?
February 2023: Interactive Brokers announced the launch of its new IBUSOPT order destination. With the dramatic increase in retail options trading, Interactive Brokers has launched this new order destination to help its retail and institutional clients achieve better price execution on their options trades.
9. What pricing options are available for accessing the report?
Pricing options include single-user, multi-user, and enterprise licenses priced at USD 4750, USD 5250, and USD 8750 respectively.
10. Is the market size provided in terms of value or volume?
The market size is provided in terms of value, measured in billion.
11. Are there any specific market keywords associated with the report?
Yes, the market keyword associated with the report is "Europe E-Brokerages Market," which aids in identifying and referencing the specific market segment covered.
12. How do I determine which pricing option suits my needs best?
The pricing options vary based on user requirements and access needs. Individual users may opt for single-user licenses, while businesses requiring broader access may choose multi-user or enterprise licenses for cost-effective access to the report.
13. Are there any additional resources or data provided in the Europe E-Brokerages Market report?
While the report offers comprehensive insights, it's advisable to review the specific contents or supplementary materials provided to ascertain if additional resources or data are available.
14. How can I stay updated on further developments or reports in the Europe E-Brokerages Market?
To stay informed about further developments, trends, and reports in the Europe E-Brokerages Market, consider subscribing to industry newsletters, following relevant companies and organizations, or regularly checking reputable industry news sources and publications.
Methodology
Step 1 - Identification of Relevant Samples Size from Population Database


Step 2 - Approaches for Defining Global Market Size (Value, Volume* & Price*)

Note*: In applicable scenarios
Step 3 - Data Sources
Primary Research
- Web Analytics
- Survey Reports
- Research Institute
- Latest Research Reports
- Opinion Leaders
Secondary Research
- Annual Reports
- White Paper
- Latest Press Release
- Industry Association
- Paid Database
- Investor Presentations

Step 4 - Data Triangulation
Involves using different sources of information in order to increase the validity of a study
These sources are likely to be stakeholders in a program - participants, other researchers, program staff, other community members, and so on.
Then we put all data in single framework & apply various statistical tools to find out the dynamic on the market.
During the analysis stage, feedback from the stakeholder groups would be compared to determine areas of agreement as well as areas of divergence