

Key Insights
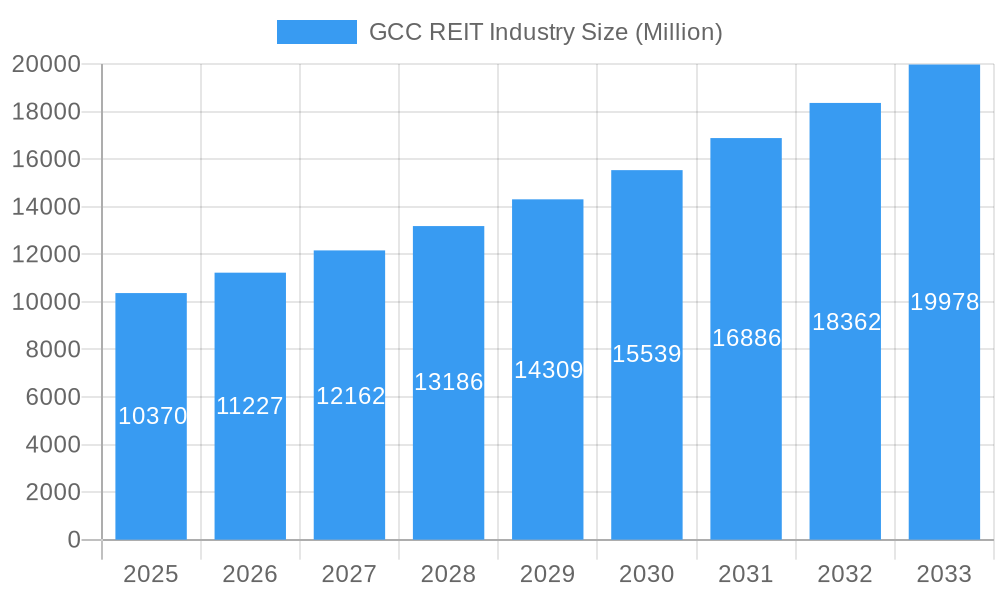
The GCC REIT (Real Estate Investment Trust) industry, valued at $10.37 billion in 2025, is experiencing robust growth, projected to expand at a compound annual growth rate (CAGR) of 8.24% from 2025 to 2033. This expansion is fueled by several key factors. Firstly, increasing urbanization and a burgeoning population across the Gulf Cooperation Council (GCC) nations are driving demand for commercial, residential, and mixed-use properties. Secondly, supportive government initiatives aimed at diversifying national economies and attracting foreign investment are creating a favorable regulatory environment for REITs. This includes policies promoting sustainable development and infrastructure projects. Thirdly, the growing appeal of REITs as a stable and relatively low-risk investment vehicle, particularly amongst institutional investors seeking diversification, is significantly contributing to market growth. Finally, the increasing adoption of technology in property management and the rise of PropTech are enhancing operational efficiencies and attracting new investors.
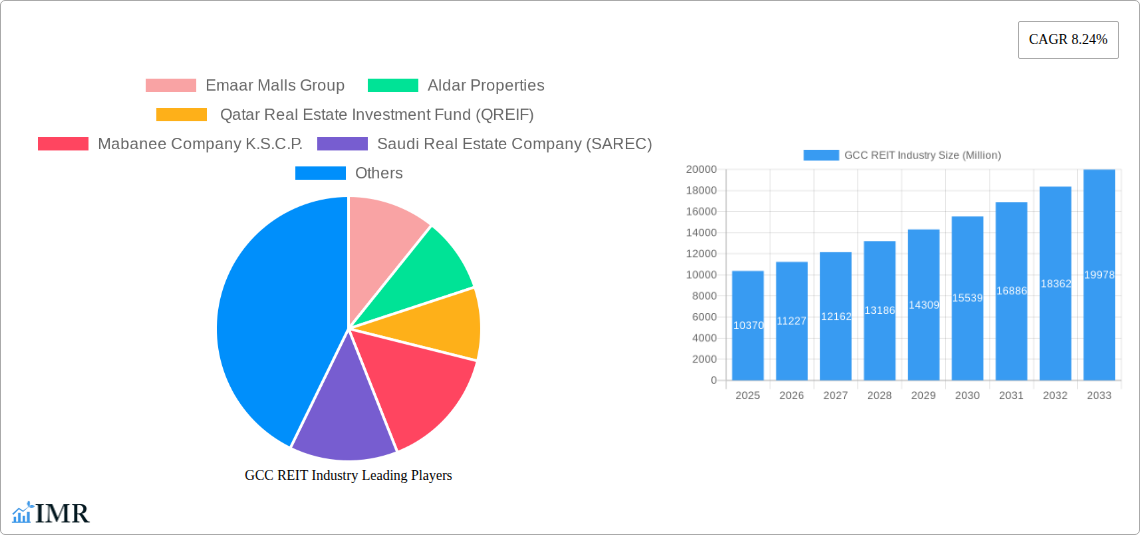
GCC REIT Industry Market Size (In Billion)
However, the market faces challenges. Potential fluctuations in oil prices, a key driver of GCC economies, could impact investor sentiment and construction activity. Moreover, competition from other investment classes and concerns regarding market volatility could limit growth in certain segments. Despite these headwinds, the long-term outlook for the GCC REIT industry remains positive, driven by strong fundamentals and a supportive macroeconomic environment. Diversification across property types, including a growing emphasis on sustainable and technologically advanced developments, is anticipated to fuel future growth within the sector. The dominance of Equity REITs is expected to continue, though Mortgage REITs will likely see increased activity, particularly in supporting the burgeoning construction sector. Leading players such as Emaar Malls Group and Aldar Properties are well-positioned to capitalize on these trends, shaping the future landscape of the GCC REIT market.
GCC REIT Industry Company Market Share
This in-depth report provides a comprehensive analysis of the GCC REIT industry, encompassing market dynamics, growth trends, key players, and future outlook. With a focus on the parent market of the GCC real estate sector and its child market of REITs, this report is an essential resource for industry professionals, investors, and strategic planners. The study period covers 2019-2033, with a base year of 2025 and a forecast period of 2025-2033. Market values are presented in millions.
GCC REIT Industry Market Dynamics & Structure
The GCC REIT market, while relatively young compared to mature markets, is experiencing rapid growth fueled by supportive government regulations and increasing institutional investment. Market concentration is currently moderate, with a few dominant players alongside numerous smaller REITs. Technological innovation, while present, faces barriers such as legacy systems and data integration challenges. The regulatory landscape is evolving, with countries like Saudi Arabia actively promoting REIT development. Competitive substitutes include direct real estate investment and other asset classes. End-user demographics are shifting towards a younger, more affluent population with growing demand for high-quality, diversified real estate investments. M&A activity is expected to increase as larger players consolidate their market share and seek economies of scale.
- Market Concentration: Moderate (xx% market share held by top 3 players in 2024)
- Technological Innovation Drivers: Digital property management systems, PropTech solutions
- Regulatory Frameworks: Varied across GCC countries, with recent supportive legislation in Saudi Arabia and the UAE.
- Competitive Product Substitutes: Direct property investment, private equity funds, bonds.
- End-User Demographics: Growing young, affluent population with increased investment appetite.
- M&A Trends: Increasing activity driven by consolidation and expansion strategies (xx deals in 2024).
GCC REIT Industry Growth Trends & Insights
The GCC REIT market is projected to experience significant growth over the forecast period (2025-2033), driven by factors such as increasing urbanization, government initiatives, and favorable economic conditions. The market size is expected to expand at a Compound Annual Growth Rate (CAGR) of xx% from 2025 to 2033, reaching a market value of xx Million by 2033. Adoption rates are increasing as awareness and understanding of REITs grow among investors. Technological disruptions, such as the use of blockchain for enhanced transparency and security, are also contributing to market growth. Shifting consumer behavior towards diversified, income-generating investments fuels the demand for REITs.
Dominant Regions, Countries, or Segments in GCC REIT Industry
The UAE and Saudi Arabia are currently the dominant markets within the GCC, driven by robust economic growth, supportive regulations, and a higher concentration of REIT listings. Within property types, Commercial REITs currently hold the largest market share, followed by Residential and Industrial & Logistics REITs. Equity REITs are significantly more prevalent than Mortgage REITs.
Key Drivers:
- UAE: Strong economic growth, advanced infrastructure, and established financial markets.
- Saudi Arabia: Recent policy reforms and introduction of a REIT regime.
- Commercial REITs: High demand for office and retail space in major cities.
- Equity REITs: Higher liquidity and easier access for investors.
Dominance Factors:
- Market size and growth potential.
- Number of listed REITs.
- Investor sentiment and capital flows.
GCC REIT Industry Product Landscape
The GCC REIT product landscape is characterized by a range of REITs focused on diverse property types, offering investors different risk-reward profiles and investment opportunities. Several REITs are incorporating sustainable practices and ESG (Environmental, Social, and Governance) factors into their investment strategies, attracting environmentally conscious investors. Technological advancements are enhancing operational efficiency and transparency within the industry.
Key Drivers, Barriers & Challenges in GCC REIT Industry
Key Drivers: Supportive government policies, increasing institutional investment, strong economic growth in the region, and the development of sophisticated financial markets. The establishment of new REITs is a strong driving force.
Key Challenges: Limited historical data on REIT performance, relatively low awareness among retail investors, and potential regulatory uncertainties. Liquidity remains a factor in some smaller markets.
Emerging Opportunities in GCC REIT Industry
Emerging opportunities lie in expanding into underserved segments, such as healthcare and hospitality REITs, and leveraging technology to enhance operational efficiency and investor relations. The growing focus on sustainability presents opportunities for green REITs. Expanding into secondary cities within the GCC offers considerable growth potential.
Growth Accelerators in the GCC REIT Industry
Long-term growth will be accelerated by further regulatory reforms, increased investor education, and the adoption of innovative technologies. Strategic partnerships between developers and REIT managers can further accelerate growth.
Key Players Shaping the GCC REIT Industry Market
- Emaar Malls Group
- Aldar Properties
- Qatar Real Estate Investment Fund (QREIF)
- Mabanee Company K.S.C.P.
- Saudi Real Estate Company (SAREC)
- Mall of Oman
- National Real Estate Company (NREC)
Notable Milestones in GCC REIT Industry Sector
- November 2016: Riyad REIT, the first REIT listed in Saudi Arabia.
- January 2021: Dubai Financial Market (DFM) begins trading in REITs.
- September 2022: Saudi Arabia introduces a formal REIT regime.
In-Depth GCC REIT Industry Market Outlook
The GCC REIT market is poised for substantial growth over the next decade. Continued government support, increasing institutional and retail investment, and technological advancements will drive market expansion. Strategic partnerships and diversification into new sectors will further enhance market potential, making the GCC a key regional hub for REIT investment.
GCC REIT Industry Segmentation
- 1. Production Analysis
- 2. Consumption Analysis
- 3. Import Market Analysis (Value & Volume)
- 4. Export Market Analysis (Value & Volume)
- 5. Price Trend Analysis
GCC REIT Industry Segmentation By Geography
-
1. North America
- 1.1. United States
- 1.2. Canada
- 1.3. Mexico
-
2. South America
- 2.1. Brazil
- 2.2. Argentina
- 2.3. Rest of South America
-
3. Europe
- 3.1. United Kingdom
- 3.2. Germany
- 3.3. France
- 3.4. Italy
- 3.5. Spain
- 3.6. Russia
- 3.7. Benelux
- 3.8. Nordics
- 3.9. Rest of Europe
-
4. Middle East & Africa
- 4.1. Turkey
- 4.2. Israel
- 4.3. GCC
- 4.4. North Africa
- 4.5. South Africa
- 4.6. Rest of Middle East & Africa
-
5. Asia Pacific
- 5.1. China
- 5.2. India
- 5.3. Japan
- 5.4. South Korea
- 5.5. ASEAN
- 5.6. Oceania
- 5.7. Rest of Asia Pacific
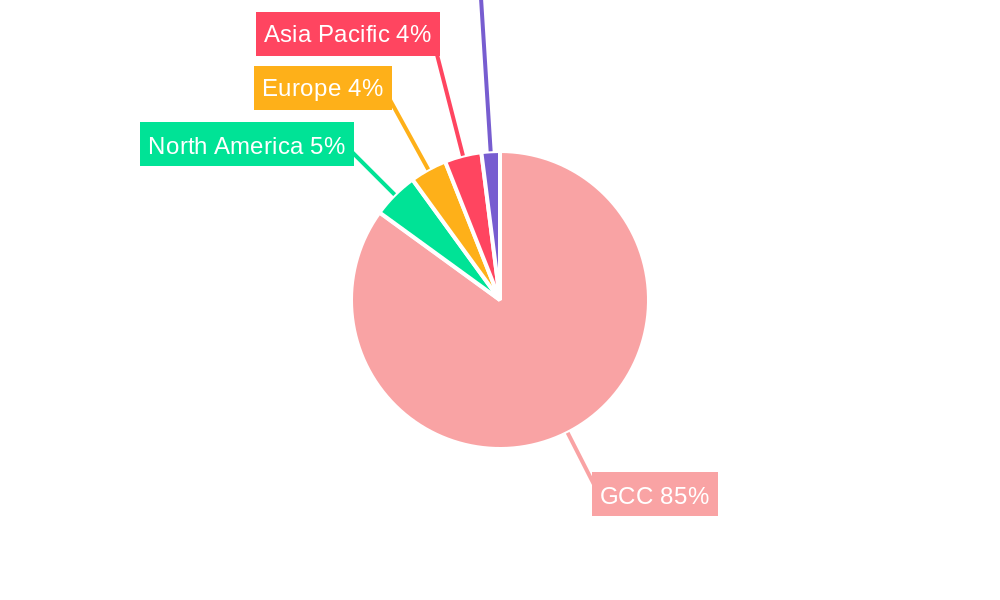
GCC REIT Industry Regional Market Share
Geographic Coverage of GCC REIT Industry
GCC REIT Industry REPORT HIGHLIGHTS
| Aspects | Details |
|---|---|
| Study Period | 2020-2034 |
| Base Year | 2025 |
| Estimated Year | 2026 |
| Forecast Period | 2026-2034 |
| Historical Period | 2020-2025 |
| Growth Rate | CAGR of 8.24% from 2020-2034 |
| Segmentation |
|
Table of Contents
- 1. Introduction
- 1.1. Research Scope
- 1.2. Market Segmentation
- 1.3. Research Objective
- 1.4. Definitions and Assumptions
- 2. Executive Summary
- 2.1. Market Snapshot
- 3. Market Dynamics
- 3.1. Market Drivers
- 3.2. Market Restrains
- 3.3. Market Trends
- 3.4. Market Opportunities
- 4. Market Factor Analysis
- 4.1. Porters Five Forces
- 4.1.1. Bargaining Power of Suppliers
- 4.1.2. Bargaining Power of Buyers
- 4.1.3. Threat of New Entrants
- 4.1.4. Threat of Substitutes
- 4.1.5. Competitive Rivalry
- 4.2. PESTEL analysis
- 4.3. BCG Analysis
- 4.3.1. Stars (High Growth, High Market Share)
- 4.3.2. Cash Cows (Low Growth, High Market Share)
- 4.3.3. Question Mark (High Growth, Low Market Share)
- 4.3.4. Dogs (Low Growth, Low Market Share)
- 4.4. Ansoff Matrix Analysis
- 4.5. Supply Chain Analysis
- 4.6. Regulatory Landscape
- 4.7. Current Market Potential and Opportunity Assessment (TAM–SAM–SOM Framework)
- 4.8. IMR Analyst Note
- 4.1. Porters Five Forces
- 5. Market Analysis, Insights and Forecast 2021-2033
- 5.1. Market Analysis, Insights and Forecast - by Production Analysis
- 5.2. Market Analysis, Insights and Forecast - by Consumption Analysis
- 5.3. Market Analysis, Insights and Forecast - by Import Market Analysis (Value & Volume)
- 5.4. Market Analysis, Insights and Forecast - by Export Market Analysis (Value & Volume)
- 5.5. Market Analysis, Insights and Forecast - by Price Trend Analysis
- 5.6. Market Analysis, Insights and Forecast - by Region
- 5.6.1. North America
- 5.6.2. South America
- 5.6.3. Europe
- 5.6.4. Middle East & Africa
- 5.6.5. Asia Pacific
- 6. Global GCC REIT Industry Analysis, Insights and Forecast, 2021-2033
- 6.1. Market Analysis, Insights and Forecast - by Production Analysis
- 6.2. Market Analysis, Insights and Forecast - by Consumption Analysis
- 6.3. Market Analysis, Insights and Forecast - by Import Market Analysis (Value & Volume)
- 6.4. Market Analysis, Insights and Forecast - by Export Market Analysis (Value & Volume)
- 6.5. Market Analysis, Insights and Forecast - by Price Trend Analysis
- 7. North America GCC REIT Industry Analysis, Insights and Forecast, 2020-2032
- 7.1. Market Analysis, Insights and Forecast - by Production Analysis
- 7.2. Market Analysis, Insights and Forecast - by Consumption Analysis
- 7.3. Market Analysis, Insights and Forecast - by Import Market Analysis (Value & Volume)
- 7.4. Market Analysis, Insights and Forecast - by Export Market Analysis (Value & Volume)
- 7.5. Market Analysis, Insights and Forecast - by Price Trend Analysis
- 8. South America GCC REIT Industry Analysis, Insights and Forecast, 2020-2032
- 8.1. Market Analysis, Insights and Forecast - by Production Analysis
- 8.2. Market Analysis, Insights and Forecast - by Consumption Analysis
- 8.3. Market Analysis, Insights and Forecast - by Import Market Analysis (Value & Volume)
- 8.4. Market Analysis, Insights and Forecast - by Export Market Analysis (Value & Volume)
- 8.5. Market Analysis, Insights and Forecast - by Price Trend Analysis
- 9. Europe GCC REIT Industry Analysis, Insights and Forecast, 2020-2032
- 9.1. Market Analysis, Insights and Forecast - by Production Analysis
- 9.2. Market Analysis, Insights and Forecast - by Consumption Analysis
- 9.3. Market Analysis, Insights and Forecast - by Import Market Analysis (Value & Volume)
- 9.4. Market Analysis, Insights and Forecast - by Export Market Analysis (Value & Volume)
- 9.5. Market Analysis, Insights and Forecast - by Price Trend Analysis
- 10. Middle East & Africa GCC REIT Industry Analysis, Insights and Forecast, 2020-2032
- 10.1. Market Analysis, Insights and Forecast - by Production Analysis
- 10.2. Market Analysis, Insights and Forecast - by Consumption Analysis
- 10.3. Market Analysis, Insights and Forecast - by Import Market Analysis (Value & Volume)
- 10.4. Market Analysis, Insights and Forecast - by Export Market Analysis (Value & Volume)
- 10.5. Market Analysis, Insights and Forecast - by Price Trend Analysis
- 11. Asia Pacific GCC REIT Industry Analysis, Insights and Forecast, 2020-2032
- 11.1. Market Analysis, Insights and Forecast - by Production Analysis
- 11.2. Market Analysis, Insights and Forecast - by Consumption Analysis
- 11.3. Market Analysis, Insights and Forecast - by Import Market Analysis (Value & Volume)
- 11.4. Market Analysis, Insights and Forecast - by Export Market Analysis (Value & Volume)
- 11.5. Market Analysis, Insights and Forecast - by Price Trend Analysis
- 12. Competitive Analysis
- 12.1. Company Profiles
- 12.1.1 Emaar Malls Group
- 12.1.1.1. Company Overview
- 12.1.1.2. Products
- 12.1.1.3. Company Financials
- 12.1.1.4. SWOT Analysis
- 12.1.2 Aldar Properties
- 12.1.2.1. Company Overview
- 12.1.2.2. Products
- 12.1.2.3. Company Financials
- 12.1.2.4. SWOT Analysis
- 12.1.3 Qatar Real Estate Investment Fund (QREIF)
- 12.1.3.1. Company Overview
- 12.1.3.2. Products
- 12.1.3.3. Company Financials
- 12.1.3.4. SWOT Analysis
- 12.1.4 Mabanee Company K.S.C.P.
- 12.1.4.1. Company Overview
- 12.1.4.2. Products
- 12.1.4.3. Company Financials
- 12.1.4.4. SWOT Analysis
- 12.1.5 Saudi Real Estate Company (SAREC)
- 12.1.5.1. Company Overview
- 12.1.5.2. Products
- 12.1.5.3. Company Financials
- 12.1.5.4. SWOT Analysis
- 12.1.6 Mall of Oman
- 12.1.6.1. Company Overview
- 12.1.6.2. Products
- 12.1.6.3. Company Financials
- 12.1.6.4. SWOT Analysis
- 12.1.7 National Real Estate Company (NREC)
- 12.1.7.1. Company Overview
- 12.1.7.2. Products
- 12.1.7.3. Company Financials
- 12.1.7.4. SWOT Analysis
- 12.1.1 Emaar Malls Group
- 12.2. Market Entropy
- 12.2.1 Company's Key Areas Served
- 12.2.2 Recent Developments
- 12.3. Company Market Share Analysis 2025
- 12.3.1 Top 5 Companies Market Share Analysis
- 12.3.2 Top 3 Companies Market Share Analysis
- 12.4. List of Potential Customers
- 13. Research Methodology
List of Figures
- Figure 1: Global GCC REIT Industry Revenue Breakdown (Million, %) by Region 2025 & 2033
- Figure 2: North America GCC REIT Industry Revenue (Million), by Production Analysis 2025 & 2033
- Figure 3: North America GCC REIT Industry Revenue Share (%), by Production Analysis 2025 & 2033
- Figure 4: North America GCC REIT Industry Revenue (Million), by Consumption Analysis 2025 & 2033
- Figure 5: North America GCC REIT Industry Revenue Share (%), by Consumption Analysis 2025 & 2033
- Figure 6: North America GCC REIT Industry Revenue (Million), by Import Market Analysis (Value & Volume) 2025 & 2033
- Figure 7: North America GCC REIT Industry Revenue Share (%), by Import Market Analysis (Value & Volume) 2025 & 2033
- Figure 8: North America GCC REIT Industry Revenue (Million), by Export Market Analysis (Value & Volume) 2025 & 2033
- Figure 9: North America GCC REIT Industry Revenue Share (%), by Export Market Analysis (Value & Volume) 2025 & 2033
- Figure 10: North America GCC REIT Industry Revenue (Million), by Price Trend Analysis 2025 & 2033
- Figure 11: North America GCC REIT Industry Revenue Share (%), by Price Trend Analysis 2025 & 2033
- Figure 12: North America GCC REIT Industry Revenue (Million), by Country 2025 & 2033
- Figure 13: North America GCC REIT Industry Revenue Share (%), by Country 2025 & 2033
- Figure 14: South America GCC REIT Industry Revenue (Million), by Production Analysis 2025 & 2033
- Figure 15: South America GCC REIT Industry Revenue Share (%), by Production Analysis 2025 & 2033
- Figure 16: South America GCC REIT Industry Revenue (Million), by Consumption Analysis 2025 & 2033
- Figure 17: South America GCC REIT Industry Revenue Share (%), by Consumption Analysis 2025 & 2033
- Figure 18: South America GCC REIT Industry Revenue (Million), by Import Market Analysis (Value & Volume) 2025 & 2033
- Figure 19: South America GCC REIT Industry Revenue Share (%), by Import Market Analysis (Value & Volume) 2025 & 2033
- Figure 20: South America GCC REIT Industry Revenue (Million), by Export Market Analysis (Value & Volume) 2025 & 2033
- Figure 21: South America GCC REIT Industry Revenue Share (%), by Export Market Analysis (Value & Volume) 2025 & 2033
- Figure 22: South America GCC REIT Industry Revenue (Million), by Price Trend Analysis 2025 & 2033
- Figure 23: South America GCC REIT Industry Revenue Share (%), by Price Trend Analysis 2025 & 2033
- Figure 24: South America GCC REIT Industry Revenue (Million), by Country 2025 & 2033
- Figure 25: South America GCC REIT Industry Revenue Share (%), by Country 2025 & 2033
- Figure 26: Europe GCC REIT Industry Revenue (Million), by Production Analysis 2025 & 2033
- Figure 27: Europe GCC REIT Industry Revenue Share (%), by Production Analysis 2025 & 2033
- Figure 28: Europe GCC REIT Industry Revenue (Million), by Consumption Analysis 2025 & 2033
- Figure 29: Europe GCC REIT Industry Revenue Share (%), by Consumption Analysis 2025 & 2033
- Figure 30: Europe GCC REIT Industry Revenue (Million), by Import Market Analysis (Value & Volume) 2025 & 2033
- Figure 31: Europe GCC REIT Industry Revenue Share (%), by Import Market Analysis (Value & Volume) 2025 & 2033
- Figure 32: Europe GCC REIT Industry Revenue (Million), by Export Market Analysis (Value & Volume) 2025 & 2033
- Figure 33: Europe GCC REIT Industry Revenue Share (%), by Export Market Analysis (Value & Volume) 2025 & 2033
- Figure 34: Europe GCC REIT Industry Revenue (Million), by Price Trend Analysis 2025 & 2033
- Figure 35: Europe GCC REIT Industry Revenue Share (%), by Price Trend Analysis 2025 & 2033
- Figure 36: Europe GCC REIT Industry Revenue (Million), by Country 2025 & 2033
- Figure 37: Europe GCC REIT Industry Revenue Share (%), by Country 2025 & 2033
- Figure 38: Middle East & Africa GCC REIT Industry Revenue (Million), by Production Analysis 2025 & 2033
- Figure 39: Middle East & Africa GCC REIT Industry Revenue Share (%), by Production Analysis 2025 & 2033
- Figure 40: Middle East & Africa GCC REIT Industry Revenue (Million), by Consumption Analysis 2025 & 2033
- Figure 41: Middle East & Africa GCC REIT Industry Revenue Share (%), by Consumption Analysis 2025 & 2033
- Figure 42: Middle East & Africa GCC REIT Industry Revenue (Million), by Import Market Analysis (Value & Volume) 2025 & 2033
- Figure 43: Middle East & Africa GCC REIT Industry Revenue Share (%), by Import Market Analysis (Value & Volume) 2025 & 2033
- Figure 44: Middle East & Africa GCC REIT Industry Revenue (Million), by Export Market Analysis (Value & Volume) 2025 & 2033
- Figure 45: Middle East & Africa GCC REIT Industry Revenue Share (%), by Export Market Analysis (Value & Volume) 2025 & 2033
- Figure 46: Middle East & Africa GCC REIT Industry Revenue (Million), by Price Trend Analysis 2025 & 2033
- Figure 47: Middle East & Africa GCC REIT Industry Revenue Share (%), by Price Trend Analysis 2025 & 2033
- Figure 48: Middle East & Africa GCC REIT Industry Revenue (Million), by Country 2025 & 2033
- Figure 49: Middle East & Africa GCC REIT Industry Revenue Share (%), by Country 2025 & 2033
- Figure 50: Asia Pacific GCC REIT Industry Revenue (Million), by Production Analysis 2025 & 2033
- Figure 51: Asia Pacific GCC REIT Industry Revenue Share (%), by Production Analysis 2025 & 2033
- Figure 52: Asia Pacific GCC REIT Industry Revenue (Million), by Consumption Analysis 2025 & 2033
- Figure 53: Asia Pacific GCC REIT Industry Revenue Share (%), by Consumption Analysis 2025 & 2033
- Figure 54: Asia Pacific GCC REIT Industry Revenue (Million), by Import Market Analysis (Value & Volume) 2025 & 2033
- Figure 55: Asia Pacific GCC REIT Industry Revenue Share (%), by Import Market Analysis (Value & Volume) 2025 & 2033
- Figure 56: Asia Pacific GCC REIT Industry Revenue (Million), by Export Market Analysis (Value & Volume) 2025 & 2033
- Figure 57: Asia Pacific GCC REIT Industry Revenue Share (%), by Export Market Analysis (Value & Volume) 2025 & 2033
- Figure 58: Asia Pacific GCC REIT Industry Revenue (Million), by Price Trend Analysis 2025 & 2033
- Figure 59: Asia Pacific GCC REIT Industry Revenue Share (%), by Price Trend Analysis 2025 & 2033
- Figure 60: Asia Pacific GCC REIT Industry Revenue (Million), by Country 2025 & 2033
- Figure 61: Asia Pacific GCC REIT Industry Revenue Share (%), by Country 2025 & 2033
List of Tables
- Table 1: Global GCC REIT Industry Revenue Million Forecast, by Production Analysis 2020 & 2033
- Table 2: Global GCC REIT Industry Revenue Million Forecast, by Consumption Analysis 2020 & 2033
- Table 3: Global GCC REIT Industry Revenue Million Forecast, by Import Market Analysis (Value & Volume) 2020 & 2033
- Table 4: Global GCC REIT Industry Revenue Million Forecast, by Export Market Analysis (Value & Volume) 2020 & 2033
- Table 5: Global GCC REIT Industry Revenue Million Forecast, by Price Trend Analysis 2020 & 2033
- Table 6: Global GCC REIT Industry Revenue Million Forecast, by Region 2020 & 2033
- Table 7: Global GCC REIT Industry Revenue Million Forecast, by Production Analysis 2020 & 2033
- Table 8: Global GCC REIT Industry Revenue Million Forecast, by Consumption Analysis 2020 & 2033
- Table 9: Global GCC REIT Industry Revenue Million Forecast, by Import Market Analysis (Value & Volume) 2020 & 2033
- Table 10: Global GCC REIT Industry Revenue Million Forecast, by Export Market Analysis (Value & Volume) 2020 & 2033
- Table 11: Global GCC REIT Industry Revenue Million Forecast, by Price Trend Analysis 2020 & 2033
- Table 12: Global GCC REIT Industry Revenue Million Forecast, by Country 2020 & 2033
- Table 13: United States GCC REIT Industry Revenue (Million) Forecast, by Application 2020 & 2033
- Table 14: Canada GCC REIT Industry Revenue (Million) Forecast, by Application 2020 & 2033
- Table 15: Mexico GCC REIT Industry Revenue (Million) Forecast, by Application 2020 & 2033
- Table 16: Global GCC REIT Industry Revenue Million Forecast, by Production Analysis 2020 & 2033
- Table 17: Global GCC REIT Industry Revenue Million Forecast, by Consumption Analysis 2020 & 2033
- Table 18: Global GCC REIT Industry Revenue Million Forecast, by Import Market Analysis (Value & Volume) 2020 & 2033
- Table 19: Global GCC REIT Industry Revenue Million Forecast, by Export Market Analysis (Value & Volume) 2020 & 2033
- Table 20: Global GCC REIT Industry Revenue Million Forecast, by Price Trend Analysis 2020 & 2033
- Table 21: Global GCC REIT Industry Revenue Million Forecast, by Country 2020 & 2033
- Table 22: Brazil GCC REIT Industry Revenue (Million) Forecast, by Application 2020 & 2033
- Table 23: Argentina GCC REIT Industry Revenue (Million) Forecast, by Application 2020 & 2033
- Table 24: Rest of South America GCC REIT Industry Revenue (Million) Forecast, by Application 2020 & 2033
- Table 25: Global GCC REIT Industry Revenue Million Forecast, by Production Analysis 2020 & 2033
- Table 26: Global GCC REIT Industry Revenue Million Forecast, by Consumption Analysis 2020 & 2033
- Table 27: Global GCC REIT Industry Revenue Million Forecast, by Import Market Analysis (Value & Volume) 2020 & 2033
- Table 28: Global GCC REIT Industry Revenue Million Forecast, by Export Market Analysis (Value & Volume) 2020 & 2033
- Table 29: Global GCC REIT Industry Revenue Million Forecast, by Price Trend Analysis 2020 & 2033
- Table 30: Global GCC REIT Industry Revenue Million Forecast, by Country 2020 & 2033
- Table 31: United Kingdom GCC REIT Industry Revenue (Million) Forecast, by Application 2020 & 2033
- Table 32: Germany GCC REIT Industry Revenue (Million) Forecast, by Application 2020 & 2033
- Table 33: France GCC REIT Industry Revenue (Million) Forecast, by Application 2020 & 2033
- Table 34: Italy GCC REIT Industry Revenue (Million) Forecast, by Application 2020 & 2033
- Table 35: Spain GCC REIT Industry Revenue (Million) Forecast, by Application 2020 & 2033
- Table 36: Russia GCC REIT Industry Revenue (Million) Forecast, by Application 2020 & 2033
- Table 37: Benelux GCC REIT Industry Revenue (Million) Forecast, by Application 2020 & 2033
- Table 38: Nordics GCC REIT Industry Revenue (Million) Forecast, by Application 2020 & 2033
- Table 39: Rest of Europe GCC REIT Industry Revenue (Million) Forecast, by Application 2020 & 2033
- Table 40: Global GCC REIT Industry Revenue Million Forecast, by Production Analysis 2020 & 2033
- Table 41: Global GCC REIT Industry Revenue Million Forecast, by Consumption Analysis 2020 & 2033
- Table 42: Global GCC REIT Industry Revenue Million Forecast, by Import Market Analysis (Value & Volume) 2020 & 2033
- Table 43: Global GCC REIT Industry Revenue Million Forecast, by Export Market Analysis (Value & Volume) 2020 & 2033
- Table 44: Global GCC REIT Industry Revenue Million Forecast, by Price Trend Analysis 2020 & 2033
- Table 45: Global GCC REIT Industry Revenue Million Forecast, by Country 2020 & 2033
- Table 46: Turkey GCC REIT Industry Revenue (Million) Forecast, by Application 2020 & 2033
- Table 47: Israel GCC REIT Industry Revenue (Million) Forecast, by Application 2020 & 2033
- Table 48: GCC GCC REIT Industry Revenue (Million) Forecast, by Application 2020 & 2033
- Table 49: North Africa GCC REIT Industry Revenue (Million) Forecast, by Application 2020 & 2033
- Table 50: South Africa GCC REIT Industry Revenue (Million) Forecast, by Application 2020 & 2033
- Table 51: Rest of Middle East & Africa GCC REIT Industry Revenue (Million) Forecast, by Application 2020 & 2033
- Table 52: Global GCC REIT Industry Revenue Million Forecast, by Production Analysis 2020 & 2033
- Table 53: Global GCC REIT Industry Revenue Million Forecast, by Consumption Analysis 2020 & 2033
- Table 54: Global GCC REIT Industry Revenue Million Forecast, by Import Market Analysis (Value & Volume) 2020 & 2033
- Table 55: Global GCC REIT Industry Revenue Million Forecast, by Export Market Analysis (Value & Volume) 2020 & 2033
- Table 56: Global GCC REIT Industry Revenue Million Forecast, by Price Trend Analysis 2020 & 2033
- Table 57: Global GCC REIT Industry Revenue Million Forecast, by Country 2020 & 2033
- Table 58: China GCC REIT Industry Revenue (Million) Forecast, by Application 2020 & 2033
- Table 59: India GCC REIT Industry Revenue (Million) Forecast, by Application 2020 & 2033
- Table 60: Japan GCC REIT Industry Revenue (Million) Forecast, by Application 2020 & 2033
- Table 61: South Korea GCC REIT Industry Revenue (Million) Forecast, by Application 2020 & 2033
- Table 62: ASEAN GCC REIT Industry Revenue (Million) Forecast, by Application 2020 & 2033
- Table 63: Oceania GCC REIT Industry Revenue (Million) Forecast, by Application 2020 & 2033
- Table 64: Rest of Asia Pacific GCC REIT Industry Revenue (Million) Forecast, by Application 2020 & 2033
Frequently Asked Questions
1. What is the projected Compound Annual Growth Rate (CAGR) of the GCC REIT Industry?
The projected CAGR is approximately 8.24%.
2. Which companies are prominent players in the GCC REIT Industry?
Key companies in the market include Emaar Malls Group , Aldar Properties , Qatar Real Estate Investment Fund (QREIF) , Mabanee Company K.S.C.P., Saudi Real Estate Company (SAREC) , Mall of Oman , National Real Estate Company (NREC) .
3. What are the main segments of the GCC REIT Industry?
The market segments include Production Analysis, Consumption Analysis, Import Market Analysis (Value & Volume), Export Market Analysis (Value & Volume), Price Trend Analysis.
4. Can you provide details about the market size?
The market size is estimated to be USD 10.37 Million as of 2022.
5. What are some drivers contributing to market growth?
Fund Inflows is Driving the ETF Market.
6. What are the notable trends driving market growth?
Growing Asset Allocation to Real Estate by Large Investors in The Region.
7. Are there any restraints impacting market growth?
Underlying Fluctuations and Risks are Restraining the Market.
8. Can you provide examples of recent developments in the market?
In September 2022, Saudi Arabia introduced a real estate investment trust (REIT) regime. In November 2016, Riyad REIT was the first REIT to be listed in Saudi Arabia (and only the second REIT to be listed in the Middle East), which was followed by another 17 REITs up to July 2022, with a number of them also increasing their capital to acquire additional assets.
9. What pricing options are available for accessing the report?
Pricing options include single-user, multi-user, and enterprise licenses priced at USD 3800, USD 4500, and USD 5800 respectively.
10. Is the market size provided in terms of value or volume?
The market size is provided in terms of value, measured in Million.
11. Are there any specific market keywords associated with the report?
Yes, the market keyword associated with the report is "GCC REIT Industry," which aids in identifying and referencing the specific market segment covered.
12. How do I determine which pricing option suits my needs best?
The pricing options vary based on user requirements and access needs. Individual users may opt for single-user licenses, while businesses requiring broader access may choose multi-user or enterprise licenses for cost-effective access to the report.
13. Are there any additional resources or data provided in the GCC REIT Industry report?
While the report offers comprehensive insights, it's advisable to review the specific contents or supplementary materials provided to ascertain if additional resources or data are available.
14. How can I stay updated on further developments or reports in the GCC REIT Industry?
To stay informed about further developments, trends, and reports in the GCC REIT Industry, consider subscribing to industry newsletters, following relevant companies and organizations, or regularly checking reputable industry news sources and publications.
Methodology
Step 1 - Identification of Relevant Samples Size from Population Database


Step 2 - Approaches for Defining Global Market Size (Value, Volume* & Price*)

Note*: In applicable scenarios
Step 3 - Data Sources
Primary Research
- Web Analytics
- Survey Reports
- Research Institute
- Latest Research Reports
- Opinion Leaders
Secondary Research
- Annual Reports
- White Paper
- Latest Press Release
- Industry Association
- Paid Database
- Investor Presentations

Step 4 - Data Triangulation
Involves using different sources of information in order to increase the validity of a study
These sources are likely to be stakeholders in a program - participants, other researchers, program staff, other community members, and so on.
Then we put all data in single framework & apply various statistical tools to find out the dynamic on the market.
During the analysis stage, feedback from the stakeholder groups would be compared to determine areas of agreement as well as areas of divergence