

Key Insights
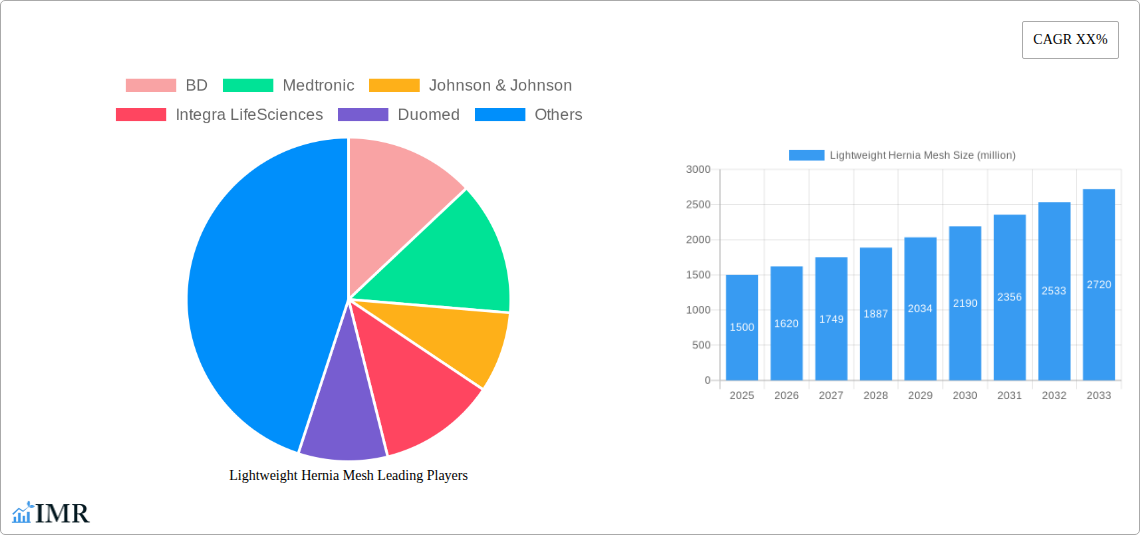
The lightweight hernia mesh market is experiencing robust growth, driven by a rising global prevalence of hernias, advancements in mesh technology leading to improved patient outcomes, and a growing preference for minimally invasive surgical procedures. The market's Compound Annual Growth Rate (CAGR) is estimated to be around 8% between 2025 and 2033, indicating a significant expansion opportunity. Key drivers include the increasing geriatric population, a rise in obesity rates contributing to hernia development, and the growing demand for less invasive surgical techniques that minimize post-operative complications and recovery time. This has led to the development of innovative lightweight meshes with enhanced biocompatibility, reduced inflammation, and improved integration with surrounding tissues. Leading players like BD, Medtronic, Johnson & Johnson, and Integra LifeSciences are actively engaged in research and development, further fueling market expansion through product diversification and strategic partnerships.
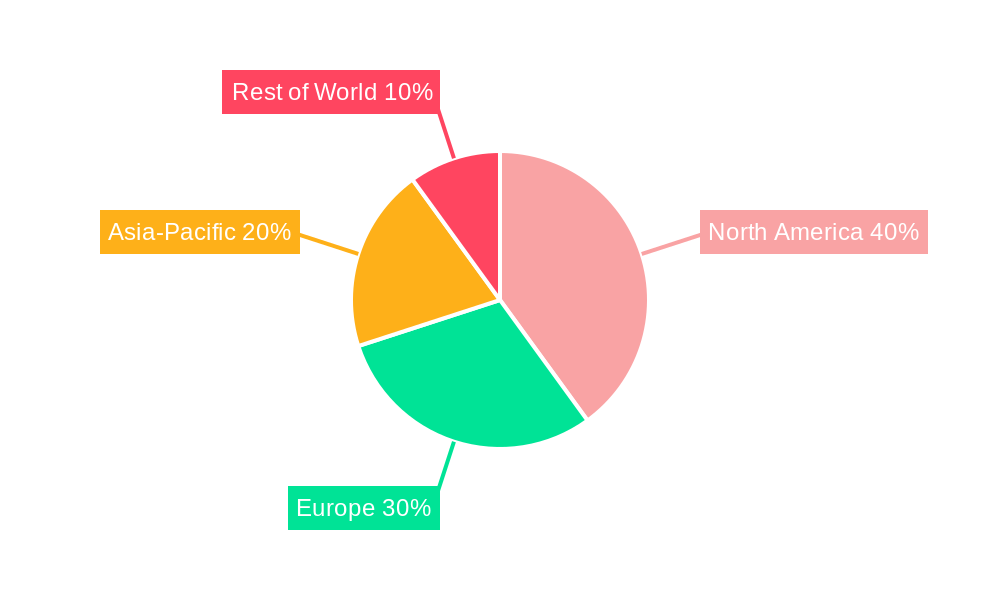
Despite the positive growth trajectory, certain challenges remain. These include the potential for complications like infection and recurrence, the high cost of advanced mesh technologies, and the ongoing debate regarding the long-term safety and efficacy of certain materials. However, stringent regulatory approvals and increasing awareness among healthcare professionals about the benefits of lightweight meshes are anticipated to mitigate these restraints. The market is segmented by type of mesh (e.g., polypropylene, polyester, composite), application (inguinal, ventral, incisional), and end-user (hospitals, ambulatory surgical centers). Regional variations exist, with North America and Europe currently holding significant market shares, while developing economies in Asia-Pacific and Latin America are poised for substantial growth in the coming years due to rising healthcare expenditure and increased awareness of hernia treatment options.
Lightweight Hernia Mesh Market Report: 2019-2033
This comprehensive report provides an in-depth analysis of the lightweight hernia mesh market, encompassing market dynamics, growth trends, regional performance, product landscape, key players, and future outlook. The study period spans from 2019 to 2033, with 2025 serving as the base and estimated year. The forecast period covers 2025-2033, and the historical period encompasses 2019-2024. This report is crucial for medical device manufacturers, healthcare providers, investors, and researchers seeking to understand and capitalize on this dynamic market. The market is expected to reach xx million units by 2033.
Lightweight Hernia Mesh Market Dynamics & Structure
The lightweight hernia mesh market exhibits a moderately consolidated structure, with key players such as BD, Medtronic, Johnson & Johnson, and Integra LifeSciences holding significant market share. Technological innovation, particularly in biocompatible materials and minimally invasive surgical techniques, are primary growth drivers. Stringent regulatory frameworks, including those enforced by the FDA and equivalent global bodies, influence product development and market entry. Competitive pressure from substitute materials and evolving end-user demographics (aging population, rising incidence of hernia) further shape market dynamics. Mergers and acquisitions (M&A) activity has been moderate, with xx deals recorded between 2019 and 2024, primarily focused on expanding product portfolios and geographical reach.
- Market Concentration: Highly concentrated, with top 5 players holding approximately xx% market share in 2024.
- Innovation Drivers: Biocompatible polymers, minimally invasive surgery techniques, smart mesh technologies.
- Regulatory Landscape: Stringent FDA/equivalent international regulations impacting product approval and safety standards.
- Competitive Substitutes: Traditional hernia repair techniques, alternative mesh materials.
- End-User Demographics: Aging global population, increasing hernia prevalence driving demand.
- M&A Activity: Moderate level, focusing on portfolio expansion and geographic reach (xx deals, 2019-2024).
Lightweight Hernia Mesh Growth Trends & Insights
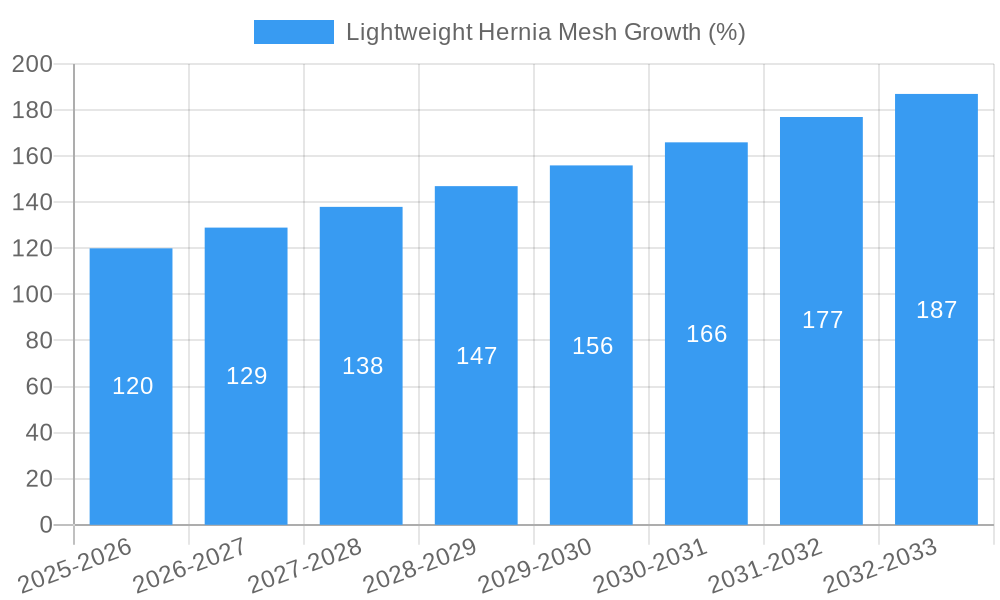
The lightweight hernia mesh market experienced significant growth during the historical period (2019-2024), fueled by increasing hernia prevalence, advancements in surgical techniques, and the adoption of minimally invasive procedures. The market size is estimated at xx million units in 2025, exhibiting a CAGR of xx% during the forecast period (2025-2033). Market penetration has been influenced by factors such as healthcare infrastructure development, surgeon preference, and patient awareness. Technological disruptions, such as the introduction of bioabsorbable meshes and smart meshes with real-time monitoring capabilities, are expected to reshape the market landscape and drive further growth. Shifts in consumer behavior, including a preference for less invasive procedures with faster recovery times, are also impacting market dynamics.
Dominant Regions, Countries, or Segments in Lightweight Hernia Mesh
North America currently holds the largest market share in lightweight hernia mesh, driven by high healthcare expenditure, advanced surgical infrastructure, and a large aging population. Europe follows as a significant market, while the Asia-Pacific region demonstrates substantial growth potential due to rising healthcare awareness, economic development, and increasing surgical procedures. The inguinal hernia segment dominates the market due to its high prevalence, followed by ventral and incisional hernia segments.
- North America: High healthcare spending, advanced infrastructure, and large aging population drive market dominance.
- Europe: Significant market share, driven by healthcare investment and established surgical practices.
- Asia-Pacific: High growth potential due to rising healthcare awareness, economic growth, and expanding surgical infrastructure.
- Inguinal Hernia Segment: Dominates due to high prevalence.
- Ventral and Incisional Hernia Segments: Significant and growing market segments.
Lightweight Hernia Mesh Product Landscape
Lightweight hernia meshes are designed for minimally invasive surgical procedures, offering advantages such as reduced tissue trauma, faster recovery times, and improved patient outcomes. Product innovations focus on biocompatibility, strength, and ease of deployment. Key performance metrics include tensile strength, biodegradation rate (for bioabsorbable meshes), and infection rates. Unique selling propositions often center around specific material properties, design features that minimize complications, and improved surgical workflow.
Key Drivers, Barriers & Challenges in Lightweight Hernia Mesh
Key Drivers:
- Growing prevalence of hernias globally.
- Advancements in minimally invasive surgical techniques (laparoscopy).
- Increasing adoption of lightweight meshes due to improved patient outcomes.
- Technological advancements in biocompatible materials and mesh design.
Challenges and Restraints:
- High cost of advanced lightweight mesh technologies, limiting accessibility in certain regions.
- Potential complications associated with mesh implantation (e.g., infection, recurrence).
- Stringent regulatory approvals and reimbursement policies in various countries impacting market entry.
- Competition from alternative treatment methods (e.g., open surgery).
Emerging Opportunities in Lightweight Hernia Mesh
- Untapped markets in developing economies with increasing healthcare awareness.
- Development of bioabsorbable and smart meshes with integrated sensors.
- Personalized medicine approaches for hernia repair based on patient-specific factors.
- Expansion into new applications, such as treating other types of hernias (e.g., hiatal hernia).
Growth Accelerators in the Lightweight Hernia Mesh Industry
Long-term growth in the lightweight hernia mesh market will be driven by continuous technological innovation, strategic partnerships between device manufacturers and healthcare providers, and expansion into new geographical markets with high growth potential. The development of next-generation bioabsorbable meshes and smart meshes will play a vital role. Furthermore, strategic alliances with surgeons and hospitals can improve market penetration and adoption rates.
Key Players Shaping the Lightweight Hernia Mesh Market
- BD
- Medtronic
- Johnson & Johnson
- Integra LifeSciences
- Duomed
- DynaMesh
- Gore Medical
- TransEasy
- BioHealth Medical
- ZR MedTech
- Biosis Healing Biological Technology
Notable Milestones in Lightweight Hernia Mesh Sector
- 2020: Launch of a new bioabsorbable mesh by Company X.
- 2021: FDA approval of a smart mesh with integrated sensors by Company Y.
- 2022: Acquisition of Company A by Company B, expanding market reach.
- 2023: Publication of a landmark clinical trial demonstrating the efficacy of a new mesh material.
- 2024: Launch of a minimally invasive surgical device compatible with lightweight meshes.
In-Depth Lightweight Hernia Mesh Market Outlook
The lightweight hernia mesh market is poised for continued growth, driven by persistent demand, technological advancements, and expanding access to minimally invasive surgical procedures. Strategic collaborations and expansion into underserved markets represent significant opportunities for growth. The forecast period (2025-2033) anticipates substantial market expansion, driven by innovation and improved patient outcomes. The market is expected to see significant consolidation as larger players acquire smaller companies, leading to increased competition and innovation.
Lightweight Hernia Mesh Segmentation
-
1. Application
- 1.1. Inguinal Hernia
- 1.2. Abdominal Hernia
- 1.3. Incisional Hernia
- 1.4. Others
-
2. Types
- 2.1. 35g/㎡
- 2.2. 40g/㎡
- 2.3. Others
Lightweight Hernia Mesh Segmentation By Geography
-
1. North America
- 1.1. United States
- 1.2. Canada
- 1.3. Mexico
-
2. South America
- 2.1. Brazil
- 2.2. Argentina
- 2.3. Rest of South America
-
3. Europe
- 3.1. United Kingdom
- 3.2. Germany
- 3.3. France
- 3.4. Italy
- 3.5. Spain
- 3.6. Russia
- 3.7. Benelux
- 3.8. Nordics
- 3.9. Rest of Europe
-
4. Middle East & Africa
- 4.1. Turkey
- 4.2. Israel
- 4.3. GCC
- 4.4. North Africa
- 4.5. South Africa
- 4.6. Rest of Middle East & Africa
-
5. Asia Pacific
- 5.1. China
- 5.2. India
- 5.3. Japan
- 5.4. South Korea
- 5.5. ASEAN
- 5.6. Oceania
- 5.7. Rest of Asia Pacific
Lightweight Hernia Mesh REPORT HIGHLIGHTS
| Aspects | Details |
|---|---|
| Study Period | 2019-2033 |
| Base Year | 2024 |
| Estimated Year | 2025 |
| Forecast Period | 2025-2033 |
| Historical Period | 2019-2024 |
| Growth Rate | CAGR of XX% from 2019-2033 |
| Segmentation |
|
Table of Contents
- 1. Introduction
- 1.1. Research Scope
- 1.2. Market Segmentation
- 1.3. Research Methodology
- 1.4. Definitions and Assumptions
- 2. Executive Summary
- 2.1. Introduction
- 3. Market Dynamics
- 3.1. Introduction
- 3.2. Market Drivers
- 3.3. Market Restrains
- 3.4. Market Trends
- 4. Market Factor Analysis
- 4.1. Porters Five Forces
- 4.2. Supply/Value Chain
- 4.3. PESTEL analysis
- 4.4. Market Entropy
- 4.5. Patent/Trademark Analysis
- 5. Global Lightweight Hernia Mesh Analysis, Insights and Forecast, 2019-2031
- 5.1. Market Analysis, Insights and Forecast - by Application
- 5.1.1. Inguinal Hernia
- 5.1.2. Abdominal Hernia
- 5.1.3. Incisional Hernia
- 5.1.4. Others
- 5.2. Market Analysis, Insights and Forecast - by Types
- 5.2.1. 35g/㎡
- 5.2.2. 40g/㎡
- 5.2.3. Others
- 5.3. Market Analysis, Insights and Forecast - by Region
- 5.3.1. North America
- 5.3.2. South America
- 5.3.3. Europe
- 5.3.4. Middle East & Africa
- 5.3.5. Asia Pacific
- 5.1. Market Analysis, Insights and Forecast - by Application
- 6. North America Lightweight Hernia Mesh Analysis, Insights and Forecast, 2019-2031
- 6.1. Market Analysis, Insights and Forecast - by Application
- 6.1.1. Inguinal Hernia
- 6.1.2. Abdominal Hernia
- 6.1.3. Incisional Hernia
- 6.1.4. Others
- 6.2. Market Analysis, Insights and Forecast - by Types
- 6.2.1. 35g/㎡
- 6.2.2. 40g/㎡
- 6.2.3. Others
- 6.1. Market Analysis, Insights and Forecast - by Application
- 7. South America Lightweight Hernia Mesh Analysis, Insights and Forecast, 2019-2031
- 7.1. Market Analysis, Insights and Forecast - by Application
- 7.1.1. Inguinal Hernia
- 7.1.2. Abdominal Hernia
- 7.1.3. Incisional Hernia
- 7.1.4. Others
- 7.2. Market Analysis, Insights and Forecast - by Types
- 7.2.1. 35g/㎡
- 7.2.2. 40g/㎡
- 7.2.3. Others
- 7.1. Market Analysis, Insights and Forecast - by Application
- 8. Europe Lightweight Hernia Mesh Analysis, Insights and Forecast, 2019-2031
- 8.1. Market Analysis, Insights and Forecast - by Application
- 8.1.1. Inguinal Hernia
- 8.1.2. Abdominal Hernia
- 8.1.3. Incisional Hernia
- 8.1.4. Others
- 8.2. Market Analysis, Insights and Forecast - by Types
- 8.2.1. 35g/㎡
- 8.2.2. 40g/㎡
- 8.2.3. Others
- 8.1. Market Analysis, Insights and Forecast - by Application
- 9. Middle East & Africa Lightweight Hernia Mesh Analysis, Insights and Forecast, 2019-2031
- 9.1. Market Analysis, Insights and Forecast - by Application
- 9.1.1. Inguinal Hernia
- 9.1.2. Abdominal Hernia
- 9.1.3. Incisional Hernia
- 9.1.4. Others
- 9.2. Market Analysis, Insights and Forecast - by Types
- 9.2.1. 35g/㎡
- 9.2.2. 40g/㎡
- 9.2.3. Others
- 9.1. Market Analysis, Insights and Forecast - by Application
- 10. Asia Pacific Lightweight Hernia Mesh Analysis, Insights and Forecast, 2019-2031
- 10.1. Market Analysis, Insights and Forecast - by Application
- 10.1.1. Inguinal Hernia
- 10.1.2. Abdominal Hernia
- 10.1.3. Incisional Hernia
- 10.1.4. Others
- 10.2. Market Analysis, Insights and Forecast - by Types
- 10.2.1. 35g/㎡
- 10.2.2. 40g/㎡
- 10.2.3. Others
- 10.1. Market Analysis, Insights and Forecast - by Application
- 11. Competitive Analysis
- 11.1. Global Market Share Analysis 2024
- 11.2. Company Profiles
- 11.2.1 BD
- 11.2.1.1. Overview
- 11.2.1.2. Products
- 11.2.1.3. SWOT Analysis
- 11.2.1.4. Recent Developments
- 11.2.1.5. Financials (Based on Availability)
- 11.2.2 Medtronic
- 11.2.2.1. Overview
- 11.2.2.2. Products
- 11.2.2.3. SWOT Analysis
- 11.2.2.4. Recent Developments
- 11.2.2.5. Financials (Based on Availability)
- 11.2.3 Johnson & Johnson
- 11.2.3.1. Overview
- 11.2.3.2. Products
- 11.2.3.3. SWOT Analysis
- 11.2.3.4. Recent Developments
- 11.2.3.5. Financials (Based on Availability)
- 11.2.4 Integra LifeSciences
- 11.2.4.1. Overview
- 11.2.4.2. Products
- 11.2.4.3. SWOT Analysis
- 11.2.4.4. Recent Developments
- 11.2.4.5. Financials (Based on Availability)
- 11.2.5 Duomed
- 11.2.5.1. Overview
- 11.2.5.2. Products
- 11.2.5.3. SWOT Analysis
- 11.2.5.4. Recent Developments
- 11.2.5.5. Financials (Based on Availability)
- 11.2.6 DynaMesh
- 11.2.6.1. Overview
- 11.2.6.2. Products
- 11.2.6.3. SWOT Analysis
- 11.2.6.4. Recent Developments
- 11.2.6.5. Financials (Based on Availability)
- 11.2.7 Gore Medical
- 11.2.7.1. Overview
- 11.2.7.2. Products
- 11.2.7.3. SWOT Analysis
- 11.2.7.4. Recent Developments
- 11.2.7.5. Financials (Based on Availability)
- 11.2.8 TransEasy
- 11.2.8.1. Overview
- 11.2.8.2. Products
- 11.2.8.3. SWOT Analysis
- 11.2.8.4. Recent Developments
- 11.2.8.5. Financials (Based on Availability)
- 11.2.9 BioHealth Medical
- 11.2.9.1. Overview
- 11.2.9.2. Products
- 11.2.9.3. SWOT Analysis
- 11.2.9.4. Recent Developments
- 11.2.9.5. Financials (Based on Availability)
- 11.2.10 ZR MedTech
- 11.2.10.1. Overview
- 11.2.10.2. Products
- 11.2.10.3. SWOT Analysis
- 11.2.10.4. Recent Developments
- 11.2.10.5. Financials (Based on Availability)
- 11.2.11 Biosis Healing Biological Technology
- 11.2.11.1. Overview
- 11.2.11.2. Products
- 11.2.11.3. SWOT Analysis
- 11.2.11.4. Recent Developments
- 11.2.11.5. Financials (Based on Availability)
- 11.2.1 BD
List of Figures
- Figure 1: Global Lightweight Hernia Mesh Revenue Breakdown (million, %) by Region 2024 & 2032
- Figure 2: Global Lightweight Hernia Mesh Volume Breakdown (K, %) by Region 2024 & 2032
- Figure 3: North America Lightweight Hernia Mesh Revenue (million), by Application 2024 & 2032
- Figure 4: North America Lightweight Hernia Mesh Volume (K), by Application 2024 & 2032
- Figure 5: North America Lightweight Hernia Mesh Revenue Share (%), by Application 2024 & 2032
- Figure 6: North America Lightweight Hernia Mesh Volume Share (%), by Application 2024 & 2032
- Figure 7: North America Lightweight Hernia Mesh Revenue (million), by Types 2024 & 2032
- Figure 8: North America Lightweight Hernia Mesh Volume (K), by Types 2024 & 2032
- Figure 9: North America Lightweight Hernia Mesh Revenue Share (%), by Types 2024 & 2032
- Figure 10: North America Lightweight Hernia Mesh Volume Share (%), by Types 2024 & 2032
- Figure 11: North America Lightweight Hernia Mesh Revenue (million), by Country 2024 & 2032
- Figure 12: North America Lightweight Hernia Mesh Volume (K), by Country 2024 & 2032
- Figure 13: North America Lightweight Hernia Mesh Revenue Share (%), by Country 2024 & 2032
- Figure 14: North America Lightweight Hernia Mesh Volume Share (%), by Country 2024 & 2032
- Figure 15: South America Lightweight Hernia Mesh Revenue (million), by Application 2024 & 2032
- Figure 16: South America Lightweight Hernia Mesh Volume (K), by Application 2024 & 2032
- Figure 17: South America Lightweight Hernia Mesh Revenue Share (%), by Application 2024 & 2032
- Figure 18: South America Lightweight Hernia Mesh Volume Share (%), by Application 2024 & 2032
- Figure 19: South America Lightweight Hernia Mesh Revenue (million), by Types 2024 & 2032
- Figure 20: South America Lightweight Hernia Mesh Volume (K), by Types 2024 & 2032
- Figure 21: South America Lightweight Hernia Mesh Revenue Share (%), by Types 2024 & 2032
- Figure 22: South America Lightweight Hernia Mesh Volume Share (%), by Types 2024 & 2032
- Figure 23: South America Lightweight Hernia Mesh Revenue (million), by Country 2024 & 2032
- Figure 24: South America Lightweight Hernia Mesh Volume (K), by Country 2024 & 2032
- Figure 25: South America Lightweight Hernia Mesh Revenue Share (%), by Country 2024 & 2032
- Figure 26: South America Lightweight Hernia Mesh Volume Share (%), by Country 2024 & 2032
- Figure 27: Europe Lightweight Hernia Mesh Revenue (million), by Application 2024 & 2032
- Figure 28: Europe Lightweight Hernia Mesh Volume (K), by Application 2024 & 2032
- Figure 29: Europe Lightweight Hernia Mesh Revenue Share (%), by Application 2024 & 2032
- Figure 30: Europe Lightweight Hernia Mesh Volume Share (%), by Application 2024 & 2032
- Figure 31: Europe Lightweight Hernia Mesh Revenue (million), by Types 2024 & 2032
- Figure 32: Europe Lightweight Hernia Mesh Volume (K), by Types 2024 & 2032
- Figure 33: Europe Lightweight Hernia Mesh Revenue Share (%), by Types 2024 & 2032
- Figure 34: Europe Lightweight Hernia Mesh Volume Share (%), by Types 2024 & 2032
- Figure 35: Europe Lightweight Hernia Mesh Revenue (million), by Country 2024 & 2032
- Figure 36: Europe Lightweight Hernia Mesh Volume (K), by Country 2024 & 2032
- Figure 37: Europe Lightweight Hernia Mesh Revenue Share (%), by Country 2024 & 2032
- Figure 38: Europe Lightweight Hernia Mesh Volume Share (%), by Country 2024 & 2032
- Figure 39: Middle East & Africa Lightweight Hernia Mesh Revenue (million), by Application 2024 & 2032
- Figure 40: Middle East & Africa Lightweight Hernia Mesh Volume (K), by Application 2024 & 2032
- Figure 41: Middle East & Africa Lightweight Hernia Mesh Revenue Share (%), by Application 2024 & 2032
- Figure 42: Middle East & Africa Lightweight Hernia Mesh Volume Share (%), by Application 2024 & 2032
- Figure 43: Middle East & Africa Lightweight Hernia Mesh Revenue (million), by Types 2024 & 2032
- Figure 44: Middle East & Africa Lightweight Hernia Mesh Volume (K), by Types 2024 & 2032
- Figure 45: Middle East & Africa Lightweight Hernia Mesh Revenue Share (%), by Types 2024 & 2032
- Figure 46: Middle East & Africa Lightweight Hernia Mesh Volume Share (%), by Types 2024 & 2032
- Figure 47: Middle East & Africa Lightweight Hernia Mesh Revenue (million), by Country 2024 & 2032
- Figure 48: Middle East & Africa Lightweight Hernia Mesh Volume (K), by Country 2024 & 2032
- Figure 49: Middle East & Africa Lightweight Hernia Mesh Revenue Share (%), by Country 2024 & 2032
- Figure 50: Middle East & Africa Lightweight Hernia Mesh Volume Share (%), by Country 2024 & 2032
- Figure 51: Asia Pacific Lightweight Hernia Mesh Revenue (million), by Application 2024 & 2032
- Figure 52: Asia Pacific Lightweight Hernia Mesh Volume (K), by Application 2024 & 2032
- Figure 53: Asia Pacific Lightweight Hernia Mesh Revenue Share (%), by Application 2024 & 2032
- Figure 54: Asia Pacific Lightweight Hernia Mesh Volume Share (%), by Application 2024 & 2032
- Figure 55: Asia Pacific Lightweight Hernia Mesh Revenue (million), by Types 2024 & 2032
- Figure 56: Asia Pacific Lightweight Hernia Mesh Volume (K), by Types 2024 & 2032
- Figure 57: Asia Pacific Lightweight Hernia Mesh Revenue Share (%), by Types 2024 & 2032
- Figure 58: Asia Pacific Lightweight Hernia Mesh Volume Share (%), by Types 2024 & 2032
- Figure 59: Asia Pacific Lightweight Hernia Mesh Revenue (million), by Country 2024 & 2032
- Figure 60: Asia Pacific Lightweight Hernia Mesh Volume (K), by Country 2024 & 2032
- Figure 61: Asia Pacific Lightweight Hernia Mesh Revenue Share (%), by Country 2024 & 2032
- Figure 62: Asia Pacific Lightweight Hernia Mesh Volume Share (%), by Country 2024 & 2032
List of Tables
- Table 1: Global Lightweight Hernia Mesh Revenue million Forecast, by Region 2019 & 2032
- Table 2: Global Lightweight Hernia Mesh Volume K Forecast, by Region 2019 & 2032
- Table 3: Global Lightweight Hernia Mesh Revenue million Forecast, by Application 2019 & 2032
- Table 4: Global Lightweight Hernia Mesh Volume K Forecast, by Application 2019 & 2032
- Table 5: Global Lightweight Hernia Mesh Revenue million Forecast, by Types 2019 & 2032
- Table 6: Global Lightweight Hernia Mesh Volume K Forecast, by Types 2019 & 2032
- Table 7: Global Lightweight Hernia Mesh Revenue million Forecast, by Region 2019 & 2032
- Table 8: Global Lightweight Hernia Mesh Volume K Forecast, by Region 2019 & 2032
- Table 9: Global Lightweight Hernia Mesh Revenue million Forecast, by Application 2019 & 2032
- Table 10: Global Lightweight Hernia Mesh Volume K Forecast, by Application 2019 & 2032
- Table 11: Global Lightweight Hernia Mesh Revenue million Forecast, by Types 2019 & 2032
- Table 12: Global Lightweight Hernia Mesh Volume K Forecast, by Types 2019 & 2032
- Table 13: Global Lightweight Hernia Mesh Revenue million Forecast, by Country 2019 & 2032
- Table 14: Global Lightweight Hernia Mesh Volume K Forecast, by Country 2019 & 2032
- Table 15: United States Lightweight Hernia Mesh Revenue (million) Forecast, by Application 2019 & 2032
- Table 16: United States Lightweight Hernia Mesh Volume (K) Forecast, by Application 2019 & 2032
- Table 17: Canada Lightweight Hernia Mesh Revenue (million) Forecast, by Application 2019 & 2032
- Table 18: Canada Lightweight Hernia Mesh Volume (K) Forecast, by Application 2019 & 2032
- Table 19: Mexico Lightweight Hernia Mesh Revenue (million) Forecast, by Application 2019 & 2032
- Table 20: Mexico Lightweight Hernia Mesh Volume (K) Forecast, by Application 2019 & 2032
- Table 21: Global Lightweight Hernia Mesh Revenue million Forecast, by Application 2019 & 2032
- Table 22: Global Lightweight Hernia Mesh Volume K Forecast, by Application 2019 & 2032
- Table 23: Global Lightweight Hernia Mesh Revenue million Forecast, by Types 2019 & 2032
- Table 24: Global Lightweight Hernia Mesh Volume K Forecast, by Types 2019 & 2032
- Table 25: Global Lightweight Hernia Mesh Revenue million Forecast, by Country 2019 & 2032
- Table 26: Global Lightweight Hernia Mesh Volume K Forecast, by Country 2019 & 2032
- Table 27: Brazil Lightweight Hernia Mesh Revenue (million) Forecast, by Application 2019 & 2032
- Table 28: Brazil Lightweight Hernia Mesh Volume (K) Forecast, by Application 2019 & 2032
- Table 29: Argentina Lightweight Hernia Mesh Revenue (million) Forecast, by Application 2019 & 2032
- Table 30: Argentina Lightweight Hernia Mesh Volume (K) Forecast, by Application 2019 & 2032
- Table 31: Rest of South America Lightweight Hernia Mesh Revenue (million) Forecast, by Application 2019 & 2032
- Table 32: Rest of South America Lightweight Hernia Mesh Volume (K) Forecast, by Application 2019 & 2032
- Table 33: Global Lightweight Hernia Mesh Revenue million Forecast, by Application 2019 & 2032
- Table 34: Global Lightweight Hernia Mesh Volume K Forecast, by Application 2019 & 2032
- Table 35: Global Lightweight Hernia Mesh Revenue million Forecast, by Types 2019 & 2032
- Table 36: Global Lightweight Hernia Mesh Volume K Forecast, by Types 2019 & 2032
- Table 37: Global Lightweight Hernia Mesh Revenue million Forecast, by Country 2019 & 2032
- Table 38: Global Lightweight Hernia Mesh Volume K Forecast, by Country 2019 & 2032
- Table 39: United Kingdom Lightweight Hernia Mesh Revenue (million) Forecast, by Application 2019 & 2032
- Table 40: United Kingdom Lightweight Hernia Mesh Volume (K) Forecast, by Application 2019 & 2032
- Table 41: Germany Lightweight Hernia Mesh Revenue (million) Forecast, by Application 2019 & 2032
- Table 42: Germany Lightweight Hernia Mesh Volume (K) Forecast, by Application 2019 & 2032
- Table 43: France Lightweight Hernia Mesh Revenue (million) Forecast, by Application 2019 & 2032
- Table 44: France Lightweight Hernia Mesh Volume (K) Forecast, by Application 2019 & 2032
- Table 45: Italy Lightweight Hernia Mesh Revenue (million) Forecast, by Application 2019 & 2032
- Table 46: Italy Lightweight Hernia Mesh Volume (K) Forecast, by Application 2019 & 2032
- Table 47: Spain Lightweight Hernia Mesh Revenue (million) Forecast, by Application 2019 & 2032
- Table 48: Spain Lightweight Hernia Mesh Volume (K) Forecast, by Application 2019 & 2032
- Table 49: Russia Lightweight Hernia Mesh Revenue (million) Forecast, by Application 2019 & 2032
- Table 50: Russia Lightweight Hernia Mesh Volume (K) Forecast, by Application 2019 & 2032
- Table 51: Benelux Lightweight Hernia Mesh Revenue (million) Forecast, by Application 2019 & 2032
- Table 52: Benelux Lightweight Hernia Mesh Volume (K) Forecast, by Application 2019 & 2032
- Table 53: Nordics Lightweight Hernia Mesh Revenue (million) Forecast, by Application 2019 & 2032
- Table 54: Nordics Lightweight Hernia Mesh Volume (K) Forecast, by Application 2019 & 2032
- Table 55: Rest of Europe Lightweight Hernia Mesh Revenue (million) Forecast, by Application 2019 & 2032
- Table 56: Rest of Europe Lightweight Hernia Mesh Volume (K) Forecast, by Application 2019 & 2032
- Table 57: Global Lightweight Hernia Mesh Revenue million Forecast, by Application 2019 & 2032
- Table 58: Global Lightweight Hernia Mesh Volume K Forecast, by Application 2019 & 2032
- Table 59: Global Lightweight Hernia Mesh Revenue million Forecast, by Types 2019 & 2032
- Table 60: Global Lightweight Hernia Mesh Volume K Forecast, by Types 2019 & 2032
- Table 61: Global Lightweight Hernia Mesh Revenue million Forecast, by Country 2019 & 2032
- Table 62: Global Lightweight Hernia Mesh Volume K Forecast, by Country 2019 & 2032
- Table 63: Turkey Lightweight Hernia Mesh Revenue (million) Forecast, by Application 2019 & 2032
- Table 64: Turkey Lightweight Hernia Mesh Volume (K) Forecast, by Application 2019 & 2032
- Table 65: Israel Lightweight Hernia Mesh Revenue (million) Forecast, by Application 2019 & 2032
- Table 66: Israel Lightweight Hernia Mesh Volume (K) Forecast, by Application 2019 & 2032
- Table 67: GCC Lightweight Hernia Mesh Revenue (million) Forecast, by Application 2019 & 2032
- Table 68: GCC Lightweight Hernia Mesh Volume (K) Forecast, by Application 2019 & 2032
- Table 69: North Africa Lightweight Hernia Mesh Revenue (million) Forecast, by Application 2019 & 2032
- Table 70: North Africa Lightweight Hernia Mesh Volume (K) Forecast, by Application 2019 & 2032
- Table 71: South Africa Lightweight Hernia Mesh Revenue (million) Forecast, by Application 2019 & 2032
- Table 72: South Africa Lightweight Hernia Mesh Volume (K) Forecast, by Application 2019 & 2032
- Table 73: Rest of Middle East & Africa Lightweight Hernia Mesh Revenue (million) Forecast, by Application 2019 & 2032
- Table 74: Rest of Middle East & Africa Lightweight Hernia Mesh Volume (K) Forecast, by Application 2019 & 2032
- Table 75: Global Lightweight Hernia Mesh Revenue million Forecast, by Application 2019 & 2032
- Table 76: Global Lightweight Hernia Mesh Volume K Forecast, by Application 2019 & 2032
- Table 77: Global Lightweight Hernia Mesh Revenue million Forecast, by Types 2019 & 2032
- Table 78: Global Lightweight Hernia Mesh Volume K Forecast, by Types 2019 & 2032
- Table 79: Global Lightweight Hernia Mesh Revenue million Forecast, by Country 2019 & 2032
- Table 80: Global Lightweight Hernia Mesh Volume K Forecast, by Country 2019 & 2032
- Table 81: China Lightweight Hernia Mesh Revenue (million) Forecast, by Application 2019 & 2032
- Table 82: China Lightweight Hernia Mesh Volume (K) Forecast, by Application 2019 & 2032
- Table 83: India Lightweight Hernia Mesh Revenue (million) Forecast, by Application 2019 & 2032
- Table 84: India Lightweight Hernia Mesh Volume (K) Forecast, by Application 2019 & 2032
- Table 85: Japan Lightweight Hernia Mesh Revenue (million) Forecast, by Application 2019 & 2032
- Table 86: Japan Lightweight Hernia Mesh Volume (K) Forecast, by Application 2019 & 2032
- Table 87: South Korea Lightweight Hernia Mesh Revenue (million) Forecast, by Application 2019 & 2032
- Table 88: South Korea Lightweight Hernia Mesh Volume (K) Forecast, by Application 2019 & 2032
- Table 89: ASEAN Lightweight Hernia Mesh Revenue (million) Forecast, by Application 2019 & 2032
- Table 90: ASEAN Lightweight Hernia Mesh Volume (K) Forecast, by Application 2019 & 2032
- Table 91: Oceania Lightweight Hernia Mesh Revenue (million) Forecast, by Application 2019 & 2032
- Table 92: Oceania Lightweight Hernia Mesh Volume (K) Forecast, by Application 2019 & 2032
- Table 93: Rest of Asia Pacific Lightweight Hernia Mesh Revenue (million) Forecast, by Application 2019 & 2032
- Table 94: Rest of Asia Pacific Lightweight Hernia Mesh Volume (K) Forecast, by Application 2019 & 2032
Frequently Asked Questions
1. What is the projected Compound Annual Growth Rate (CAGR) of the Lightweight Hernia Mesh?
The projected CAGR is approximately XX%.
2. Which companies are prominent players in the Lightweight Hernia Mesh?
Key companies in the market include BD, Medtronic, Johnson & Johnson, Integra LifeSciences, Duomed, DynaMesh, Gore Medical, TransEasy, BioHealth Medical, ZR MedTech, Biosis Healing Biological Technology.
3. What are the main segments of the Lightweight Hernia Mesh?
The market segments include Application, Types.
4. Can you provide details about the market size?
The market size is estimated to be USD XXX million as of 2022.
5. What are some drivers contributing to market growth?
N/A
6. What are the notable trends driving market growth?
N/A
7. Are there any restraints impacting market growth?
N/A
8. Can you provide examples of recent developments in the market?
N/A
9. What pricing options are available for accessing the report?
Pricing options include single-user, multi-user, and enterprise licenses priced at USD 3950.00, USD 5925.00, and USD 7900.00 respectively.
10. Is the market size provided in terms of value or volume?
The market size is provided in terms of value, measured in million and volume, measured in K.
11. Are there any specific market keywords associated with the report?
Yes, the market keyword associated with the report is "Lightweight Hernia Mesh," which aids in identifying and referencing the specific market segment covered.
12. How do I determine which pricing option suits my needs best?
The pricing options vary based on user requirements and access needs. Individual users may opt for single-user licenses, while businesses requiring broader access may choose multi-user or enterprise licenses for cost-effective access to the report.
13. Are there any additional resources or data provided in the Lightweight Hernia Mesh report?
While the report offers comprehensive insights, it's advisable to review the specific contents or supplementary materials provided to ascertain if additional resources or data are available.
14. How can I stay updated on further developments or reports in the Lightweight Hernia Mesh?
To stay informed about further developments, trends, and reports in the Lightweight Hernia Mesh, consider subscribing to industry newsletters, following relevant companies and organizations, or regularly checking reputable industry news sources and publications.
Methodology
Step 1 - Identification of Relevant Samples Size from Population Database


Step 2 - Approaches for Defining Global Market Size (Value, Volume* & Price*)

Note*: In applicable scenarios
Step 3 - Data Sources
Primary Research
- Web Analytics
- Survey Reports
- Research Institute
- Latest Research Reports
- Opinion Leaders
Secondary Research
- Annual Reports
- White Paper
- Latest Press Release
- Industry Association
- Paid Database
- Investor Presentations

Step 4 - Data Triangulation
Involves using different sources of information in order to increase the validity of a study
These sources are likely to be stakeholders in a program - participants, other researchers, program staff, other community members, and so on.
Then we put all data in single framework & apply various statistical tools to find out the dynamic on the market.
During the analysis stage, feedback from the stakeholder groups would be compared to determine areas of agreement as well as areas of divergence
